
 ?Mathematical formulae have been encoded as MathML and are displayed in this HTML version using MathJax in order to improve their display. Uncheck the box to turn MathJax off. This feature requires Javascript. Click on a formula to zoom.
ABSTRACT
Investigating Service Quality (SQ) and its implications for customer satisfaction has become an increasingly popular research area. Especially in the context of physical grocery retailing, ensuring customer satisfaction has become a key success factor. Most previous research studies apply traditional methods (e.g. surveys) for physical shops and utilize text mining-based approaches mainly for e-commerce. In our paper, we propose a novel approach based on LDA. By combining expert-based word counting analysis with the LDA approach, we confirm that unsupervised text mining based on LDA can be used as a reliable approach to cluster textual comments to SQ dimensions in physical retail settings. We have analyzed over 163,000 publicly available textual customer reviews related to the Austrian market, which is special in terms of its extremely high density of retail outlets, high price levels and a tendency towards traditional form of shopping. Our results show that personal interaction, policies, and product-related aspects seem to be positive drivers of customer satisfaction, while reliability is a clear driver of customer dissatisfaction. Results also show a significantly higher relevance of personal interaction in smaller stores and cities with fewer than 5,000 inhabitants than in other store types and bigger cities. Regarding practical implications, hypermarkets should focus on physical aspects to reduce negative reviews and increase efforts in personal interaction to increase positive reviews. On the other hand, smaller stores should continue to rely on personal interaction to avoid negative reviews and might focus on higher reliability to generate more positive reviews. The applied text-mining approach enables future research with a starting base to analyze SQ dimensions and their relevance in additional countries or area, as e.g. fashion or hardware retail.
Introduction
The last two decades have witnessed significant changes in consumer behavior, resulting in a notable increase in consumers shifting from offline to online purchasing or adopting omnichannel shopping systems (Park and Kim Citation2022). This trend is particularly pronounced in the fashion industry (Patten et al. Citation2020), the electronics and technical products sector (Lazaris et al. Citation2022; Park, Yang, and Kim Citation2023) and was pushed by the COVID-19 pandemic. On the other hand, the purchasing behavior of commodities and daily goods in countries like Austria, as well as internationally, has shown little change, remaining largely unaffected by COVID-19. Physical supermarkets continue to be the predominant source for such products (Daher Citation2021; Dominici et al. Citation2021). Still, more intense price competition presents a significant challenge in the food retailing sector, forcing retailers to be more sensitive to quality and service-related issues.
Low service quality (SQ) serves as the primary motivation for customers to switch to competitors (Slack, Singh, and Sharma Citation2020). Unsurprisingly, the assessment of service quality has frequently been debated by researchers in a variety of contexts. Recently, many researchers have examined Service Quality Dimensions (SQD) in the hotel and travel industry (Chandra Mahapatra and Bellamkonda Citation2023; Moro et al. Citation2020; Nilashi et al. Citation2022), the health sector (Meesala and Paul Citation2018), the banking sector (Zhou et al. Citation2021), in the context of delivery services (Uzir et al. Citation2021) or with a focus on special technologies like self-checkouts (Ciechanowski Citation2021). However, the analysis of service quality (SQ) in the physical retail context is considerably more intricate than a straightforward assessment of pure service quality. It involves considering various factors, such as customer interaction, customers’ path to market outlets, and the availability of alternative products, all of which can significantly influence the customer’s perception of the overall service or perceived quality (Dabholkar, Thorpe, and Rentz Citation1996). Physical retailers need to be aware of activities and offerings that increase loyalty and satisfaction of customers (Amorim and Bashashi Citation2014). Unfortunately, there is still a limited amount of work exploring the link between SQ dimensions and consumer satisfaction in physical food retailing and supermarket chains (Slack, Singh, and Sharma Citation2020), especially with regard to smaller countries with a high density of retail markets, such as Austria (Brandtner et al. Citation2021).
Although existing research shows a clear interest in analyzing and comparing SQ across various countries and cultures (Ahmad, Ali, and Omar Citation2014), the main SQ assessment models lack universal validity across countries and sectors (Jain and Aggarwal Citation2018) and their connection to customer satisfaction (Al-Deehani and Aldeehani Citation2017). The different number and type of SQ dimensions, the varying relevance of the dimensions and differences of results in one the same application area and country shows that there is no consensus in literature. The level of service orientation varies among European countries due to cultural differences existing between them (Carraher, Parnell, and Spillan Citation2009). This has been confirmed by research investigating SQ in different regions, for instance in the Commonwealth of Independent States (Das, Kumar, and Saha Citation2010), India (Jain and Aggarwal Citation2018), Malaysia and Turkey (Ahmad, Ali, and Omar Citation2014), in Central European countries (Carraher, Parnell, and Spillan Citation2009), Hong-Kong (Siu and Chow Citation2004) and many more. It was found that demographic factors influence the way customers evaluate various dimensions of service quality. All these countries show different characteristics in terms of retail outlet density, SQ expectations and cultural habits. Especially for smaller countries in Central Europe with a high density of retail outlets, research in this area is missing.
The physical food retailing sector in Austria has several unique characteristics, making it difficult to compare to other countries. First, Austria has one of the highest numbers of grocery retail outlets per capita in Europe and beyond. Second, due to a relatively high income, the Austrian supermarket sector also has one of the highest price levels for drinks and food, making Austrian consumers highly quality-sensitive and increasing their willingness to spend higher amounts of money on quality goods. At the same time, service quality expectations might also be higher. Third, due to the extremely high density of retail outlets, operating costs for retail chains are higher than in other countries. The same applies to profitability, which is much higher than e.g. in Germany or other European countries (Špička Citation2016). Ninety-five percent of the Austrian food retail market are distributed among four main players, while many smaller supermarkets share the remaining 5% (Salihovic Citation2023). Fourth, Austrian consumers have a strong tendency towards cash payment and a comparably lower acceptance of digital means of payment (Bagnall et al. Citation2014; Höpperger and Rusu Citation2022; Schroth, Vyborny, and Ziskovsky Citation2022) and show a low willingness to adopt online grocery shopping with a strong preference towards traditional ways of shopping (Staab et al. Citation2023). Austria in general shows a low usage of new technology in retail outlets (as e.g. self-checkouts) (Stieninger et al. Citation2021) and has comparably stricter and limited operating hours for retail stores. Furthermore, the evaluation of Austrian culture reveals that Austria has a relatively low Power Distance Index (Hofstede Citation2011), suggesting minimal power distance within Austrian society. It scores moderately on individualism, indicating a balanced approach between individual and collective interests. Austria exhibits a high score on masculinity and uncertainty Avoidance, reflecting a strong emphasis on traditional gender roles and a preference for structured environments. Austrians also demonstrate a moderate long-term orientation, emphasizing perseverance and thrift. Finally, Austria – at least in a European context – tends toward indulgence, suggesting a societal acceptance of enjoying life and fulfilling personal desires (Hofstede Citation2015). As stated, the environment in which we live plays a crucial role in molding our personal values and how we choose to manifest them (Sagiv and Schwartz Citation2022). The correlation between culture and the perceived relative significance of service quality dimensions, as well as the utilization of this correlation for market segmentation and resource allocation, can also be investigated by integration of literature from the fields of service quality and cross-cultural anthropology Furrer et al. (Citation2000). Concerning their study, Austrians are clustered into the group of balance seekers, assigning equal importance to each dimension of SQ, with the exception of tangibles. This suggests that while they highly value functional aspects of service provision, a lower emphasis might be placed on the aesthetic or visual aspects of the service environment.
All these particularities in terms of culture and mindset might have an impact on SQ and customer satisfaction in physical grocery retail and justify the investigation of cultural differences and its impact (Minkov and Hofstede Citation2014; Zhang, Beatty, and Walsh Citation2008). In summary, although the Austrian grocery retail sector and its specific characteristics represent an interesting research area for SQ-related analysis, the amount of recent research on what constitutes SQ in such specific markets is rather low and might be outdated (Hackl, Scharitzer, and Zuba Citation2000; Hoffmann and Schnedlitz Citation2009). New insights regarding the Austrian market could challenge general assumptions of what constitutes and drives customer satisfaction. Previous studies have often focused on different countries and regions, and the comparison of Austria and its particularities with other countries and their particularities provides an addition to the current knowledge about SQ and its impact on customer satisfaction.
To fill this gap, our primary aim in this paper is to extract the main dimensions of SQ and their recent impact on consumer satisfaction in Austrian food retailing companies. To achieve this goal, a text mining-based analysis of over 163.000 textual reviews and over 500.000 star-based ratings is conducted to investigate the significance of SQ dimensions regarding their impact on consumer satisfaction. Social media data is used in this analysis due to its comprehensive level of customers’ views without any research intervention and influence (Brandtner et al. Citation2021). Furthermore, it provides the basis for several sub-analyses, as e.g. focusing on store types, regions and contrasting it to the satisfaction rating belonging to a textual comment. Partially, this has been done in the previous research, e.g. in Goić et al. (Citation2021), where a traditional, survey-based approach was applied to analyze differences of SQ dimensions across different store types. They analyzed data collected during post-purchase questionnaires across 60 stores in a large city in Latin America. Overall, they generated 25.000 valid responses, covering a time span of 5 years. As mentioned, our study followed a different approach and analyses publicly available data. Details of our methodological approach are provided in Materials and Methods section.
For separation of concern, we break down the main research aim into three research questions. First, based on previous research by e.g. Goić et al. (Citation2021), Arrondo et al. (Citation2002), Clarke and Banga (Citation2010) or in the Austrian context by Foscht et al. (Citation2008), the type of store (i.e. small, medium or large or other categories) might play a differentiating role regarding customer satisfaction. Literature confirms that consumers’ selection between store types is influenced by factors such as price level, product variety, distance (Solgaard and Hansen Citation2003), nature of merchandise and services offered, and store design (Bonfrer, Chintagunta, and Dhar Citation2022). The importance for retailers to make specific decisions that are based on the unique characteristics of each retail format is recognized in literature. For example, in medium-sized supermarkets, it was found that it is essential to focus on improving reliability to ensure customer satisfaction. For smaller specialty stores, a strength lies in their store policy, encompassing factors such as product variety, quality, freshness, and well-established brands. This aspect is crucial in shaping customers’ perception of service quality, in which specialty stores excel. However, both specialty stores and supermarkets need to enhance their performance in the personnel dimension as a key quality dimension (Anselmsson and Johansson Citation2014). In one of the very few previous studies focusing on the Austrian market, it was discovered that in smaller stores, interpersonal engagement emerges as a potent factor contributing to customer satisfaction, unlike in larger supermarkets (Foscht et al. Citation2008). That interestingly is in contrast to Amorim and Bashashi (Citation2014) who found that enhancing personal interaction has been identified as crucial element of SQ in larger retail store types. Hence, we define our first research question as follows:
Q1: How does the importance of SQ dimensions (i.e. the number of review comments related to them) varies across different store types?
Besides store type, another element that might influence customer satisfaction and its variance across different SQ dimensions is city size. Previous research found that city size has an impact of what services and offers a customer might expect in a retail outlet (Léo and Philippe Citation2002). Similarly, Ding and Li (Citation2022) found that city size influences consumption preferences and expectations of consumers. In another study conducted by Ieva and Ziliani (Citation2018), city size was used as an available proxy for lifestyle and education, which might also influence SQ perception. As customer satisfaction is measured as the deviation between expected and actual perceived SQ, city size might hence have an impact on SQ and the relevance of its single dimensions. While previous literature investigated for example how city size impacts general shopping behaviour (Ding and Li Citation2022) or the probability to switch to online grocery shopping (G. Clarke, Thompson, and Birkin Citation2015), the specific impact of city size in customer satisfaction and its specific dimensions is still little researched, especially in countries like Austria. Hence, we defined the second research questions as follows:
Q2: Is there a difference in perceived importance of SQ dimensions (based on the number of review comments related to them) in different city types?
Previous research on SQ dimensions in physical retail outlets has also discussed, how and which specific SQ dimensions might influence customer satisfaction. Negative remarks tend to highlight attributes that fell short of customer expectations (Zhang et al. Citation2012). Conversely, positive reviews are characterized by elevated sentiment scores often accentuating attributes that delighted the user (Antony et al. Citation2023). Mägi and Julander (Citation1996) measured different SQ dimensions and their impact on overall customer satisfaction in a Swedish retail chain. Similarly, Naik et al. (Citation2010) also emphasized the importance of identifying the impact of SQ dimensions on customer satisfaction. Focusing on fresh food attributes in hypermarkets, Kadyan and Jenefa (Citation2019) analysed the significance of the relationship between SQ dimensions and customer satisfaction. Their results partially indicated significant relationships between the single SQ dimensions and overall customer satisfaction. Hence, SQ dimensions clearly impact overall customer satisfaction; however, the specific dominance of each dimension might vary depending on the given circumstances of analysis. Yokoyama et al. (Citation2022) indicate that the way customers perceive store location and retail format affects customer satisfaction in terms of moderation. Furthermore, the assessment of convenience had a greater impact on customer satisfaction for individuals. By investigating the relation between attributes and its satisfaction score, it becomes feasible to deduce which attributes to prioritize. To address this issue, we defined the final and third research question as follows:
Q3: How does the significance of different SQ dimensions (based on the number of review comments related to them) vary regarding customer satisfaction level?
The remainder of the paper is structured as follows: section two provides an overview of the research background of the paper, i.e. SQ assessment in retail. Section 3 introduces the method of the paper, followed by section 4 presenting the results. In section five, we provide a detailed discussion of results on the level of the defined research questions. Section 6 includes the paper, also providing an overview of limitations and future research opportunities.
Research background: service quality assessment in retail
In previous decades, the rise of e-commerce and retail market competitiveness has led to market players acting more efficiently than in past times. Retailers are forced to pay more attention to customer satisfaction issues than they previously had to. Among service-related topics, customer satisfaction and service quality are two of the four main subjects in the last two decades (Donthu et al. Citation2022). Service quality is often described as an attitude that arises from comparing expectations with performance. However, there is some ambiguity in the definition and conceptualization of service quality. While researchers acknowledge that consumers’ perception of service quality is closely aligned with the disconfirmation paradigm, they also argue that service quality and satisfaction are distinct constructs. The main difference between the two is that service quality is a long-term overall evaluation, while satisfaction is a measure specific to a particular transaction (Cronin and Taylor Citation1992). As one of the early approaches to measure SQ, the Gap model has been developed by Parasuraman et al. (Citation1985). They proposed that service quality is a function of the differences between expectation and performance along the quality dimensions. More precisely, they introduced five types of gaps, i.e. the gap between i) consumers’ expectations and management perception, ii) management perception and service quality specification, iii) service quality specification and service delivery, iv) service delivery and external communications, and iv) expected service and perceived service (Parasuraman, Zeithaml, and Berry Citation1985). According to their model, SQ is the overall function of perception and expectations. Reedifying the Gap model, SERVQUAL, developed by Parasuraman, Zeithaml and Berry (Citation1988), has become a widely recognized and extensively used model for assessing service quality (Parasuraman, Zeithaml, and Berry Citation1988). However, SERVQUAL does not universally apply to all service industries respectively service types (Tešić Citation2020).
Subsequently, regarding the conceptualization and measurement of SERVQUAL, a distinct approach called SERVPERF has been developed by Cronin and Tailor (Citation1992). This approach emphasizes that service quality is a type of consumer attitude, while the performance-only measurement of service quality serves as an improved method for assessing service quality (Cronin and Taylor Citation1992). SERVPERF differs from SERVQUAL as it solely assesses customers’ perceptions of the actual service performance, without considering the gap between expectations and perceptions (Cronin and Taylor Citation1994). In Dabholkar et al. (Citation1996) an alternative model of service quality for technology-based self-service options was proposed. Their SQ dimensions included physical aspects, reliability, personal interaction, and problem-solving and policy measures (RSQS). They stated that RSQS relies much more on customers’ perception of a service rather than on their expectations. This study has been followed by Siu and Tak‐Hing Cheung (Citation2001), who added convenience to the previous dimensions. Later, Amorim and Bashashi Saghezchi (Citation2014) studied service assessment in retail and proposed physical aspects, reliability, personal interaction, and policies in the retail area. Kevrekidis et al. (Citation2018) and Nikolova et al. (Citation2017) also assessed SQ in pharmaceutical retail shops.
Vázquez et al. (Citation2001) consider both the level of service provided and the quality of the sold products as part of SQ. Their model CALSUPER exhibits a predominant applicability within the context of supermarkets. RSQS modified by Martinelli and Balboni (Citation2012) mentioned that customers’ perception of service quality in retail stores influences their loyalty. This study treats perceived service quality as a higher-level concept, consisting of four underlying aspects: reliability, physical aspects, personal interaction, and policies. The aim of their study was to understand the role of perceived service quality as a crucial factor in shaping customer loyalty.
The plethora of methods to assess SQ in physical retail stems from the 1980s, the 1990s or the early 2000s. A decline in the development of new SQ models is observable from the early 2000s onwards, where a stronger shift towards e-commerce related satisfaction measurement models could be observed (Boyd Citation2002; Lin Citation2007; Liu et al. Citation2008). Papers started to invest the applicability of SQ dimensions identified for physical retail in an online context (Cox and Dale Citation2001). In the current paper, we lay an emphasis on methods that have been applied to and developed for measuring SQ in the physical retail sector. provides a comparison of SQ dimensions used in relevant previous studies.
Table 1. Comparison of selected SQ dimensions in previous studies.
In a retail analysis in Austria, customer satisfaction dimensions are clustered in five groups (Hackl, Scharitzer, and Zuba Citation2000). The first group is related to the staff and the interaction and kindness of them. The second group is related to shopping cleanliness and shop look. The third group is related to product availability and quality of products. Price-performance and customer orientation are the last two dimensions.
In the current paper, we have employed the SQ dimensions introduced by Vázquez et al. (Citation2001), which have been extensively examined in the supermarket industry. These dimensions encompass physical aspects, personal interactions, reliability, and policies as the primary SQ dimensions in this domain. Nevertheless, in alignment with the findings of Hackl et al. (Citation2000) and Siu and Tak‐Hing Cheung (Citation2001), we have expanded this list by incorporating the SQ dimension related to product aspects, referred to as ‘product.’ These aspects are also commonly addressed in numerous reviews within our dataset.
As shown in , we hence use the following main and sub SQ dimensions to assess SQ in the current paper and classify the textual review comments accordingly.
Table 2. Research service quality dimension.
Subsequently, these focal SQ dimensions are explained in detail. Physical aspects focus on the measurement of the physical details and presence of stores and store formats regarding store appearance and accommodation. The shop image, the neatness of the store, the tidiness, the store format, and the ability to discover things in the store have been essential components of physical perceptions of retail stores in the past. Assessment of this SQ dimension also includes factors such as the shop’s comfort and design (Band et al. Citation2021).
Reliability is related to the accuracy of how a retail store is perceived to do its business. In our research and in this SQ dimension, we consider the correctness and reliability of announcements, product availability, product return and waiting time as central element of perceived reliability. This dimension hence strongly shows if a retail store is capable of delivering and performing as expected or not (Ogiemwonyi et al. Citation2020).
Personal interaction is defined by how customers perceive their interaction with store staff (Dabholkar, Thorpe, and Rentz Citation1996). Measures in this dimension strongly rely on trust and a feeling of being treated respectfully and professionally in the course of staff interactions (Band et al. Citation2021). It also relies on problem-solving capabilities of staff, i.e. the level of acceptance of customer complaints and staff knowledge in handling customer problems on an individual level.
Policy is related to general rules and principles defined by a store in terms of store accessibility and availability (i.e. operating hours or parking and general facilities). It also includes the regulation and management of private labels; the general usage of promotions and discounts and the handling respectively approach to payment options (Dabholkar, Thorpe, and Rentz Citation1996).
The product dimension is related to issues on the level of specific products. In previous research (Brandtner et al. Citation2021), product-related issues have also been considered as part of the policy dimension. However, in accordance with Hackl et al. (Citation2000) and Siu and Tak‐Hing Cheung (Citation2001) and based on an initial analysis of our dataset, we have included the product dimension as a new, separate dimension. Product related SQ sub-dimensions include product price, product quality and product variety.
Materials and methods
Different approaches have been used to assess SQ in the past. The previously mentioned SERVQUAL (Dabholkar, Thorpe, and Rentz Citation1996; Shokouhyar, Shokoohyar, and Safari Citation2020) used structured questionnaires to gather information about SQ in predefined dimensions. While providing a good benchmark for future analysis, the possibility of bias and issues regarding the quality of answers and the generalizability of results are mentioned as drawbacks of this method (Basfirinci and Mitra Citation2015). Similarly, other research applied surveys to analyze the SQ in the context of mobile shopping focusing on student data (Omar et al. Citation2021). Additional approaches build on post-service feedback. While having the highest response rate, information density is limited by narrow questions directly after receiving a service (Dholakia, Singh, and Westbrook Citation2010). Expert inputs are another common approach in SQ assessment. This technique gathers information from experts’ point of view with small samples of selected and experienced experts (Korfiatis et al. Citation2019). Consumer sentiment analysis represents methods used to analyze satisfaction levels based on public data. Usually, results are presented in three clusters, i.e. positive, negative, and neutral. Hence, it is highly related to an overall assessment of SQ without deeper insights into specific domains (Dhaoui, Webster, and Tan Citation2017). Topic modeling with Latent Dirichlet Allocation (LDA) is a more advanced approach, able to overcome most of the mentioned limitations. However, two problems remain: First, defining the number of topics can be arbitrary and is depending on the interpretability of the area under investigation by the researchers (Korfiatis et al. Citation2019). Second, as LDA is an unsupervised machine learning technique where researchers have a minimum level of control over the results, the algorithm may just group textual elements based on frequency and correlation. Hence, it may result in irrelevant clusters from a business point-of-view (Shahbazi and Byun Citation2020).
Previous literature has also analyzed the applicability of online reviews to extract knowledge through textual analysis of comments (Li et al. Citation2023; Moro et al. Citation2020; Nasseri et al. Citation2023). In Li et al. (Citation2023), customer concerns regarding service quality during COVID-19 were analyses using social media analytics based on twitter data related to five UK supermarkets. Text mining has recently also been applied in the context of analyzing brand image and brand positioning (Alzate, Arce-Urriza, and Cebollada Citation2022). One of the key barriers to analyze online reviews is struggling with the unstructured shape of data. To avoid unstructured text analysis, Radojevic et al. (Citation2017) used star rating-based analysis on hoteling SQ. They have analyzed the level of customer satisfaction based on customer characteristics and expected quality. Service quality assessment with unstructured text has been examined by Korfiatis et al. (Citation2019), using Structural Topic Models (STM) and LDA. Following this approach, they were able to consider different service classes in customer satisfaction based on service quality. In Palese and Usai (Citation2018), a combination of traditional and text mining-based approaches was applied to extract SQ dimensions from an Italian product comparison website.
Based on our initial literature review, most previous research studies apply traditional methods (e.g. surveys) for traditional business models such as physical shops and utilize text mining-based approaches mainly for e-commerce or online services such as tourism. Hence, studies that apply text mining analysis in physical stores are rare (Darbanian et al. Citation2024). In recent times, the availability of online review websites such as Google reviews provides a reliable platform to gather unbiased data from customers in physical stores. The novelty of our approach is, that we build our SQ assessment approach on publicly available review data and apply text mining for different food retailing companies (i.e. the main players in Austria), which can eliminate the effect of narrow sampling.
In our study, text mining is defined as the extraction of previously unknown, implicit, and potentially valuable patterns and information in a (semi-) automated manner from big volumes of natural-language texts (Hassani et al. Citation2020). More precisely, to investigate the level of satisfaction in each SQ dimension, we analyze web data from Google reviews and extract the star rating related to each comment on a level from 1 to 5, where 1 represents the least satisfaction and 5 shows the maximum satisfaction level. Following Brandtner et al. (Citation2021), we consider 1 and 2 stars to indicate dissatisfaction, 3 to represent neutral satisfaction levels and 4 and 5 to indicate high satisfaction levels.
To analyze differences between differently sized cities, we divided the location of Austrian stores into three groups, i.e. small cities with a population of less than 5.000 inhabitants, medium-size cities with a population between 5,000 and 40,0000 and big cities with a population over 40,000.
Regarding the identification of communalities and differences between different store types, Bonfrer et al. (Citation2022) have introduced characteristics for food retail stores. These stores have been categorized based on their size and type of services offered. Supermarkets fall under the medium- to large-sized selling space category. Discounters share similarities with supermarkets in terms of location and size but offer limited customer service, fewer product choices, stronger emphasis on private labels, and a consistent low-price strategy. Mass merchandisers encompass various retail formats including warehouse clubs (e.g. Costco) and supercenters or hypermarkets (e.g. Walmart). Convenience stores, often owned and operated by retail chains (e.g. 7-Eleven), include ‘forecourt’ retailers situated in or near gasoline stations. Specialty stores usually indicate operators with smaller selling spaces akin to convenience stores. These are frequently independently owned. We have further refined this classification for Austrian stores, resulting in five distinct types. Specifically, we have divided them into the following store types based on their shop size and alignment with the predetermined characteristics (cf. ):
Table 3. Categorization of different story types and sizes.
Regarding the specific details of our methodological approach, we apply a text mining-based analysis of textual data along the three stages as depicted in . In stage I, we presented the way we gathered our dataset from Google reviews and elaborate, how data preparation was done. In Stage II, the two different methods used for text mining analysis and assigning SQ dimensions to reviews are explained. The final stage of our methodology consists of the application of stage I and II results to assign SQ dimensions and analyze the results for the defined research questions.
Figure 1. Methodology of the paper.
Subsequently, the methodological details and the intermediate results of stage I and II are presented in Materials and Methods sections. The actual results of SQ assessment are then presented in detail and on the level of the defined research questions in Results section.
Stage I: data acquisition and data preparation
Data acquisition was done based on publicly available review data. More precisely, the dataset was collected based on more than 500,000 extracted google reviews regarding the five biggest food retail chains in Austria. In addition, we were able to gather 163,055 of textual google reviews that have been used in this study to analyze SQ on the level of the defined SQ dimensions. The timespan of analysis was about 41 months, ranging from January 2017 to May 2020. The method of extraction was designed based on previous work by (Borrego and Comalat Navarra Citation2021; Lee and Yu Citation2018; Udokwu et al. Citation2020). Each review entity is finally composed of the following features (cf. ):
Figure 2. Features of the review data collected and generated.
The main challenge in reviewing texts was the different length of the comments. Although the length limitation of Google reviews is 4000 characters, the actual length was much shorter. More precisely, we came across comments ranging from one character or one emoji to the longest comment with 58 words (i.e.
‘This is a special store, which has more specialties and international food. Therefore, it’s a good place to look for things you don’t find elsewhere. But it tends to be crowded, probably because of its convenient location, and doesn’t have the largest selection of non-specialty items, so it is not my first choice for regular shopping.’).
To cope with these highly different types and lengths of comments, the first step in the analysis was using Python and Regex function to clear the text corpus. We used the ‘stop words’ library to remove invaluable words such as ‘up’, ‘to’, ‘ours’ etc. Then, by using NLTK platform to tokenize the corpus, the final review sentence from the original text could e.g. look as follows:
[‘``’,‘favorite’,‘food’,‘store’,‘haid’,‘,’,‘negative’,‘thing’,‘careful’,‘pay’,‘…’,‘used’,‘clea er’,‘year’,‘back’,‘``’],
After this, we removed punctuations and no text words such as numbers and emojis. Following this, we identified unique words. The generated corpus contained 26.000 unique words. After reconsidering ‘the’ and other meaningless words, we faced 21.672 words, where about 11.000 of them were observed only one time. Some were related to dictation errors, and some were fundamentally meaningless, like ‘hmm’ or ‘supiiii’. After removing these from the corpus, we conducted word stemming with the ‘Lancaster Stemmer’ and extract the root of the corpus’s used words. An overview of the steps conducted in stage I is provided in the following .
Figure 3. Text-preprocessing pipeline and steps in stage I.
Stage II: text mining analysis
Word counting analysis
To reach a better understanding of the inputs, we decided to apply SQ dimensions to reviews based on most repeated words and experts’ knowledge. To this end, we selected the 1.000 most repeated words (keywords) and started allocating these words to related SQ dimensions. provides an overview of most frequent words.
Figure 4. Distribution and frequency of words in the textual comments.
To assign the keywords to the defined SQ dimensions, we first selected verbs indicating a specific action and then added related nouns. In this step, we gathered 1,000 most repeated words and removed connecting words such as ‘also’. Then, we applied peer debriefing (Brandtner Citation2018), consisting of three experts to allocate each keyword to the SQ dimensions. The first group of words indicated personal interaction. This group contained words in the form of either verbs, representing particular activities related to the area, adjectives or adverbs, describing a relative situation in a particular way, or nouns, that directly indicate the dimension or sub-dimension. Key word allocation was done in the same style for the remaining four SQ dimensions. The final library of allocated keywords is illustrated in .
Table 4. Keyword library for word-counting-based assignment of words to SQ dimensions.
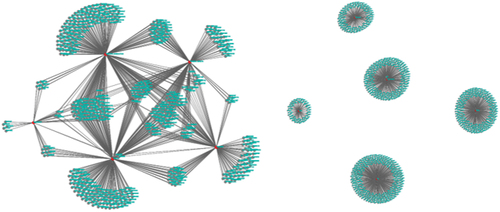
Building on these words, we allocated topics respectively SQ dimensions to each review. provides a schematic, high-level overview of the connection of keywords to different reviews (keyword-to-review’-connection).
Figure 5. High-level overview of exemplary “keyword-to-review” connections.
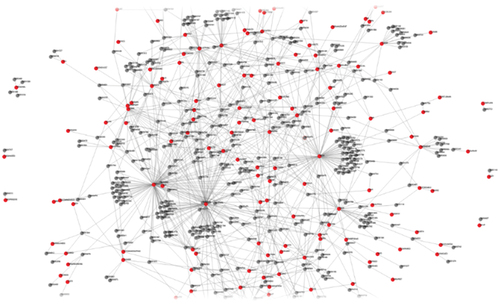
In this figure, the red points represent the keywords, and the grey points show the connected reviews. To allocate topics, we built on the logic of the word library of keywords (cf. ) and considered the proportion of keywords from each SQ dimension. More precisely, we have allocated reviews to SQ dimensions based on frequency of keywords from the single SQ dimensions. For example, if a review covered three keywords from the SQ dimensions of ‘personal interaction’ and one from the SQ dimension of ‘product’, the review would be assigned to the dimension of personal interaction (a ‘weight’ or frequency of keywords of 0.75 to 0.25). provides on overview of exemplary textual review comments and their allocation to SQ dimensions based on these weights. The highest proportion is underlined and depicted in bold.
Table 5. Word counting method topic allocation.
LDA analysis
Topic modeling is an unsupervised machine learning technique and represents a powerful and practical technique for analyzing large text documents in Natural language processing (NLP). Topic modeling enables the analysis of collections of distributions over words for defined topics and allows for identifying the relationship of topics with each document. Latent Dirichlet Allocation (LDA) (Tong and Zhang Citation2016) is an example of a topic model, which can be used to classify text in a document to particular topics. LDA has recently been used in a variety of retail related settings, e.g. in the context of product improvement or sales planning (Park, Yang, and Kim Citation2023), in online fashion renting experiences (Lang, Li, and Zhao Citation2020), software engineering for analyzing main topics in computer forums (Yao et al. Citation2023; Yu and Xiang Citation2023), for doing literature reviews (Yu and Xiang Citation2023), or for opinion analysis in social media posts in twitter (Uthirapathy and Sandanam Citation2023). Hence, LDA has become a highly efficient algorithm for topic modeling that creates topics by analyzing word frequency within a collection of documents. It has gained significant popularity for extracting topics from user-generated data, specifically for tasks such as motivation analysis and risk identification (Lang, Li, and Zhao Citation2020).
LDA builds a ‘topic per document’-model and a ‘words per topic’-model, modeled as Dirichlet distributions. LDA can automatically cluster words into topics and discover relationships between documents from a dataset.
For example, we can assume a two-topic model of a customer review dataset, including ‘product price’ and ‘product quality’. The most common words in ‘product price’ might be ‘cash’, ‘cheap’, ‘expensive’ and ‘good’ and for ‘product quality’ might be ‘comfortable’, ‘delicious’, ‘expiration’ and ‘good’. shows a simple example for understanding how topic modelling techniques work.
Figure 6. Overview of basic functions of topic modelling techniques.
We have used the LDA technique to assign words to topics and topics to comments, considering the five defined dimensions as our topics. Our LDA implementation procedure for analyzing customer reviews is summarized in .
Figure 7. LDA implementing procedure.
As depicted in , four sequential steps have been applied in our LDA implementation. Steps 1 and 2 are part of stage I, as previously described. Subsequently, we have used the output of these initial two steps as an input dataset for applying LDA in the third step. We used the TM library in R, providing the stop word list and the word stemmer used to prepare the dataset for LDA implementation. Then, the number of topics was fixed (Hornik and Grün Citation2011), which – in accordance with our literature review – focused on the five defined SQ dimensions presented in Research Background section. Hence, we used five topics (k = 5) representing the five SQ dimensions. Applying LDA to the dataset was done by the ‘topic models’ package with Gibbs sampling method (Hornik and Grün Citation2011).
To identify the main characteristics of topics and compare all topics simultaneously, we considered the words that had the greatest difference in per-topic-per-word probabilities between topics. Per-topic-per-word probabilities are called ‘beta’ and are one of the outputs of LDA analysis. Subsequently, we have used the formula (1) to estimate the main characteristics of topics and relate them to our SQ dimensions:
A log ratio in this formula is used for making the difference symmetrical. To limit comparison to a set of especially relevant words, we can filter for relatively common words by considering only words that have a beta value greater than 1/1000 in all topics. According to the charts shown in , we can derive, which words make up a topic.
Figure 8. “Per-topic-per-word”-probabilities (Beta) of words between the topics in LDA-based word assignment.
For example, ‘market’ is among the main contents in topic 1, while ‘price’ is rather uncommon in this topic cluster. Similarly, ‘fresh’ is the most common word in topic cluster 2, while ‘park’ is extremely unlikely to belong to this cluster. By comparing one topic with all the others simultaneously, we can draw conclusions about the uniqueness of individual words in the topics. Therefore, we can define the name of the five topics based on our main SQ dimensions. The resulting distribution of each dimension is depicted in .
Figure 9. Topic distribution.
As depicted in , most reviews are connected to the SQ dimension ‘policy’, while ‘products’ is the dimension with the least percentage among the others. To assign one dimension per review and to improve the results of the text mining analysis, we allocated each review in the data set to the topic with the highest affinity score in .
Figure 10. Assignment of SQ dimensions to reviews.
Stage III: evaluating the LDA model
We adopted human reading-based comparison to evaluate the topic generation. After assigning each document a specified topic with the highest affinity, we randomly selected 2% of the reviews and manually tested test the assigned topic. Then, we calculated the inter-rater reliability (IRR) with Cohen’s Kappa coefficients (Wongpakaran et al. Citation2013) between the computer topic selection and human topic selection with different numbers of clusters (formula (2)).
Where is the chance agreement probability. We experienced the highest rate of IRR with five groups (overall Cohen’s Kappa: 0.72).
The final results of SQ dimension assignment are shown in . Combining the results, policy had the highest gravity in customer reviews. 30.9% of all reviews mentioned this specific dimension. The second rank belongs to personal interaction with 21,7%, the third rank to reliability with 20.1% and the fourth to physical aspects with 14.9%. Results for the fifth SQ dimension proved our initial idea to have a separate cluster related to product-focused reviews. More than 12% of all reviews are related to product issues.
Table 6. Share of SQ dimension in customer reviews.
In the next section, we provide a detailed overview of results on the level of the three main research questions of the paper.
Results
The results of the paper are presented in accordance with the initially defined research questions and focus on the comparison of SQ dimensions and their importance amongst different store types, different sized cities and between different levels of satisfaction associated with textual comments. To this end, we calculated chi-square value (formula (3)) to test for significance of independence. In order to compare the differences between proportions (e.g. between different store types, city size or satisfaction level), we have conducted a Z-test (Sutherland et al. Citation2020) to compare the proportion of each SQ dimension in each of the five different types of stores (as depicted in ) and each of the three city size types (i.e. small, medium and large) as well as the satisfaction levels (i.e. satisfied, neutral, dissatisfied), as follows:
Comparison of SQ dimensions in different store types
With a very high level of significance (chi-square value of 1761.82), the results show that the importance of SQ dimensions varies across different store types. As depicted in , comments regarding personal interaction are more often related to type B stores, such as supermarkets, than to type D stores, such as hypermarkets. Hence, personal interaction is seen as a highly important SQ dimension (both for satisfaction and dissatisfaction) in normal supermarkets. In comparison, it plays a less important role in hypermarkets, gas stations or specialty stores.
Figure 11. Relevance of SQ dimension importance in different store types.
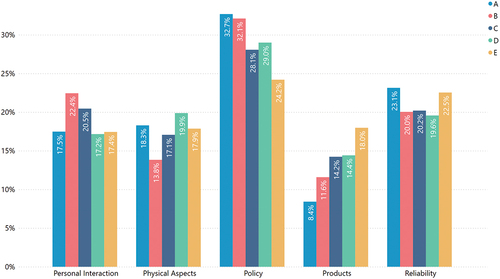
Unsurprisingly, results show that the SQ dimension ‘product’ is especially relevant in specialty stores and has only a limited relevance in gas stations. Customers shopping in such type of stores hence have high expectations toward product-related issues, such as product quality and product price.
For gas station stores on the other hand, reliability-related aspects, such as waiting time or announcements and their correctness were most important. Same applies to specialty stores, where reliability is also a highly relevant SQ dimension in terms of product return.
Physical aspects had the least importance in terms of driving customer satisfaction in normal supermarkets. This might be due to the fact that people are familiar with store layout, facilities and environment and have fixed expectations which are fulfilled in most of the times. For supermarkets, personal interactions and policy-related aspects like communication and politeness or promotions and discounts are much more important.
Overall, policy was the most important SQ dimension across all store types. Issues like payment options, parking, connection to public transport as well as private labels and promotions and discounts are relevant in most customer reviews. However, for specialty stores, this dimension was comparably low. An explanation could be that such stores do not have issues in this dimension. Comments focus much more on product-related issues and general policies as well as personal interaction seem to be causing no negative feedback. provides an overview of the importance of the different SQ dimensions across the five store types, where A = gas station, B = supermarkets, C = large supermarkets, D = hypermarkets and E = specialty stores.
The following provides a detailed overview of these results, which are based on two-sided tests using significance level of 0.05. The percentage of comments in each SQ dimension for each store type is stated. For each significant pair, the category with the smaller proportion is shown in the category with the larger proportion.
Table 7. Relevance of SQ dimensions and significant differences in different store types.
Comparison of SQ dimensions in different sized cities
Regarding the relevance of the five SQ dimensions in different sized cities, a significant difference could be found, with a chi-square value of 761,682. However, in comparison with the difference across store types, this significance level is lower. Hence, the importance of the different SQ dimensions is much more differing in store different types than in different city sizes.
As depicted in , the results show a high relevance of personal interaction in small cities with less than 5.000 inhabitants. In comparison to medium and big-sized cities, this might be due to cultural issues and potentially lower expectations regarding other SQ dimensions as e.g. physical aspects. In contrast, physical aspects and reliability are significantly more important for SQ in big cities than in medium and small cities, respectively also significantly more important in medium than in small cities. Issues such as provided shopping material, store environment as well as store layout, waiting time and correctness of advertisements are much more responsible for driving customer satisfaction in big and medium-sized cities than they are in small cities.
Figure 12. Relevance of SQ dimension importance in different city sizes.
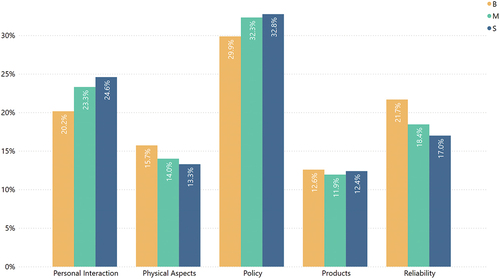
Regarding product related SQ sub-dimensions, a significant difference could only be found between big and medium-sized cities. In big cities, product quality and product variety tend to be much more relevant from customers’ point of view than in medium-sized cities. In small cities however, product quality and availability are also important factors of SQ. Yet, no significant difference to medium-sized cities could be found.
Reliability is least important in small cities, a significant difference to big and medium cities could be found. Reasons might include the much stronger focus on personal interaction, which might offset reliability-related expectations like waiting time or announcements. provides an overview of the importance of the different SQ dimensions across the three city sizes, where B = big, M = medium and S = small-sized cities.
The following provides a detailed overview of these results, which are based on two-sided tests using significance level of 0.05. The percentage of comments in each SQ dimension for each city size is stated. For each significant pair, the category with the smaller proportion is shown in the category with the larger proportion.
Table 8. Relevance of SQ dimensions and significant differences in different city sizes.
Comparison of SQ dimensions in different levels of customer satisfaction
The most significant difference regarding the relevance of the respective SQ dimensions could be found in comparison to customer satisfaction level (chi-square value of 27.231). Compared to differences in regard to store type and city size, the results for the three customer satisfaction levels (i.e. dissatisfied, neutral and satisfied) showed the highest differences if SQ dimension importance ranking. This means that SQ dimensions can very accurately be matched to customer satisfaction levels, while the accuracy of identifying the differences in terms of the impact of city size and store type between these SQ dimensions is lower. As depicted in , customer reviews associated with personal interaction, policy and product-related aspects are often connected to positive reviews, i.e. satisfied customers. In contrast, comments related to the SQ dimension of reliability are with a very significance resulting in low levels of customer satisfaction, i.e. in dissatisfied customers. For physical aspects, comments are significantly higher connected to neutral or dissatisfied satisfaction levels, than to satisfied customers.
Figure 13. Relevance of SQ dimension importance in different levels of customer satisfaction.
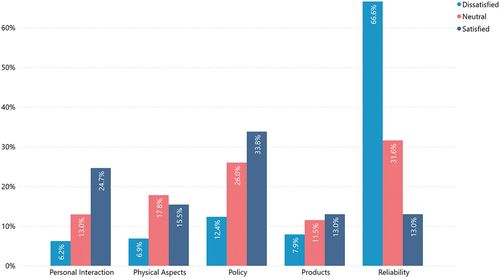
Reasons for this clear difference between the SQ dimensions and their relevance regarding satisfaction or dissatisfaction maybe as follows. First, it seems that personal interaction is an unexpected, positive factor resulting in higher levels of satisfactions. Normal staff behaviour or even impolite staff seems to be expected to some level, while friendly, communicative, and caring staff is a positive and unexpected satisfaction driver. Similarly, policy-related aspects such as convenient parking, a variety of payment options or the availability and suitability of private labels are unexpected and positive satisfaction factors. Customers tend to rather mention strengths in these sections, then to complain about potential weaknesses. Surprisingly, product-related comments focusing on product price, quality, availability, and variety also seem to be more positive satisfaction drivers than negative factors resulting in dissatisfaction.
On the other hand, the very significant and clear dominance of reliability-related issues in dissatisfied customers is acceptable. Reasons could include problems in terms of waiting time, incorrect communication or presentation of announcements related to discounts and product return-related problems. Hence, retailers should generally focus on short waiting times in e.g. the cold-meats counter and especially at cashier desks. A special emphasis should also be laid on the reliability of announcements. Publicly communicated discounts should also be shown in the store and past discounts, which are not valid anymore, should not be shown on the shelves and be removed timely. The handling of product return related to expired and damaged or to wrongly sized products should also be handled with high care. All these sub-dimensions strongly result in high levels of dissatisfaction.
The following provides a detailed overview of these results, which are based on two-sided tests using significance level of 0.05. The percentage of comments in each SQ dimension for each satisfaction level is stated. For each significant pair, the category with the smaller proportion is shown in the category with the larger proportion.
Table 9. Relevance of SQ dimensions and significant differences in satisfaction levels.
Discussion of results
The discussion of results and their implications are split into four main categories: i) discussion of our research approach (i.e. text mining based on LDA in physical retail settings, ii) discussion of results and their implications regarding SQ dimensions in different store types (i.e. gas stations, supermarkets, large supermarkets, hypermarkets and specialty stores), iii) discussion of results and their implications regarding SQ dimensions in different city sizes (i.e. small cities (<5.000 inhabitants), medium cities (5.000–40.000 inhabitants) and large cities (>40.000 inhabitants)), and iv) discussion of results and their implications regarding SQ dimensions in different customer satisfaction levels (i.e. dissatisfied, neutral and satisfied).
Regarding (i), our research approach, we have developed and applied a text mining-based analysis of customer satisfaction comments following the three staged-approach presented in Materials and Methods section. Compared to existing research in a similar context as e.g. Park et al. (Citation2023), we did not simply rely on LDA only, but we chose a combination of word counting analysis and LDA to assign the optimum number of SQ dimensions to customer reviews, which we applied the results of the LDA algorithm output. By doing so, we ensured an expert-based assignment of comments to SQ dimensions where possible via word count and weight and used LDA where this was not feasible due to the large number of comments. It was found that LDA is a powerful method with 0.72 Cohen’s Kappa values. Using large amounts of unstructured text data, LDA models provide inductive findings based on identifying patterns and topics from the data, without relying on preconceived notions. On the other hand, the combination with word counting helps to overcome the mentioned limitations of LDA (Korfiatis et al. Citation2019; Shahbazi and Byun Citation2020) by aligning the LDA results with expert classification. To the best of our knowledge, such combined method has not yet been applied in the context of analyzing customer satisfaction.
Regarding (ii) the relevance of SQ dimensions across different store types, our results indicate clear differences. Personal interaction was found to be highly relevant in normal supermarkets while product-related aspects were mostly relevant for reviews connected to specialty stores Similar results have been found in Amorim and Bashashi Saghezchi (Citation2014) for Portugal. They also stated that expectations regarding personal interaction and relationships are higher in smaller stores than e.g. in hypermarkets. Their results were derived based on Portuguese customer reviews; our study confirms this finding also for Austrian customers. Another study by Goić et al. (Citation2021) also confirms that elements of personal interaction, i.e. staff competence, are significantly higher important for SQ in smaller convenience stores than in larger supermarkets and hypermarkets. Compared to Italy, where customers more acknowledge physical aspects and reliability as the primary dimensions making significant contributions to their loyalty (Martinelli and Balboni Citation2012). A reason could be found in the fact that Italians have a higher power distance, which is characteristics for sensory seekers paying higher attention to tangibles (Vianelli et al. Citation2007).
For the Austrian market, previous research found that personal interaction is a strong driver of customer satisfaction in smaller, more specialized stores than in larger supermarkets (Foscht et al. Citation2008). In this study, it was also found that customers might react very differently to higher degrees of personal interaction in different store types; hence, they suggest separate approaches for different store types. Our research derived similar findings, also indicating that high personal interaction is expected in smaller outlets and might be unexpected and to certain extents inappropriate in larger settings.
In contrast to a previous study by Huddleston et al. (Citation2009), we found that within all specialty store ratings, policy was the most important driver of customer satisfaction, followed by reliability as the second and product-related aspects as the third most important category. While personal interaction was found to be the least important dimension within all specialty store ratings, Huddleston et al. (Citation2009) found that customer service was the most important in such stores. Their study was conducted in 2009 and by means of a survey within ten US states with 494 respondents. An explanation could be found in the fact, that, according to Hofstede (Citation2015), indulgence is much higher in the U.S.A. than in Austria, which might result in a higher expectation regarding communication and interaction in specialty stores.
Also, they stated that price was the second most important driver of satisfaction in their study, while our study indicates a lower importance of price and product-related features and a much higher importance of policy and reliability dimensions in specialty stores instead. This could also be explained by cultural differences as the uncertainty avoidance treat is much higher in Austrian than in US culture. Hence, Austrians might show a stronger wish for and a higher relevance of policy and reliability-related dimensions in the specific context of specialty stores, where customers go to buy unique and special items rather than standard groceries.
For normal supermarkets, Huddleston et al. (Citation2009) stated product assortment, price, and employee service as the most important drivers of satisfaction. Our results are partially in line with this, also showing that personal interaction is the second most important category of customer satisfaction in normal supermarkets. Regarding the importance of product assortment, we identified the availability of private labels as an important driver of customer satisfaction, while the overall product variety was and product-related aspects were the least important drivers for supermarkets, showing much higher relevancy for hypermarkets and specialty stores. However, these differences might be due to the partially overlapping definition of what constitutes a normal or conventional supermarket in their and in our paper.
While our study confirmed a significantly higher relevance of product-related topics for specialty stores than for all other analysed store types (compared within the product-related dimension), reliability and policy are even more important within the category of specialty stores. Similarly, previous research also found that for specialty stores, product-related issues are central drivers of SQ (Yusuf, Nurhilalia, and Putra Citation2019). However, it must be noted here that overall product-related aspects play a very limited role in terms of customer satisfaction.
Additionally, we have also identified that reliability issues are most common in gas station stores; hence, they are central driver of customer satisfaction there. This was partially also stated in previous research by Bei and Shang (Citation2006), where the authors indicate a high relevance of reliability in gas station stores, especially for ensuring fast service and limited waiting times in peak hours. However, due to the limited sample size of such stores, we could not reach a significant level for this statement. For specialty stores, reliability was also found to be highly relevant, more precisely, it is significantly higher relevant than for supermarkets, large supermarkets, and hypermarkets.
Physical aspects where most relevant for customer satisfaction in hypermarkets. This is in line with previous research (Mzoughi and Garrouch Citation2022) and could be explained by the much larger story area and the resulting difficulties in finding products and using store equipment compared to smaller market types. Also, the study by Goic et al. (Citation2021) found equivalent results: they stated that aspects related to accessing the store and its facilities are much more important in hypermarkets and supermarkets than in smaller stores. This can be explained by the complexity, scale, and location of hypermarkets, where customers might otherwise struggle to conduct efficient shopping routines.
Overall, policy showed the highest relevance across all store types. Payment options, parking, connection to public transport as well as private labels and promotions and discounts are relevant in most customer reviews. This is in line with previous research, where the SQ dimension of policies also proved to be most relevant for customer satisfaction (Amorim and Bashashi Citation2014). However, partially in contrast to previous work by Goić et al. (Citation2021) in Latin America, policy-related aspects were found to be of significantly higher relevance in normal supermarkets than in large supermarkets or hypermarkets.
Regarding (iii) the differences in SQ dimension importance in different sized cities, we were able to identify some significant variations. Unsurprisingly, and in line with Amorim and Bashashi Saghezchi (Citation2014), personal interaction was significantly more important in small cities with less than 5.000 inhabitants. This might be due to closer contact in smaller communities than in larger cities. Similarly, previous research has shown that this may represent a comparative advantage of smaller, neighborhood retails stores to larger retail outlets (Sriramesh, Moghan, and Lim Citation2007).
Physical aspects in turn were significantly higher relevant in big cities with more than 50.000 inhabitants. This statement confirms previous research by Mzoughi and Garrouch (Citation2022) and fits to the previously mentioned relevance of physical aspects in hypermarkets. Hypermarkets are most often found in larger cities; hence, the findings for this store type could also be true in large cities.
Personal interaction was significantly less important in big cities and hypermarkets than in medium or small cities or other, i.e. smaller store types. However, this is not true for reliability, which was least important in hypermarkets compared to other store types, and significantly more important in large cities compared to small or medium cities. Reliability was least important in small cities, which might be due to the much higher importance of personal interaction and hence lower perceived importance or expectation of reliability issues. A study by Sriramesh et al. (Citation2007) found that higher expectations in larger cities and neighborhoods regarding reliability might also be due to the fact, that employees in larger stores have more time for refilling shelves, checking the store, and dealing with customer returns than those in smaller neighborhoods, where employees might more be under the scrutiny of store managers. Although this might be an additional explanation, our study could neither confirm nor deny this claim, yet we confirm higher expectations for reliability in larger cities. Another explanation for differences in this dimension might be due to corporate culture and central regulations, which might put a higher emphasis on standards and hence reliability in larger outlets and cities than in smaller ones.
Regarding the most significant areas for differences in SQ dimension importance, i.e. (iv) customer satisfaction level, the following highly significant findings have been made. The most important SQ dimensions in terms of driving dissatisfaction are reliability-related issues like waiting time, wrong or incorrect announcements or product return issues. This is in line with Amorim and Bashashi Saghezchi (Citation2014), where reliability was also the dimension subject to greater dissatisfaction. In contrast, high levels of customer satisfaction are significantly depending on the SQ dimensions of policy, personal interaction, and product-related issues. More precisely, personal interaction is significantly higher relevant for satisfied than dissatisfied or neutral levels of customer satisfaction. Also, personal interaction is significantly more important in neutral levels of satisfaction than in dissatisfied customers’ reviews. Same is true for policies and products. Hence, personal interaction, policies and product-related aspects seem to be positive drivers of customer satisfaction, while reliability is a clear driver of customer dissatisfaction. This in line with previous work, stating that reliability is the most important factor driving customer satisfaction (Chakraborty, Srivastava, and Marshall Citation2007; Haming et al. Citation2019). Also, in Goić et al. (Citation2021) it was found that reliability-related aspects such as waiting time are highly associated with positive reviews. Surprisingly, other research done by Siu and Chow (Citation2004) found a much weaker relevance of reliability with regard to customer satisfaction. They stated that the discrepancy between their results and those from previous study regarding reliability warrants further examination. Our study could not confirm their statement, but rather is in accordance with the broader body of literature that states a high relevance of reliability for customer satisfaction (Amorim and Bashashi Citation2014).
Regarding personal interaction, similar findings were also produced in previous literature. Siu and Chow (Citation2004) identified personal interaction as the most important driver of positive customer satisfaction. Physical aspects did not show a high relevance in satisfied or dissatisfied reviews but were most often connected to neutral satisfaction levels.
Conclusion and limitations
Determining which dimension of service quality is more important can vary depending on the specific context, industry, and customer preferences. The purpose of this study was to investigate differences related to the importance of service quality dimensions among different types of stores, in different sized cities and across different levels of customer satisfaction. Based on word counting and LDA analysis, we have analysed over 163.000 textual customer reviews related to Austrian retail outlets. We have assigned each of these comments to one of the following five SQ dimensions: personal interaction, physical aspects, policy, products and reliability. We have compared the relevance of these dimensions and their significant cultural differences on the level of different store types, in differently sized cities and in different levels of customer satisfaction.
In Austria, cultural habits play a significant role in shaping customer expectations and perceptions of service quality. Austrian society values interpersonal relationships, community bonds, and personalized interactions, which are deeply rooted in cultural norms and practices. These cultural habits have meaningful influence on how customers evaluate service experiences and prioritize different dimensions of service quality. Results show e.g. a significantly higher relevance of personal interaction in smaller stores and cities with less than 5.000 inhabitants than in other store types and bigger cities. Physical aspects proved to be significantly higher relevant in hypermarket and gas stations than in normal supermarkets or large supermarkets. This aligns with Austria’s cultural inclination towards close-knit communities, where individuals value personalized attention and meaningful interactions with service providers. In such settings, customers expect a level of familiarity and the feeling of comfort with store personnel, making personal interaction a crucial determinant of service quality.
The density of retail outlets in a particular area can affect competition levels, customer choices, and service quality expectations. In Austria, especially in densely populated regions or urban centers, customers might have access to a wide range of retail options, leading to higher expectations regarding service quality. On the other hand, in rural or less densely populated areas, where retail options are limited, customers might have different priorities and tolerances regarding service quality.
In policy-related reviews concerning payments, the prevailing expectation is to mention the emergence of self-checkout options for the new generation of payments. However, this transition has yet to occur, as Austrian customers still show a strong preference for cash payments.
Cultural norms, emphasizing interpersonal relationships and personalized interactions, significantly shape customer expectations and perceptions of service quality. For instance, personal interaction was found to be more crucial in smaller stores and cities. Conversely, hypermarkets placed higher importance on physical aspects due to their layout and scale.
Based on our findings, we have derived several implications for practice and academia. The implications for practice are manifold: First, managers of normal supermarkets should strongly emphasize on the quality of personal interaction. Especially in smaller stores, this is a highly relevant determinant of customer satisfaction. Second, hypermarket management should focus on a logical and understandable store layout and the provision of appropriate shopping material as shopping carts or baskets. On the other hand, if hypermarkets put an emphasis on personal interaction, a positive impact on customer satisfaction could be achieved. As interaction expectations are low in large cities and hypermarkets and as personal interaction is – overall – the strongest driver of high customer satisfaction, this might result in improved customer satisfaction in larger stores and cities. Same applies to reliability in supermarket and smaller cities, where expectations are much more focused on personal interaction. As reliability being the most negative driver of satisfaction, a stronger focus on issues like waiting time, product return or reliability of announcements could improve customer satisfaction in this context. We hence also confirm an adjustment of managerial decisions regarding SQ dimension based on store type and city size. Moreover, the density of retail outlets in an area influences competition levels and customer expectations. In densely populated regions, customers may have higher service quality expectations, while in rural areas with fewer options, priorities may differ.
Based on our initial literature review, most previous research studies apply traditional methods (e.g. surveys) for traditional business models such as physical shops and utilize text mining-based approaches mainly for e-commerce or online services such as tourism. The novelty of our approach is, that we build our SQ assessment approach on publicly available review data and apply text mining for different, physical food retailing companies (i.e. the main players in Austria), which can eliminate the effect of narrow sampling. Hence, in terms of our method applied, the implications to research are as follows: First, we confirm that unsupervised text mining based on LDA can be used as a reliable approach to cluster textual comments to SQ dimensions in physical retail settings. This could be confirmed by the combination of an expert-based word counting analysis and the described LDA approach. Second, we have provided of the first analysis of customer satisfaction that investigated significant differences of SQ dimensions on the level of satisfied, neutral, and unsatisfied customers.
The main limitation of our study might be the focus on Austrian customer reviews only. Results might not be generalizable for other countries and cultural patterns. However, we have compared our results with similar studies from e.g. Portugal, U.S.A., Asia and Latin America and found interesting differences as well as similarities. A second limitation might be the fact, that each customer comment was assigned to one SQ dimension only. In case a comment focusses on more than one dimensions, we hence potentially miss some information. Future research could conduct a similar study with an adopted LDA approach, which focuses on a sentence-based topic assignment and not on complete comments. However, in the present case, most comments consisted of only one sentence or were very short. Sentence-based assignment of topic could therefore be a difficult task and is only possible for a small proportion of the collected comments. Another limitation might be due to potentially low levels of customers expressing their reviews and satisfaction experiences online. Reasons include a limited willingness to participate in such online reviews (Nedbal et al. Citation2013). Similarly, there might be the possibility of fake customer reviews, which could also impact results (Salminen et al. Citation2022). By analyzing over 163.000 comments over the duration of 3,5 years, we tried to counteract this potentially low proportion of customers expressing their satisfaction online. Due to the high number of comments, we tried to also limit the impact of a small number of possible fake comments.
Like existing research studies, we confirm the relevance of different managerial approaches to increasing and/or maintaining customer satisfaction in different store types and areas. While reliability is strongly driving customer dissatisfaction, the expected reliability level is lower in smaller stores than in hypermarkets and gas station. Hence, large stores and hypermarkets must focus on reliability to avoid negative comments while smaller ones could potentially create positive feedback out of higher reliability as expectations are lower than perceived aspects. In contrast, personal interaction was exactly the opposite: while for smaller store in smaller cities high levels of interaction are expected, in hypermarkets personal interaction is not expected to be high. Hence, to increase positive comments, hypermarkets should focus on high interaction quality to lead to higher perceived than expected levels. This in turn could result in more customers providing positive reviews.
This paper provides several starting points for future research. First, as mentioned, the assignment of SQ dimensions of comments could be done at a sentence-based level. Second, as our analysis only covered several months of COVID-related reviews, future research should elaborate on changes in SQ dimension relevance due to the pandemic. Third, applying our approach to different countries and additional store types, e.g. fashion or hardware stores, could contribute to a broader understanding of SQ in physical retail outlets in other areas.
Disclosure statement
No potential conflict of interest was reported by the author(s).
Data availability statement
The authors confirm that the data supporting the findings of this study are available within the article and its supplementary materials.
Additional information
Funding
Notes on contributors
Taha Falatouri
Taha Falatouri is a PhD candidate at the Faculty of Management and Economics of Tomas Bata University in Zlin (Czech Republic) and research associate at the Department for Logistics at the University of Applied Sciences Upper Austria. His research interests include Data Analytics in Supply Chain Management, Machine Learning, Predictive Analytics and Operation Research.
Patrick Brandtner
Patrick Brandtner is a professor for Data-Driven Management at the Department for Logistics at the University of Applied Sciences Upper Austria. He is also Director of the Josef Ressel-Centre for Predictive Value Network Intelligence in Steyr. His research interests include Data Analytics in Supply Chain Management, Data-Driven Decision Making, Digitalization and Strategic Innovation Management.
Mehran Nasseri
Mehran Nasseri is a research associate at the Department for Logistics at the University of Applied Sciences Upper Austria. His research interests include Data Analytics in Supply Chain Management, Machine Learning, Predictive Analytics and Optimization.
Farzaneh Darbanian
Farzaneh Darbanian is a research associate at the Department for Logistics at the University of Applied Sciences Upper Austria. Her research interests include Data Analytics in Supply Chain Management, Data Visualization, Decision Support and Data Preparation.
References
- Ahmad, F. S., I. Ali, and R. Omar. 2014. “A Comparative Study on Service Quality in the Grocery Retailing: Evidence from Malaysia and Turkey.” Procedia – Social & Behavioral Sciences 109:763–767. https://doi.org/10.1016/j.sbspro.2013.12.541.
- Al-Deehani, M. T., and M. T. Aldeehani. 2017. “Perceptions and Predictions of Service Quality-Customer Satisfaction of Conventional and Islamic Banks in the GCC Region.” Journal of Research in Business, Economics and Management 9 (1): 1641–1656.
- Alzate, M., M. Arce-Urriza, and J. Cebollada. 2022. “Mining the Text of Online Consumer Reviews to Analyze Brand Image and Brand Positioning.” Journal of Retailing & Consumer Services 67:102989. https://doi.org/10.1016/j.jretconser.2022.102989.
- Amorim, M., and F. S. Bashashi. 2014. “An Investigation of Service Quality Assessments Across Retail Formats.” International Journal of Quality & Service Sciences 6 (2/3): 221–236. https://doi.org/10.1108/IJQSS-02-2014-0015.
- Anselmsson, J., and U. Johansson. 2014. “A Comparison of Customer Perceived Service Quality in Discount versus Traditional Grocery Stores: An Examination of Service Quality Measurement Scales in a Swedish Context.” International Journal of Quality & Service Sciences 6 (4): 369–386.
- Antony, J., M. Sony, O. McDermott, R. Jayaraman, and D. Flynn. 2023. “An exploration of organizational readiness factors for Quality 4.0: an intercontinental study and future research directions.” IJQRM 40 (2): 582–606. https://doi.org/10.1108/IJQRM-10-2021-0357.
- Arrondo, E., C. Berné, J. M. Múgica, and P. Rivera. 2002. “Modelling of Customer Retention in Multi-Format Retailing.” The International Review of Retail, Distribution & Consumer Research 12 (3): 281–296. https://doi.org/10.1080/09593960210139634.
- Bagnall, J., D. Bounie, K. P. Huynh, A. Kosse, T. Schmidt, S. Schuh, and H. Stix. 2014. “Consumer Cash Usage: A Cross-Country Comparison with Payment Diary Survey Data.” SSRN Journal. https://doi.org/10.2139/ssrn.2436365.
- Band, G., R. Timane, P. Wandhe, and V. Joshi. 2021. “A Discriminant Analysis of High End and Budget Stores in Apparel Retail in India Using Retail Service Quality Scale Model.” Turkish Journal of Computer & Mathematics Education 12 (4): 929–937.
- Basfirinci, C., and A. Mitra. 2015. “A Cross Cultural Investigation of Airlines Service Quality Through Integration of Servqual and the Kano Model.” Journal of Air Transport Management 42:239–248. https://doi.org/10.1016/j.jairtraman.2014.11.005.
- Bei, L.-T., and C.-F. Shang. 2006. “Building Marketing Strategies for State-Owned Enterprises Against Private Ones Based on the Perspectives of Customer Satisfaction and Service Quality.” Journal of Retailing & Consumer Services 13 (1): 1–13. https://doi.org/10.1016/j.jretconser.2004.07.002.
- Bonfrer, A., P. Chintagunta, and S. Dhar. 2022. “Retail Store Formats Competition and Shopper Behavior: A Systematic Review.” Journal of Retailing 98 (1): 71–91. https://doi.org/10.1016/j.jretai.2022.02.006.
- Borrego, Á., and M. Comalat Navarra. 2021. “What Users Say About Public Libraries: An Analysis of Google Maps Reviews.” Online Information Review 45 (1): 84–98.
- Boyd, A. 2002. “The Goals Questions Indicators Measures (GQIM) Approach to the Measurement of Customer Satisfaction with E‐Commerce Web Sites.” ASLIB Proceedings 54 (3): 177–187. https://doi.org/10.1108/00012530210441728.
- Brandtner, P. 2018. “Key Principles at the Strategic Front End of Innovation-A Systematic Literature Review.” ISPIM Innovation Symposium. The International Society for Professional Innovation Management (ISPIM), Stockholm, Sweden, 1–15.
- Brandtner, P., F. Darbanian, T. Falatouri, and C. Udokwu. 2021. “Impact of COVID-19 on the Customer End of Retail Supply Chains: A Big Data Analysis of Consumer Satisfaction.” Sustainability 13 (3): 1464. https://doi.org/10.3390/su13031464.
- Carraher, S., J. A. Parnell, and J. E. Spillan. 2009. “Customer Service‐Orientation of Small Retail Business Owners in Austria, the Czech Republic, Hungary, Latvia, Slovakia and Slovenia.” Baltic Journal of Management 4 (3): 251–268. https://doi.org/10.1108/17465260910990975.
- Chakraborty, G., P. Srivastava, and F. Marshall. 2007. “Are Drivers of Customer Satisfaction Different for Buyers/Users from Different Functional Areas?” Journal of Business & Industrial Marketing 22 (1): 20–28. https://doi.org/10.1108/08858620710722798.
- Chandra Mahapatra, S., and R. S. Bellamkonda. 2023. “Higher Expectations of Passengers Do Really Sense: Development and Validation a Multiple Scale-FliQual for Air Transport Service Quality.” Journal of Retailing & Consumer Services 70:103162. https://doi.org/10.1016/j.jretconser.2022.103162.
- Ciechanowski, W. 2021. “The Use of Self-Checkouts As an Organisational Innovation in Customer Service in the FMCG Sector.” Ekonomika i Organizacja Logistyki 6 (1): 5–13. https://doi.org/10.22630/EIOL.2021.6.1.1.
- Clarke, G., C. Thompson, and M. Birkin. 2015. “The Emerging Geography of E-Commerce in British Retailing.” Regional Studies, Regional Science 2 (1): 371–391. https://doi.org/10.1080/21681376.2015.1054420.
- Clarke, I., and S. Banga. 2010. “The Economic and Social Role of Small Stores: A Review of UK Evidence.” The International Review of Retail, Distribution & Consumer Research 20 (2): 187–215. https://doi.org/10.1080/09593961003701783.
- Cox, J., and B. G. Dale. 2001. “Service Quality and E‐Commerce: An Exploratory Analysis.” Managing Service Quality: An International Journal 11 (2): 121–131. https://doi.org/10.1108/09604520110387257.
- Cronin, J. J., Jr, and S. A. Taylor. 1992. “Measuring Service Quality: A Reexamination and Extension.” Journal of Marketing 56 (3): 55–68.
- Cronin, J. J., and S. A. Taylor. 1994. “Servperf versus Servqual: Reconciling Performance-Based and Perceptions-Minus-Expectations Measurement of Service Quality.” Journal of Marketing 58 (1): 125–131. https://doi.org/10.1177/002224299405800110.
- Dabholkar, P. A., D. I. Thorpe, and J. O. Rentz. 1996. “A Measure of Service Quality for Retail Stores: Scale Development and Validation.” Journal of the Academy of Marketing Science 24 (1): 3–16. https://doi.org/10.1007/BF02893933.
- Daher, A. 2021. Old Habits Die Hard. Insights into the Reasons Why People Don’t Switch to Online Retail Grocery Shopping Despite COVID-19 in Austria and Peru in 2020. Author: Amal Daher, Andrea Zevallos. Universität Linz.
- Darbanian, F., P. Brandtner, T. Falatouri, and M. Nasseri. 2024. “Data Analytics in Supply Chain Management: A State-Of-The-Art Literature Review.” Operations and Supply Chain Management: An International Journal 17 (1): 1–31. https://doi.org/10.31387/oscm0560411.
- Das, A., V. Kumar, and G. C. Saha. 2010. “Retail Service Quality in Context of CIS Countries.” IJQRM 27 (6): 658–683. https://doi.org/10.1108/02656711011054542.
- Dhaoui, C., C. M. Webster, and L. P. Tan. 2017. “Social Media Sentiment Analysis: Lexicon versus Machine Learning.” Journal of Consumer Marketing 34 (6): 480–488. https://doi.org/10.1108/JCM-03-2017-2141.
- Dholakia, U. M., S. S. Singh, and R. A. Westbrook. 2010. “Understanding the Effects of Post-Service Experience Surveys on Delay and Acceleration of Customer Purchasing Behavior: Evidence from the Automotive Services Industry.” Journal of Service Research 13 (4): 362–378.
- Ding, C., and Z. Li. 2022. “City Size and Household Consumption in China.” The Land 11 (11): 2027. https://doi.org/10.3390/land11112027.
- Dominici, A., F. Boncinelli, F. Gerini, and E. Marone. 2021. “Determinants of Online Food Purchasing: The Impact of Socio-Demographic and Situational Factors.” Journal of Retailing & Consumer Services 60:102473. https://doi.org/10.1016/j.jretconser.2021.102473.
- Donthu, N., D. D. Gremler, S. Kumar, and D. Pattnaik. 2022. “Mapping of Journal of Service Research Themes: A 22-Year Review.” Journal of Service Research 25 (2): 187–193. https://doi.org/10.1177/1094670520977672.
- Foscht, T., C. Maloles, J. Schloffer, B. Swoboda, and S.-L. Chia. 2008. “Exploring the Impact of Customer Satisfaction on Food Retailers’ Evolution: Managerial Lessons from Austria.” Journal of International Food & Agribusiness Marketing 21 (1): 67–82. https://doi.org/10.1080/08974430802480669.
- Furrer, O., B. S. C. Liu, and D. Sudharshan. 2000. “The Relationships Between Culture and Service Quality Perceptions: Basis for Cross-Cultural Market Segmentation and Resource Allocation.” Journal of Service Research 2 (4): 355–371. https://doi.org/10.1177/10946705002400.
- Goić, M., C. Levenier, and R. Montoya. 2021. “Drivers of Customer Satisfaction in the Grocery Retail Industry: A Longitudinal Analysis Across Store Formats.” Journal of Retailing & Consumer Services 60:102505. https://doi.org/10.1016/j.jretconser.2021.102505.
- Hackl, P., D. Scharitzer, and R. Zuba. 2000. “Customer Satisfaction in the Austrian Food Retail Market.” Total Quality Management 11 (7): 999–1006. https://doi.org/10.1080/09544120050135524.
- Haming, M., S. A. Zulfikar, A. H. P. K. Putra, and I. Murdifin. 2019. “The Application of SERVQUAL Distribution in Measuring Customer Satisfaction of Retails Company.” Journal of Distribution Science 17 (2): 25–31. https://doi.org/10.15722/jds.17.2.201902.25.
- Hassani, H., C. Beneki, S. Unger, M. T. Mazinani, and M. R. Yeganegi. 2020. “Text Mining in Big Data Analytics.” BDCC 4 (1): 1. https://doi.org/10.3390/bdcc4010001.
- Hoffmann, N. A., and P. Schnedlitz. 2009. “The Austrian Retail Market: A Profile.” In European Retail Research, edited by B. Swoboda, D. Morschett, T. Rudolph, P. Schnedlitz, and H. Schramm-Klein, 207–227. Wiesbaden: Gabler Verlag.
- Hofstede, G. 2011. “Dimensionalizing Cultures: The Hofstede Model in Context.” Online Readings in Psychology & Culture 2 (1). https://doi.org/10.9707/2307-0919.1014.
- Hofstede, G. 2015. “The 6-D Model of National Culture.” Available online at https://geerthofstede.com/culture-geert-hofstede-gert-jan-hofstede/6d-model-of-national-culture/. Last checked on 7th of May 2024.
- Höpperger, D., and C. Rusu. 2022. “Payment Behavior in Austria During the COVID-19 Pandemic.” Monetary Policy and the Economy (Q4/21): 85–105.
- Hornik, K., and B. Grün. 2011. “Topicmodels: An R Package for Fitting Topic Models.” Journal of Statistical Software 40 (13): 1–30.
- Huddleston, P., J. Whipple, R. M. Nye, and S. J. Lee. 2009. “Customer Satisfaction in Food Retailing: Comparing Specialty and Conventional Grocery Stores.” IJRDM 37 (1): 63–80. https://doi.org/10.1108/09590550910927162.
- Ieva, M., and C. Ziliani. 2018. “Mapping Touchpoint Exposure in Retailing.” IJRDM 46 (3): 304–322. https://doi.org/10.1108/IJRDM-04-2017-0097.
- Jain, P., and V. S. Aggarwal. 2018. “Developing a Service Quality Scale in Context of Organized Grocery Retail of India.” MD 56 (9): 1969–1990. https://doi.org/10.1108/MD-08-2017-0790.
- Kadyan, J. S., and L. Jenefa. 2019. “The Empirical Study on Customer Satisfaction Towards Service Quality of Hypermarket.” South Asia 5 (4): 44–49
- Kevrekidis, D. P., D. Minarikova, A. Markos, I. Malovecka, and P. Minarik. 2018. “Community Pharmacy Customer Segmentation Based on Factors Influencing Their Selection of Pharmacy and Over-The-Counter Medicines.” Saudi Pharmaceutical Journal 26 (1): 33–43.
- Korfiatis, N., P. Stamolampros, P. Kourouthanassis, and V. Sagiadinos. 2019. “Measuring Service Quality from Unstructured Data: A Topic Modeling Application on Airline Passengers’ Online Reviews.” Expert Systems with Applications 116:472–486. https://doi.org/10.1016/j.eswa.2018.09.037.
- Lang, C., M. Li, and L. Zhao. 2020. “Understanding Consumers’ Online Fashion Renting Experiences: A Text-Mining Approach.” Sustainable Production and Consumption 21:132–144. https://doi.org/10.1016/j.spc.2019.12.003.
- Lazaris, C., A. Vrechopoulos, P. Sarantopoulos, and G. Doukidis. 2022. “Additive Omnichannel Atmospheric Cues: The Mediating Effects of Cognitive and Affective Responses on Purchase Intention.” Journal of Retailing & Consumer Services 64:102731. https://doi.org/10.1016/j.jretconser.2021.102731.
- Lee, K., and C. Yu. 2018. “Assessment of Airport Service Quality: A Complementary Approach to Measure Perceived Service Quality Based on Google Reviews.” Journal of Air Transport Management 71:28–44. https://doi.org/10.1016/j.jairtraman.2018.05.004.
- Léo, P.-Y., and J. Philippe. 2002. “Retail Centres: Location and Consumer’s Satisfaction.” The Service Industries Journal 22 (1): 122–146. https://doi.org/10.1080/714005055.
- Li, X., M. Xu, W. Zeng, Y. K. Tse, and H. K. Chan. 2023. “Exploring Customer Concerns on Service Quality Under the COVID-19 Crisis: A Social Media Analytics Study from the Retail Industry.” Journal of Retailing & Consumer Services 70:103157. https://doi.org/10.1016/j.jretconser.2022.103157.
- Lin, H.-F. 2007. “The Impact of Website Quality Dimensions on Customer Satisfaction in the B2C E-Commerce Context.” Total Quality Management & Business Excellence 18 (4): 363–378. https://doi.org/10.1080/14783360701231302.
- Liu, X., X. Zeng, Y. Xu, and L. Koehl. 2008. “A Fuzzy Model of Customer Satisfaction Index in E-Commerce.” Mathematics and Computers in Simulation 77 (5–6): 512–521. https://doi.org/10.1016/j.matcom.2007.11.017.
- Mägi, A., and C.-R. Julander. 1996. “Perceived Service Quality and Customer Satisfaction in a Store Performance Framework.” Journal of Retailing & Consumer Services 3 (1): 33–41. https://doi.org/10.1016/0969-6989(95)00040-2.
- Martinelli, E., and B. Balboni. 2012. “Retail Service Quality As a Key Activator of Grocery Store Loyalty.” The Service Industries Journal 32 (14): 2233–2247. https://doi.org/10.1080/02642069.2011.582499.
- Meesala, A., and J. Paul. 2018. “Service Quality, Consumer Satisfaction, and Loyalty in Hospitals: Thinking for the Future.” Journal of Retailing & Consumer Services 40:261–269. https://doi.org/10.1016/j.jretconser.2016.10.011.
- Minkov, M., and G. Hofstede. 2014. “Clustering of 316 European Regions on Measures of Values.” Cross-Cultural Research 48 (2): 144–176. https://doi.org/10.1177/1069397113510866.
- Moro, S., R. J. Lopes, J. Esmerado, and M. Botelho. 2020. “Service Quality in Airport Hotel Chains Through the Lens of Online Reviewers.” Journal of Retailing & Consumer Services 56:102193. https://doi.org/10.1016/j.jretconser.2020.102193.
- Mzoughi, M. N., and K. F. Garrouch. 2022. “Reactions to Store Environment and Interpersonal Service Quality in Supermarkets Vs Hypermarkets.” Journal of Distribution Science 20 (1): 67–76.
- Naik, C. K., S. B. Gantasala, and G. V. P. Prabhakar. 2010. “Service Quality (SERVQUAL) and Its Effect on Customer Satisfaction in Retailing.” European Journal of Social Sciences 16 (2): 231–243.
- Nasseri, M., P. Z. Brandtner, R. Falatouri, T. Darbanian F, and T. Obinwanne. 2023. “Applications of Large Language Models (LLMs) in Business Analytics–Exemplary Use Cases in Data Preparation Tasks.” In International Conference on Human-Computer Interaction, 182–198. Cham. Springer Nature Switzerland. https://doi.org/10.1007/978-3-031-48057-7_12.
- Nedbal, D., P. Brandtner, A. Auinger, and M. A. Erskine. 2013. “The Critical Mass in Collaborative Digital Business Ecosystems for Innovation: A Case Exploration of Readiness and Willingness.” In 2013 7th IEEE International Conference on Digital Ecosystems and Technologies (DEST), 96–101. Menlo Park, CA, USA. IEEE. https://doi.org/10.1109/DEST.2013.6611328.
- Nikolova, V., R. Dyankova, and H. Petkova. 2017. “Factors of Customer Loyalty in Pharmacy Retail: A Case from Bulgaria.” Scripta Scientifica Vox Studentium 1 (1): 28–31.
- Nilashi, M., R. A. Abumalloh, B. Minaei-Bidgoli, W. A. Abdu Zogaan, A. Alhargan, S. Mohd Saidatulakmal, and others. 2022. “Revealing Travellers’ Satisfaction During COVID-19 Outbreak: Moderating Role of Service Quality.” Journal of Retailing & Consumer Services 64:102783. https://doi.org/10.1016/j.jretconser.2021.102783.
- Ogiemwonyi, O., A. Harun, A. Rahman, M. N. Alam, and N. M. Hamawandy. 2020. “The Relationship Between Service Quality Dimensions and Customer Satisfaction Towards Hypermarket in Malaysia.” International Journal of Psychosocial Rehabilitation 24 (5): 2062–2071. https://doi.org/10.37200/IJPR/V24I5/PR201904.
- Omar, S., K. Mohsen, G. Tsimonis, A. Oozeerally, and J.-H. Hsu. 2021. “M-Commerce: The Nexus Between Mobile Shopping Service Quality and Loyalty.” Journal of Retailing & Consumer Services 60:102468. https://doi.org/10.1016/j.jretconser.2021.102468.
- Palese, B., and A. Usai. 2018. “The Relative Importance of Service Quality Dimensions in E-Commerce Experiences.” International Journal of Information Management 40:132–140. https://doi.org/10.1016/j.ijinfomgt.2018.02.001.
- Parasuraman, A., V. A. Zeithaml, and L. Berry. 1988. “SERVQUAL: A Multiple-Item Scale for Measuring Consumer Perceptions of Service Quality.” Journal of Retailing 64 (1): 12–40.
- Parasuraman, A., V. A. Zeithaml, and L. L. Berry. 1985. “A Conceptual Model of Service Quality and Its Implications for Future Research.” Journal of Marketing 49 (4): 41–50. https://doi.org/10.1177/002224298504900403.
- Parasuraman, A., V. A. Zeithaml, and A. Malhotra. 2005. “ES-QUAL: A Multiple-Item Scale for Assessing Electronic Service Quality.” Journal of Service Research 7 (3): 213–233.
- Park, J., and R. B. Kim. 2022. “Importance of Offline Service Quality in Building Loyalty of OC Service Brand.” Journal of Retailing & Consumer Services 65:102493. https://doi.org/10.1016/j.jretconser.2021.102493.
- Park, J., D. Yang, and H. Y. Kim. 2023. “Text Mining-Based Four-Step Framework for Smart Speaker Product Improvement and Sales Planning.” Journal of Retailing & Consumer Services 71:103186. https://doi.org/10.1016/j.jretconser.2022.103186.
- Patten, E., W. Ozuem, K. Howell, and G. Lancaster. 2020. “Minding the Competition: The Drivers for Multichannel Service Quality in Fashion Retailing.” Journal of Retailing & Consumer Services 53:101974. https://doi.org/10.1016/j.jretconser.2019.101974.
- Radojevic, T., N. Stanisic, and N. Stanic. 2017. “Inside the Rating Scores: A Multilevel Analysis of the Factors Influencing Customer Satisfaction in the Hotel Industry.” Cornell Hospitality Quarterly 58 (2): 134–164.
- Sagiv, L., and S. H. Schwartz. 2022. “Personal Values Across Cultures.” Annual Review of Psychology 73:517–546. https://doi.org/10.1146/annurev-psych-020821-125100.
- Salihovic, A. 2023. “Food Retail - Sales Remain on a Successful Course.” Available online at Accessed May 5, 2023. https://www.regiodata.eu/en/austria-food-retail-sales-remain-on-a-successful-course/. checked on 8/23/2023.
- Salminen, J., C. Kandpal, A. M. Kamel, S.-G. Jung, and B. J. Jansen. 2022. “Creating and Detecting Fake Reviews of Online Products.” Journal of Retailing & Consumer Services 64:102771. https://doi.org/10.1016/j.jretconser.2021.102771.
- Schroth, M., M. Vyborny, and L. Ziskovsky. 2022. “Should the Use of Cash Be Limited?” Monetary Policy & the Economy (Q1–Q2/22): 109–119.
- Shahbazi, Z., and Y.-C. Byun. 2020. “Analysis of Domain-Independent Unsupervised Text Segmentation Using LDA Topic Modeling Over Social Media Contents.” International Journal of Advanced Science and Technology 29 (6): 5993–6014.
- Shokouhyar, S., S. Shokoohyar, and S. Safari. 2020. “Research on the Influence of After-Sales Service Quality Factors on Customer Satisfaction.” Journal of Retailing & Consumer Services 56:102139. https://doi.org/10.1016/j.jretconser.2020.102139.
- Siu, N. Y. M., and J. T.-H. Cheung. 2001. “A Measure of Retail Service Quality.” Marketing Intelligence & Planning 19 (2): 88–96. https://doi.org/10.1108/02634500110385327.
- Siu, N. Y. M., and D. K. H. Chow. 2004. “Service Quality in Grocery Retailing.” Journal of International Consumer Marketing 16 (1): 71–87. https://doi.org/10.1300/J046v16n01_05.
- Slack, N., G. Singh, and S. Sharma. 2020. “The Effect of Supermarket Service Quality Dimensions and Customer Satisfaction on Customer Loyalty and Disloyalty Dimensions.” International Journal of Quality & Service Sciences 12 (3): 297–318. https://doi.org/10.1108/IJQSS-10-2019-0114.
- Solgaard, H. S., and T. Hansen. 2003. “A Hierarchical Bayes Model of Choice Between Supermarket Formats.” Journal of Retailing & Consumer Services 10 (3): 169–180. https://doi.org/10.1016/S0969-6989(03)00008-0.
- Špička, J. 2016. “Market Concentration and Profitability of the Grocery Retailers in Central Europe.” Central European Business Review 5 (3): 5–24.
- Sriramesh, K., S. Moghan, and D. L. W. K. Lim. 2007. “The Situational Theory of Publics in a Different Cultural Setting: Consumer Publics in Singapore.” Journal of Public Relations Research 19 (4): 307–332. https://doi.org/10.1080/10627260701402424.
- Staab, M., R. Zimmermann, P. Brandtner, O. Schauer, and others. 2023. “Consumer Behavior in Staffless Stores: A Systematic Literature Review.” In HCI International 2023– Late Breaking Papers. HCII 2023. Lecture Notes in Computer Science, edited by P. Zaphiris, 380–392. Vol. 14060. Cham: Springer. https://doi.org/10.1007/978-3-031-48060-7_40.
- Stieninger, M., J. Gasperlmair, M. Plasch, and M. Kellermayr-Scheucher. 2021. “Identification of Innovative Technologies for Store-Based Retailing–An Evaluation of the Status Quo and of Future Retail Practices.” Procedia Computer Science 181:84–92. https://doi.org/10.1016/j.procs.2021.01.108.
- Sutherland, I., Y. Sim, S. K. Lee, J. Byun, and K. Kiatkawsin. 2020. “Topic Modeling of Online Accommodation Reviews via Latent Dirichlet Allocation.” Sustainability 12 (5): 1821.
- Tešić, D. 2020. “Measuring Dimensions of Service Quality.” Strategic Management-International Journal of Strategic Management and Decision Support Systems in Strategic Management 25 (1): 12–20. https://doi.org/10.5937/StraMan2001012T.
- Tong, Z., and H. Zhang. 2016. “A Text Mining Research Based on LDA Topic Modelling.” In The 6th International Conference on Computer Science, Engineering and Information Technology, Vienna, Austria, 201–210. Academy & Industry Research Collaboration Center (AIRCC).
- Udokwu, C., F. Darbanian, T. N. Falatouri, and P. Brandtner. 2020. “Evaluating Technique for Capturing Customer Satisfaction Data in Retail Supply Chain.” In 2020 The 4th International Conference on E-Commerce, E-Business and E-Government, 89–95. Arenthon, France. ACM. https://doi.org/10.1145/3409929.3409941.
- Uthirapathy, S. E., and D. Sandanam. 2023. “Topic Modelling and Opinion Analysis on Climate Change Twitter Data Using LDA and BERT Model.” Procedia Computer Science 218:908–917. https://doi.org/10.1016/j.procs.2023.01.071.
- Uzir, M. U. H., H. Al Halbusi, R. Thurasamy, R. T. H. Lim, M. A. Aljaberi, N. Hasan, and M. Hamid. 2021. “The Effects of Service Quality, Perceived Value, and Trust in Home Delivery Service Personnel on Customer Satisfaction: Evidence from a Developing Country.” Journal of Retailing & Consumer Services 63:102721. https://doi.org/10.1016/j.jretconser.2021.102721.
- Vázquez, R., I. A. Rodrı́guez-Del Bosque, A. Ma Dı́az, and A. V. Ruiz. 2001. “Service Quality in Supermarket Retailing: Identifying Critical Service Experiences.” Journal of Retailing & Consumer Services 8 (1): 1–14. https://doi.org/10.1016/S0969-6989(99)00018-1.
- Vianelli, D., C. Dianoux, T. Domanski, and J. L. Herrmann. 2007. “In-Store Shopping Behavior.” Journal of East-West Business 13 (2–3): 115–142. https://doi.org/10.1300/J097v13n02_02.
- Wongpakaran, N., T. Wongpakaran, D. Wedding, and K. L. Gwet. 2013. “A Comparison of Cohen’s Kappa and Gwet’s AC1 When Calculating Inter-Rater Reliability Coefficients: A Study Conducted with Personality Disorder Samples.” BMC Medical Research Methodology 13 (1): 1–7.
- Yao, K., G. A. Oliva, A. E. Hassan, M. Asaduzzaman, A. J. Malton, and A. Walenstein. 2023. “Finding Associations Between Natural and Computer Languages: A Case-Study of Bilingual LDA Applied to the Bleeping Computer Forum Posts.” The Journal of Systems & Software 201:111651. https://doi.org/10.1016/j.jss.2023.111651.
- Yokoyama, N., N. Azuma, and W. Kim. 2022. “Moderating Effect of Customer’s Retail Format Perception on Customer Satisfaction Formation: An Empirical Study of Mini-Supermarkets in an Urban Retail Market Setting.” Journal of Retailing & Consumer Services 66:102935. https://doi.org/10.1016/j.jretconser.2022.102935.
- Yu, D., and B. Xiang. 2023. “Discovering Topics and Trends in the Field of Artificial Intelligence: Using LDA Topic Modeling.” Expert Systems with Applications 225:120114. https://doi.org/10.1016/j.eswa.2023.120114.
- Yusuf, M., Nurhilalia N., and A. H. P. K. Putra. 2019. “The Impact of Product Quality, Price, and Distribution on Satisfaction and Loyalty.” Journal of Distribution Science 17 (10): 17–26. https://doi.org/10.15722/jds.17.10.201910.17.
- Zhang, J., S. E. Beatty, and G. Walsh. 2008. “Review and Future Directions of Cross-Cultural Consumer Services Research.” Journal of Business Research 61 (3): 211–224. https://doi.org/10.1016/j.jbusres.2007.06.003.
- Zhang, W, H Xu, and W Wan. 2012. “Weakness Finder: Find product weakness from Chinese reviews by using aspects based sentiment analysis.” Expert Systems with Applications 39 (11): 10283–10291. https://doi.org/10.1016/j.eswa.2012.02.166
- Zhou, Q., F. J. Lim, H. Yu, G. Xu, X. Ren, D. Liu, and others. 2021. “A Study on Factors Affecting Service Quality and Loyalty Intention in Mobile Banking.“Journal of Retailing and Consumer Services 60 (5): 102424. https://doi.org/10.1016/j.jretconser.2020.102424.