
ABSTRACT
Background
Physiotherapists (PTs) have an essential role in the facilitation of patients’ mobilization after lumbar spinal fusion (LSF). The aim of this study is to investigate whether PTs can predict one-year post-surgery outcome based on their first meeting with the patient immediately after LSF.
Method
A prospective cohort study with one-year follow-up was conducted. In the first days after surgery, the PTs from hospital wards were asked to predict the patients’ overall LSF outcome one year after surgery. One year after surgery, the patients received a questionnaire including the Oswestry Disability Index (ODI), visual analogue scales (VAS) for leg and back pain, quality of life survey (EQ-5D-3 L), global perceived effect (GPA), and satisfaction with surgery outcome (SSO). Univariate and logistic regression were used to calculate the associations between the prognosis and predictive values.
Results
The study included 170 patients. The analyses showed a significant association between the PTs’ prognosis and the primary outcome ODI (p < .01), VAS leg and back, EQ-5D-3 L, and GPE one-year post-surgery (p ≤ .04). However, the predictive value of the PTs’ prognosis was low (R2 ≤ 0.09). There was no significant association between the PTs’ prognosis and the patients’ SSO (p = .17; R2 = 0.01).
Conclusion
There were significant associations between the PTs’ prognosis and disability, pain, health-related quality of life and global perceived effect one-year post-surgery, although the associations had low predictive values. There was no significant association between the PTs’ prognosis and patients’ SSO after one year. The PTs’ prognosis should not be used as a single component in further rehabilitation planning.
Background
Lumbar spinal fusion (LSF) is a frequently used surgical procedure for the treatment of degenerative lumbar disease in patients with low back pain (LBP) (Koenders et al., Citation2018). Patients offered LSF often have a long history of failed treatments, progressive pain and disability, and many have developed negative pain beliefs and kinesiophobia (Alaca, Kaba, and Atalay, Citation2020). To support LSF patients to be physically active as soon as possible after surgery, PTs combine information from the anamnesis regarding body function and structures, activities and participation, personal and environmental factors (Hartvigsen et al., Citation2018; ICF Research Branch, Citation2017). Furthermore, PTs are expected to combine these informations, with their clinical experience and personal interaction with the patient.
Prediction of lumbar spinal surgery outcomes has been investigated in several studies and systematic reviews (Abbott, Tyni-Lenne, and Hedlund, Citation2011; Alodaibi, Minick, and Fritz, Citation2013; Celestin, Edwards, and Jamison, Citation2009; den Boer et al., Citation2006; Hinrichs-Rocker et al., Citation2009; Mannion and Elfering, Citation2006; McIlroy, Jadhakhan, Bell, and Rushton, Citation2021; Rushton et al., Citation2014; Rushton, Zoulas, Powell, and Bart Staal, Citation2018; Wilhelm et al., Citation2017). Despite a substantial amount of investigative work, there is no consensus regarding specific predictive clinical parameters for the outcomes of back surgery.
It is possible that PTs can contribute with different views on the prediction of surgery outcomes based on their clinical experience and bio-psycho-social approach. In their assessments of patients, the PTs include specific bio-psycho-social factors that are only obvious in the clinical meeting with the patients. If found of predictive value, such factors would be relevant to use in early planning of rehabilitation to optimize surgery outcomes.
Four cohort studies have investigated PTs’ ability to predict outcomes of conservatively treated patients with LBP (Cook et al., Citation2015; Dagfinrud et al., Citation2013; Hancock et al., Citation2009; Haxby Abbott and Kingan, Citation2014). Hancock et al. (Citation2009) examined PTs’ ability to predict pain and recovery in 239 patients with acute LBP. The PTs in that study were able to predict number of days to recovery, but had no greater success than the comparator, a clinical prediction rule including baseline pain, duration of current episode and number of previous episodes. Haxby Abbot and Kingan (Citation2014) performed a prospective cohort study on 138 patients with chronic low back pain (CLBP) and found a significant association between PTs’ estimations of prognosis of a good outcome on a 4-point Likert scale and a modified Roland-Morris Disability Questionnaire in patients after one year. In a prospective cohort study by Dagfinrud et al. (Citation2013) the predictive ability of PTs’ prognostic assessment regarding functional improvement was investigated on 157 patients with acute, subacute, and chronic neck and back pain. PTs’ prognoses were associated with the outcome on Oswestry Disability Index (ODI) after eight weeks for patients with LBP, but associations were weak. Finally, a prospective cohort study by Cook et al. (Citation2015) found that experienced PTs could predict disability and recovery outcome in 112 patients with neck and back pain after a course of physiotherapy treatment. These studies illustrate that there may be an association between PTs’ prognoses and patient-reported outcome measures (PROMs) in relation to recovery and disability in patients with acute and chronic LBP. Two other cohort studies investigated the predictive value of PTs prognosis, but included other patient groups (Harvey et al., Citation2013; Henriksen, Mukriyani, and Juhl, Citation2021). Henriksen, Mukriyani, and Juhl (Citation2021) investigated the predictive value of PTs’ prognosis in patients undergoing a knee replacement. They found a low predictive value between the PTs’ prognosis measured using PROMs, including function, pain, and quality of life at 6 and 12-months post-surgery, and a poor to acceptable discriminative value between the PTs’ prognosis and the treatment-response criterion “patient acceptable symptom state.” Harvey et al. (Citation2013) investigated the accuracy of PTs’ prognosis of mobility for people with spinal cord injury one year after the injury. They found that PTs were reasonably accurate in predicting patients’ future mobility, measured by five different functional and mobility scales used for patients with spinal cord injury.
To the best of our knowledge, no investigation has been made as to whether PTs can predict outcomes for more severely disabled patients with CLBP undergoing a surgical procedure. The PT’s combined information, experiences, and interaction with the patients may include individual challenges and resources (i.e. personal, material, and social) in the patient. This knowledge may be valuable to include in the approach to the patients, in the communication with the patients, and in the early planning of post-surgical rehabilitation. Including a broader perspective on factors predictive of surgery outcomes may lead to a more relevant and applicable rehabilitation of the individual patient. Furthermore, it may create an opportunity to use resources in the post-surgery rehabilitation period more wisely in consideration of timing, content and length of rehabilitation of each patient. However, the first step is to consider whether PTs can predict surgery outcome. The objective of this study was to investigate if PTs on a surgical hospital ward can predict one-year post-surgery outcome after LSF, based on their first meeting with the patient during the first 1–2 days after surgery. The hypothesis was that the PTs’ prognosis would be associated with disability one-year post surgery. A second hypothesis was that the PTs prognosis would be associated with pain intensity, health-related quality of life (HRQoL), global perceived effect, and achieved satisfaction with surgery outcome (SSO) one year after LSF.
Methods
A pragmatic, prospective cohort study with one-year follow-up was conducted to examine the predictive value of PTs’ prognosis of patients’ self-reported disability, pain, HRQoL, global perceived effect, and satisfaction with surgery. The STROBE Statement checklist for cohort studies was used as a reporting framework (von Elm et al., Citation2014). The study was approved by the Citation2018, and the Health Research Ethics Committee for the Capital Region of Denmark (H-18030551). The study is also registered at www.clinicaltrials.gov (NCT03673436).
Study Population
Patients
All patients undergoing LSF surgery at Rigshospitalet – Glostrup and Silkeborg Regional Hospital in Denmark from 1 September 2018 to 31 September 2019 were invited to participate. Eligibility criteria were: Planned LSF surgery for treatment of degenerative lumbar disease with or without lumbar spondylolisthesis grades 1 or 2 (Ravindra et al., Citation2018), fusion of a maximum of three adjacent vertebrae, ≥ 18 years of age, competence in the Danish language and contactable by e-mail. We excluded patients who had cognitive impairments that precluded reliable answers to the PROMs and those who had undergone a previous fusion surgery.
Physiotherapists
Department PTs who treated patients after LSF at Rigshospitalet – Glostrup and Silkeborg Regional Hospital were asked to complete a prognosis sheet (Appendix A). The PTs were instructed to include all components of their first meeting with the patient (i.e. information from journals, anamnesis, and interaction with the patient) in their prediction of the prognosis. The PTs formed a broad group, in terms of age, sex, and experience of post-surgical mobilization.
Procedure and data collection
All patients scheduled for an LSF are invited to a back seminar 1–2 weeks pre-surgery. Eligible patients at this seminar were informed about the study by the investigators MG, HT or the PT presenting at the seminar. If the patients gave their consent to participate and fulfilled the inclusion criteria, they completed a paper questionnaire with baseline information. Baseline information included questionnaires regarding disability, pain intensity and HRQoL and questions regarding sociodemographic factors.
Usual practice for the PTs’ is to attend to the patient 1–2 days post-surgery. The PTs aid the patient in becoming mobile, i.e. getting in and out of bed or walking up and down stairs. PTs also have a conversation with the patient about problems experienced in terms of physical activity or movement, in the patient’s return to daily activities. PTs have no contact with the patients’ post-surgery but summarize the patients’ state at discharge and send a request for an active rehabilitation-plan to physiotherapists in local community care centers starting three-month post-surgery. Active rehabilitation offered three-month post-surgery varied in amount and intensity depending on physiotherapists approach in each local center.
Following the first post-operative physiotherapy session, the physiotherapist completed the prognosis sheet (Appendix A), besides the usual procedures described above. After completion, the PTs delivered the sheet to one of the two investigators, MG or HT.
MG and HT were responsible for handling the pre- and post-surgery data. MG and HT entered the data that had been collected on the prognosis sheets into an online data capture application, Research Electronic Data Capture (REDCap) and destroyed all paper material (Harris et al., Citation2019, Citation2009). REDCap is hosted at the Capital Region of Denmark, which provides a secure, web-based software platform designed to support data capture for research studies (Harris et al., Citation2019, Citation2009).
One year after surgery, the patients were emailed a link to the same questionnaire identical to the pre-surgery questionnaire. It also included questions about satisfaction with surgery and global wellbeing (see Outcome Measures – Dependent Variables).
Outcome measures
Predictive variable
The predictive variable is the PT’s estimate of each patient’s overall outcome of the surgery after one year, assessed 1–2 days after surgery. The PTs scored each patient immediately after the first meeting and were instructed to score each participant on a continuum of 0 suggesting a very poor projected prognosis to 10 suggesting an excellent projected prognosis (Appendix A). After scoring the prognosis, PTs were also required to summarize the basis of their judgment in free text.
Dependent variables
The main dependent variable was Disability, assessed by the Oswestry Disability Index (ODI), which is a validated measure of pain-related disability originally developed for patients with LBP (Fairbank and Pynsent, Citation2000). The ODI has been translated into Danish and shows acceptable responsiveness, reliability, and validity (Lauridsen et al., Citation2006a, Citation2006b). The questionnaire is self-administered and includes 10 questions, one for each of the domains of function (i.e. pain intensity, personal care, lifting, walking, sitting, standing, sleeping, sex life, social life, and traveling). The score is registered as 0, representing no difficulty in the activity to 5, representing maximal difficulty, and the data are converted to a sum score of 0–100 (best-worst) (Fairbank and Pynsent, Citation2000). The following secondary variables were also collected.
Leg and back pain
Leg and back pain were measured by two visual analogue scales (VAS). VAS is a simple and frequently used method in the assessment of pain. Patients were asked to mark the position along a horizontal 10-cm line that best corresponded to their pain intensity. The ends of the line had verbal descriptions: 0 (“no pain”) – 100 (“the worst pain imaginable”) (Carlsson, Citation1983; Shafshak and Elnemr, Citation2021).
HRQoL
HRQoL was measured by the self-reported health outcome and quality of life survey (EQ-5D-3 L) (Brooks, Citation1996), which consists of the EQ-5D descriptive system (EQ-5D-index) and the EQ-5D Visual Analogue Scale (EQ-5D-VAS). The EQ-5D-index comprises five dimensions (mobility, self-care, usual activities, pain/discomfort, and anxiety/depression). Standardized answer options are given (three Likert boxes) and each question is assigned a score from 1 to 3. From the answers, an EQ-5D-3 L index score is calculated based on Danish normative equations. The index ranges from −0.624 (worst) to 1.000 (best) and is based on a “trade-off value technique” (Sørensen et al., Citation2009; Wittrup-Jensen, Lauridsen, Gudex, and Pedersen, Citation2009). The EQ-5D-VAS records the patient’s self-rated health on a 20-cm vertical VAS. The patients are asked to mark how they would rate their health today on the scale, which is labeled with endpoints ‘the best health you can imagine’ (score of 100) and ‘the worst health you can imagine’ (score of 0) (Rabin and de Charro, Citation2001). A validated Danish version of the EQ-5D-3 L was used (Sørensen et al., Citation2009; Wittrup-Jensen, Lauridsen, Gudex, and Pedersen, Citation2009).
Global perceived effect (GPE)
GPE is a retrospective measure (Bobos et al., Citation2020) that asks patients to compare their current global wellbeing with their pre-surgery condition. The patients initially answered whether their current state was “unchanged,” “worse” or “better” compared to pre-surgery. A response of “unchanged” equates to a transition score of 0. If the participant answers “worse,” he/she is asked to rate the degree of worsening on a 7-point Likert scale, and the corresponding scores range from −1 to −7. Correspondingly, if a participant answers “better,” he/she is asked to rate the degree of improvement on a 7-point Likert scale, and the corresponding scores range from 1 to 7. Thus, the GPE score ranges from −7 (worsening) to 7 (improvement), with the mid-point, 0, representing no change.
Patient’s overall satisfaction
The patient’s overall satisfaction with the surgery outcome (SSO) was collected at the one-year follow-up. Patients were asked the following question: “What is your general opinion of the outcome of your surgery?” The patients selected one of three answers: 1) “I am satisfied”; 2) “I am not sure about it”; or 3) “I am not satisfied.” Response to SSO was a priori dichotomized to satisfied (“I am satisfied”) and not satisfied (“I am not sure,” and “I am not satisfied”). The SSO is used routinely in the DaneSpine to capture satisfaction with surgery (Danish Society of Spinal Surgery, Citation2018).
Statistical analysis
Descriptive statistics
Characteristics of the patients’ baseline results and the dependent variables at one-year follow-up were calculated by means and standard deviations (SDs) for continuous variables, and frequencies and percentages for categorical variables. Changes from baseline to one-year follow-up for each of the dependent variables disability, pain, HRQoL and GPE was analyzed using a paired t-test. Only patients who returned data at the one-year follow-up were included in the analysis, i.e. missing data were not imputed.
Prediction analysis
Analysis continuous variables
Associations between the PTs’ prognostic scores and the continuous variables ODI, VAS, EQ-5D-3 L and GPE were assessed by univariate linear regression analyses with the PTs’ prognostic scores as the independent variable and ODI, VAS, EQ-5D-3 L, and GPE as dependent variables. Association calculations were assessed via the estimated slopes (beta) and explained variance (R2). P-values of < 0.05 were considered statistically significant. The standardized residuals from the regression model were checked for normality and heteroscedasticity.
Analysis of satisfaction with surgery outcome (SSO)
The associations between the PTs’ prognostic scores and the dichotomized SSO variable were assessed using logistic regression analysis with the PTs’ prognostic scores as independent variable and SSO as the dependent variable. Results were evaluated by odds ratio (OR) and 95% confidence interval (95% CI), as an indication of the association between the prognostic scores and the observed odds of satisfaction with surgery, and by Nagelkerke R2, as an indication of the explained variance and thereby the strength of the association. Discrimination measures were used to analyze the predictive performance of the PTs’ prognostic scores in relation to SSO. Discrimination means the predictive ability to discriminate between patients who experienced an effect on the SSO from patients who did not experience effect on the SSO. This was evaluated by calculating the area under the receiver operating characteristic curve (AUC) and its 95% CI. The AUC value is a number between 0 and 1. An AUC of 0.5 represents an independent variable with no discriminating ability, while an AUC of 1.0 represents an independent variable with perfect discrimination (Hoo, Candlish, and Teare, Citation2017). SAS version 9.4 was used for all the statistical analyses.
Sensitivity analysis
We repeated our primary analysis in a sensitivity analysis in which we dichotomized the prognosis with a cutoff at 6.5 and used this as a predictor in both simple 2 × 2 statistics and a logistic regression.
Cohort size
We expected to be able to recruit 200 patients to the cohort and estimated that 20% of patients would be projected to have a poor prognosis (Thomson, Citation2013). The minimal clinically important difference (MCID) of the ODI was considered to be 15 points, with an SD of 25 (Fairbank and Pynsent, Citation2000). A two-sample pooled t test of a normal mean difference of 15 ODI points between patients with poor and good projected prognosis and a two-sided significance level of 0.05 (p ≤ .05) yielded a power of 92%.
Results
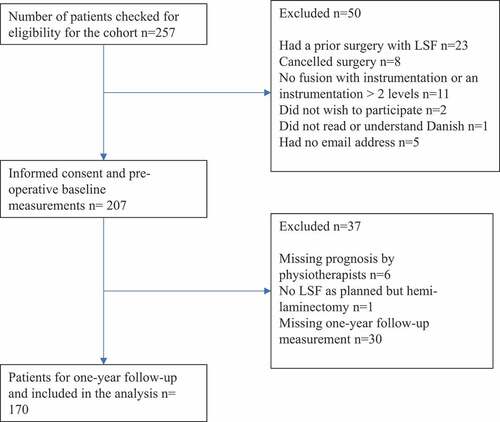
During the study period, 257 patients were screened for eligibility. Of these, 23 patients had a prior LSF, eight canceled their surgery, the LSF in 11 patients involved more than two levels or they declined surgery, one patient did not understand Danish, five patients did not have an e-mail address, and two patients declined participation. Informed consent was obtained from 207 patients. After the surgery, six patients were not given a prognosis by PTs, one participant had a surgery other than LSF, and 30 patients did not answer the one-year follow-up survey. The study thereby consists of 170 patients (82% of the initially included patients) with complete data for the data analysis ().
Figure 1. Flow chart of patient inclusion and patients included in the prediction analysis.
Descriptive statistics
Participant characteristics at baseline, the surgery procedure and the PTs’ prognosis are presented in . No differences were observed between respondents and excluded patients. Of the respondents, 111 (65.3%) were female and mean age was 55.8 (SD 13.4). The most frequent surgical procedure was a one-level instrumented posterior fusion with pedicle screws, with or without intervertebral cage. Patients reported a significant change (p < .01) from baseline on disability, back pain, leg pain, and HRQoL ().
Table 1. Participant characteristics at baseline, Surgery procedure and Prognosis of physiotherapists.
Table 2. Surgery information and PTs’ prognosis values, n = 170.
Table 3. Baseline, Follow-up and Change from baseline in secondary continuous outcomes, n = 170.
A total of 24 PTs participated in the study. Their mean age was 43.1 (SD 12.4) and mean experience of treating back surgery patients was 6.3 years (SD 4.0). Of the prognosis assessments, 81% were performed by female PTs, and 86% were performed at Rigshospitalet – Glostrup.
Prediction analysis
The univariate analysis showed a significant association (slope) between PTs’ prognosis and disability −3.53 95%CI (−5.21 to −1.85), p < .01 one-year post-surgery. This means that patients who were given a good projected prognosis at baseline were more likely to report better scores regarding their disability one-year post surgery. The explained variance of ODI was limited (R2 = 0.09), which means that the projected prognosis accounts for 9% of the variation in the outcomes.
The associations between the PTs’ prognosis and the secondary continuous outcomes pain intensity, HRQoL and GPE at one-year post surgery showed similar results, by a significant association () and a limited explained variance (R2 ≤ 0.07).
Table 4. Univariate linear regression of the physiotherapists’ prognosis and the secondary outcomes one-year post-surgery, n = 170.
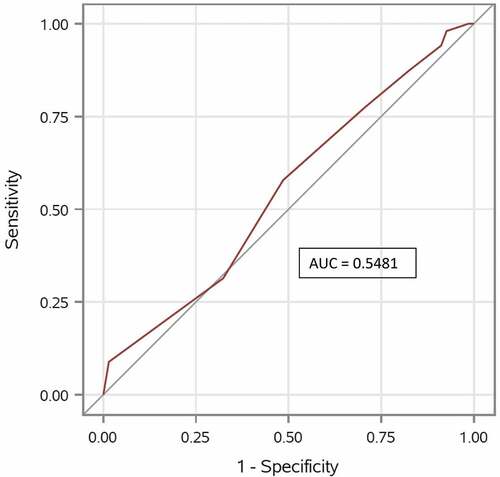
At the one-year follow-up, 102 (60%) patients returned a response of “I am satisfied” on the SSO and 68 (40%) patients responded, “I am not sure about it” (24%) or “I am not satisfied” (16%). The association between the PTs’ prognosis and the SSO score was not statistically significant (R2 = 0.01; p = .17) with an OR = 1.13 (95% CI 0.95 to 1.35). Furthermore, the ability of the PTs’ prognosis to discriminate between patients with a good and bad SSO was poor (AUC 0.55; 95% CI (0.46 to 0.64)), meaning that the PTs prognosis was not better than a random guess ().
Figure 2. Receiver operating characteristic (ROC curve) and area under the curve (AUC). Quantification of physiotherapists’ overall ability to discriminate between “Satisfied with surgery result” and “Not satisfied with surgery result”.
The PTs’ short descriptions of the factors on which they based their prognosis (Appendix A) were incomplete and of poor quality and it was decided not to proceed with further analyses. The sensitivity analysis using dichotomized PT prognosis scores confirmed our finding in the primary analysis (Appendix B).
Discussion
We examined the association between the prognosis of patients undergoing LSF made by PTs mobilizing patients on a surgical ward during the first postoperative days, and the patients’ self-reported disability, pain, HRQoL, global perceived effect, and SSO one-year post-surgery. We found an association between the PTs’ prognosis and disability, pain, HRQoL and GPE; however, the predictive values of the scores were low. We found no association or discriminative ability between the PTs’ prognosis and the patients’ overall judgment of their SSO. The PTs’ prognosis can thereby not be used as a single value to inform early planning of a rehabilitation process after LSF.
Previous studies investigating PTs’ predictive ability for patients with back pain have shown similar results (Cook et al., Citation2015; Dagfinrud et al., Citation2013; Hancock et al., Citation2009; Haxby Abbott and Kingan, Citation2014). The studies have different setups; for example, different settings, choice of variables, and the patients’ duration of back pain. Any comparison of results must therefore be made with caution. Haxby Abbott and Kingan (Citation2014), Dagfinrud et al. (Citation2013) and Cook et al. (Citation2015) all included a disability questionnaire as a dependent variable and reported significant associations between the PTs’ prognosis and the disability questionnaires used. However, the predictive values were low in Haxby Abbott and Kingan (Citation2014) and Dagfinrud et al. (Citation2013) and high only in Cook et al. (Citation2015).
Discussion of outcomes
One reason for a poor predictive value in our study may be the complex factors contributing to post-surgical recovery (Linton and Shaw, Citation2011; Menezes Costa et al., Citation2009). Although the PTs in our study conducted an anamnesis, had access to the patients’ medical records and information from close collaborators such as nurses and doctors in the acute phase after surgery it is known that patients’ well-being can be highly impacted by the effect of pain-killers and side-effects of surgery, such as nausea and dizziness (Nimmo, Foo, and Paterson, Citation2017). As the patients were recruited at two tertiary hospitals and referred to local community health centers for rehabilitation with varying levels of service, the type, amount, timing, and frequency of post-surgical rehabilitation provided over the one-year follow-up can be difficult for the PTs to incorporate in the individual prognosis. This may also explain the limited predictive value.
It is also relevant to discuss if all psycho-social factors, such as thoughts, hopes, and beliefs regarding the surgery, energy to achieve movement despite pain, and patients’ resources (i.e. personal, material, and social) are grasped at the first meeting with the patient. A cohort study by McIlroy, Jadhakhan, Bell, and Rushton (Citation2021) found that pre-surgery walking capacity and higher educational level in patients going through a decompression for lumbar spinal stenosis was associated with decreased risk of poor walking ability. That study shows that it seems to be important to include social factors such as educational level in the prediction of physical activity post-surgery. In a critical review of PTs’ use of a bio-psycho-social approach to patients with LBP the lack of ability to address the social domain including family, work, and socioeconomic status in the PTs’ evaluation of LBP treatment was highlighted (Mescouto, Olson, Hodges, and Setchell, Citation2020).
None of the abovementioned cohort studies included patients going through LSF, so this is the first study to investigate the predictive ability of PTs in a back-surgery setting. It is reasonable to assume that this patient group is more severely affected by their long history of pain than patients with acute LBP in other settings, so it could be relatively more complicated to predict outcome for this patient group. Rushton et al. (Citation2020) performed a qualitative study, using diaries to capture patients’ “lived experiences” in the first month after an LSF. They found that recovery after an LSF depends on a complex interaction between physical, functional, emotional and social domains. That study thereby supports the fact that multifarious factors have an influence on the surgery result after LSF.
Another explanation of the low predictive ability in our study could be the very short time spent together with the patient before giving a prognosis. In a review by Ambady, Bernieri, and Richeson (Citation2000) the validity of initial judgments based on the dynamic information people get in a face-to-face meeting was investigated. These judgments were surprisingly accurate, which contrast with the findings in our study. A reason for this contrast may be caused by the influence hospitalization and surgery have on a person’s demeanor and appearance and thereby also the PTs ability to predict the persons outcome post-surgery. In the cohort study by Harvey et al. (Citation2013), the PTs were reasonably accurate at predicting patients’ mobility post-surgery, but in the same study they only found a marginal difference when they compared PTs who had face-to-face contact with the patient with those who had no face-to-face contact, but only chart records. Time together with this group of patients (post-spinal cord injury) made no difference to the predictive value. It is important that PTs are aware of the potential lack of information and risk for making misinterpretations in their initial judgments in a hospital setting, where time with the patient is limited, surroundings are unfamiliar to the patient and health staff have to quickly make important decisions about the patient’s further rehabilitation before discharge.
Strengths and limitations of the study
A limitation of this study is the lack of validation of the tool used as the predictive variable. This must be included in the interpretation of results. The same predictive approach was used in other cohorts (Cook et al., Citation2015; Henriksen, Mukriyani, and Juhl, Citation2021), and it is thereby possible to compare results.
Another limitation of our study is the analysis of the patients’ dichotomized answer in SSO as either “I am satisfied” or “I am not satisfied” for several reasons. Firstly, the variable is not validated but used as a simple question including the patients’ general satisfaction with the surgery results. Secondly, these response options are not exhaustive and may not represent the patient’s evaluation of the effect of the surgery. Thirdly, the patients are asked to judge their “satisfaction with the surgery outcome,” and this secondary outcome was compared with the PTs’ prognosis of the patient’s overall outcome of the surgery. These two variables are perhaps not suitable for comparison, and the PTs may have answered differently if they had instead been asked to predict “patients’ satisfaction.”
Finally, due to incomplete and poor data quality, we decided not to include the PTs’ reasons for their prognosis in an analysis. This may be a limitation of the study because if prognosis was based on reasons not seen in previous research this could have been informative for training purposes and knowledge improvement among PTs.
The comparability of the study with other studies, both regarding the predictive tool and also the results, is a strength in this study. The study by Henriksen, Mukriyani, and Juhl (Citation2021) that investigated the predictive value of PTs’ prognosis in patients undergoing a knee replacement had similar results as our study. Their results may also be impacted by the difficulty involved in predicting a prognosis in a surgery setting. The fact that another study in a surgery setting but with a different patient group has similar results as our study, increases the external validity and generalizability of our results. Another strength of the study was that the required number of patients (n = 170) was included and the risk of type 1 and 2 errors thereby limited in consideration of a normal limit of 80% power.
PTs represent an important resource in patients’ mobilization after surgery and for patients to feel safe to move again. Having said that, in the early planning of further rehabilitation, PTs, and other health staff should be aware that effect of surgery is impacted by several, interrelated factors (Abbott, Tyni-Lenne, and Hedlund, Citation2011; Alodaibi, Minick, and Fritz, Citation2013; Celestin, Edwards, and Jamison, Citation2009; den Boer et al., Citation2006; Hinrichs-Rocker et al., Citation2009; McIlroy et al., Citation2021; Rushton, Zouglas, Powell, and Bart Staal, Citation2018; Wilhelm et al., Citation2017), which are probably not evident in the first days after LSF.
Based on our results, it would be interesting to explore where and when the planning of further rehabilitation should be placed to make an optimal prognosis of the patients’ outcome and a judgment about special needs regarding rehabilitation. In rehabilitation planning, it might be beneficial to patients to be visited at home, where they are in familiar surroundings close to their relatives and not to the same extent affected by acute pain and side effects from anesthesia. Patients would thereby have a better base and opportunity to cooperate and home visits may give the PTs a more realistic picture of the patients’ needs and resources. We still need more knowledge about how to identify patients in need of extra attention after back surgery, but to do this, we need studies that embrace the complexity of living with CLBP and recovering from CLBP after back surgery.
Conclusion
In this study, we found associations between the prognosis given by PTs treating patients on a surgical hospital ward and one-year improvements in disability, self-reported pain, HRQoL and GPE in LSF patients. We found no association between the PTs prognosis and patients’ satisfaction with the achieved LSF outcome one-year post-surgery. Overall, the PTs’ prognosis had a low predictive value and should therefore not be used as a single component in further rehabilitation planning.
Acknowledgments
The authors would like to thank the physiotherapists at Elective Surgery Centre, Silkeborg Regional Hospital and at Department of Occupational Therapy and Physiotherapy, Rigshospitalet - Glostrup, for their time and engagement in making a prognosis for patients undergoing LSF. This work was supported by the “The Research Fund of Rigshospitalet”; “Tryg Foundation,” grant number 125410; “Association of Danish Physiotherapists,” grant number 16200; and “Gangsted Foundation,” grant number A40261.
Disclosure statement
No potential conflict of interest was reported by the author(s).
Additional information
Funding
References
- Abbott AD, Tyni-Lenne R, Hedlund R 2011 Leg pain and psychological variables predict outcome 2-3 years after lumbar fusion surgery. European Spine Journal 20: 1626–1634. 10.1007/s00586-011-1709-6.
- Alaca N, Kaba H, Atalay A 2020 Associations between the severity of disability level and fear of movement and pain beliefs in patients with chronic low back pain. Journal of Back and Musculoskeletal Rehabilitation 33: 785–791. 10.3233/BMR-171039.
- Alodaibi FA, Minick KI, Fritz JM 2013 Do preoperative fear avoidance model factors predict outcomes after lumbar disc herniation surgery? A systematic review. Chiropractic and Manual Therapies 21: 40. 10.1186/2045-709X-21-40.
- Ambady N, Bernieri F, Richeson J 2000 Toward a histology of social behavior: Judgemental accuracy from thin slices of the behavioral stream. Advances in Experimental Social Psychology 32:201–271.
- Bobos P, Ziebart C, Furtado R, Lu Z, MacDermid JC 2020 Psychometric properties of the global rating of change scales in patients with low back pain, upper and lower extremity disorders. A systematic review with meta-analysis. Journal of Orthopaedics 21: 40–48. 10.1016/j.jor.2020.01.047.
- Brooks R 1996 EuroQol: The current state of play. Health Policy 37: 53–72. 10.1016/0168-8510(96)00822-6.
- Carlsson AM 1983 Assessment of chronic pain. I. Aspects of the reliability and validity of the visual analogue scale. Pain 16: 87–101. 10.1016/0304-3959(83)90088-X.
- Celestin J, Edwards RR, Jamison RN 2009 Pretreatment psychosocial variables as predictors of outcomes following lumbar surgery and spinal cord stimulation: A systematic review and literature synthesis. Pain Medicine 10: 639–653. 10.1111/j.1526-4637.2009.00632.x.
- Cook CE, Moore TJ, Learman K, Showalter C, Snodgrass SJ 2015 Can experienced physio-therapists identify which patients are likely to succeed with physical therapy treatment? Archives of Physiotherapy 5: 3. 10.1186/s40945-015-0003-z.
- Dagfinrud H, Storheim K, Magnussen LH, Ødegaard T, Hoftaniska I, Larsen LG, Ringstad PO, Hatlebrekke F, Grotle M 2013 The predictive validity of the Örebro Musculoskeletal Pain Questionnaire and the clinicians’ prognostic assessment following manual therapy treatment of patients with LBP and neck pain. Manual Therapy 18: 124–129. 10.1016/j.math.2012.08.002.
- Danish Society of Spinal Surgery 2018 Danespine - Nationwide Back Surgical PRO Database. Middelfart, Denmark. http://drks.ortopaedi.dk/om-danespine/ Accessed 16 February 2022
- den Boer JJ, Oostendorp RA, Beems T, Munneke M, Oerlemans M, Evers AW 2006 A systematic review of bio-psychosocial risk factors for an unfavourable outcome after lumbar disc surgery. European Spine Journal 15: 527–536. 10.1007/s00586-005-0910-x.
- Fairbank JC, Pynsent PB 2000 The Oswestry Disability Index. Spine 25: 2940–2952. 10.1097/00007632-200011150-00017.
- Hancock MJ, Maher CG, Latimer J, Herbert RD, McAuley JH 2009 Can rate of recovery be predicted in patients with acute low back pain? Development of a clinical prediction rule. European Journal of Pain 13: 51–55. 10.1016/j.ejpain.2008.03.007.
- Harris PA, Taylor R, Minor BL, Elliott V, Fernandez M, O’Neal L, McLeod L, Delacqua G, Delacqua F, Kirby J, et al. 2019 The REDCap consortium: Building an international community of software platform partners. Journal of Biomedical Informatics 95:103208. 10.1016/j.jbi.2019.103208.
- Harris PA, Taylor R, Thielke R, Payne J, Gonzalez N, Conde JG 2009 Research electronic data capture (REDCap) - A metadata-driven methodology and workflow process for providing translational research informatics support. Journal of Biomedical Informatics 42: 377–381. 10.1016/j.jbi.2008.08.010.
- Hartvigsen J, Hancock MJ, Kongsted A, Louw Q, Ferreira ML, Genevay S, Hoy D, Karppinen J, Pransky G, Sieper J, et al. 2018 What low back pain is and why we need to pay attention. Lancet 391:2356–2367. 10.1016/S0140-6736(18)30480-X.
- Harvey LA, Chu J, Adams R, Batty J, Barratt D, Kwok S 2013 Accuracy of physiotherapists’ predictions for mobility outcomes at 1-year post spinal cord injury. Physiotherapy Theory and Practice 29: 393–400. 10.3109/09593985.2012.745179.
- Haxby Abbott J, Kingan EM 2014 Accuracy of physical therapists’ prognosis of low back pain from the clinical examination: A prospective cohort study. Journal of Manual and Manipulative Therapy 22: 154–161. 10.1179/2042618613Y.0000000045.
- Henriksen M, Mukriyani H, Juhl C 2021 Knee replacement outcome predicted by physiotherapists: A prospective cohort study. PeerJ 9: e10838. 10.7717/peerj.10838.
- Hinrichs-Rocker A, Schulz K, Järvinen I, Lefering R, Simanski C, Neugebauer EAM 2009 Psychosocial predictors and correlates for chronic post-surgical pain (CPSP) - A systematic review. European Journal of Pain 13: 719–730. 10.1016/j.ejpain.2008.07.015.
- Hoo Z, Candlish J, Teare D 2017 What is an ROC curve. Emergency Medicine Journal 34: 357–359. 10.1136/emermed-2017-206735.
- ICF Research Branch 2017 ICF Core Set for Low Back Pain. https://www.icf-research-branch.org/icf-core-sets-projects2/musculoskeletal-conditions/icf-core-set-for-low-back-pain Accessed16 February 2022.
- Koenders N, Rushton A, Verra ML, Paul WC, Hoogeboom TJ, Staal JB 2018 Pain and disability after first-time spinal fusion for lumbar degenerative disorders: A systematic review and meta-analysis Back pain following first-me LSF for degenerative disorders Leg pain following first-me LSF for degenerative disorders. European Spine Journal 28: 696–709. 10.1007/s00586-018-5680-3.
- Lauridsen HH, Hartvigsen J, Manniche C, Korsholm L, Grunnet-Nilsson N 2006a Danish version of the Oswestry Disability Index for patients with low back pain. Part 1: Cross-cultural adaptation, reliability and validity in two different populations. European Spine Journal 15: 1705–1716. 10.1007/s00586-006-0117-9.
- Lauridsen HH, Hartvigsen J, Manniche C, Korsholm L, Grunnet-Nilsson N 2006b Danish version of the Oswestry disability index for patients with low back pain. Part 2: Sensitivity, specificity and clinically significant improvement in two low back pain populations. European Spine Journal 15: 1717–1728. 10.1007/s00586-006-0128-6.
- Linton SJ, Shaw WS 2011 Impact of psychological factors in the experience of pain. Physical Therapy 91: 700–711. 10.2522/ptj.20100330.
- Mannion AF, Elfering A 2006 Predictors of surgical outcome and their assessment. European Spine Journal 15: S93–108. 10.1007/s00586-005-1045-9.
- McIlroy S, Jadhakhan F, Bell D, Rushton A 2021 Prediction of walking ability following posterior decompression for lumbar spinal stenosis. European Spine Journal 30: 3307–3318. 10.1007/s00586-021-06938-6.
- McIlroy S, Walsh E, Sothinathan C, Stovold E, Norwitz D, Norton S, Weinman J, Bearne L 2021 Pre-operative prognostic factors for walking capacity after surgery for lumbar spinal stenosis: A systematic review. Age and Ageing 50: 1529–1545. 10.1093/ageing/afab150.
- Menezes Costa LD, Maher CG, McAuley JH, Hancock MJ, Herbert RD, Refshauge KM, Henschke N 2009 Prognosis for patients with chronic low back pain: Inception cohort study. BMJ 339:850.
- Mescouto K, Olson RE, Hodges PW, Setchell J 2020 A critical review of the biopsychosocial model of low back pain care: Time for a new approach? Disability and Rehabilitation 10.1080/09638288.2020.1851783. Online ahead of print.
- Nimmo SM, Foo IT, Paterson HM 2017 Enhanced recovery after surgery: Pain management. Journal of Surgical Oncology 116: 583–591. 10.1002/jso.24814.
- Rabin R, de Charro F 2001 EQ-5D: A measure of health status from the EuroQol Group. Annals of Medicine 33: 337–343. 10.3109/07853890109002087.
- Ravindra VM, Senglaub SS, Rattani A, Dewan MC, Hartl R, Bisson E, Park KB, Shrime MG 2018 Degenerative lumbar spine disease: Estimating global incidence and worldwide volume. Global Spine Journal 8: 784–794. 10.1177/2192568218770769.
- Rushton A, Jadhakhan F, Masson A, Athey V, Staal JB, Verra ML, Emms A, Reddington M, Cole A, Willems PC, et al. 2020 Patient journey following lumbar spinal fusion surgery (FuJourn): A multicentre exploration of the immediate post-operative period using qualitative patient diaries. PLoS One 15:e0241931. 10.1371/journal.pone.0241931.
- Rushton A, Wright C, Heap A, White L, Eveleigh G, Heneghan N 2014 Survey of current physiotherapy practice for patients undergoing lumbar spinal fusion in the United Kingdom. Spine 39: E1380–E1387. 10.1097/BRS.0000000000000573.
- Rushton A, Zoulas K, Powell A, Bart Staal J 2018 Physical prognostic factors predicting outcome following lumbar discectomy surgery: Systematic review and narrative synthesis. BMC Musculoskeletal Disorders 19:326.
- Shafshak TS, Elnemr R 2021 The Visual Analogue Scale versus Numerical Rating Scale in measuring pain severity and predicting disability in low back pain. Journal of Clinical Rheumatology 27: 282–285. 10.1097/RHU.0000000000001320.
- Sørensen J, Davidsen M, Gudex C, Pedersen KM, Brønnum-Hansen H 2009 Danish EQ-5D population norms. Scandinavian Journal of Public Health 37: 467–474. 10.1177/1403494809105286.
- Thomson S 2013 Failed back surgery syndrome - Definition, epidemiology and demographics. British Journal of Pain 7: 56–59. 10.1177/2049463713479096.
- von Elm E, Altman DG, Egger M, Pocock SJ, Gøtzsche PC, Vandenbroucke JP 2014 The strengthening the reporting of observational studies in epidemiology (STROBE) statement: Guidelines for reporting observational studies. International Journal of Surgery 12: 1495–1499. 10.1016/j.ijsu.2014.07.013.
- Wilhelm M, Reiman M, Goode A, Richardson W, Brown C, Vaughn D, Cook C 2017 Psychological predictors of outcomes with lumbar spinal fusion: A systematic literature review. Physiotherapy Research International 22: e1648. 10.1002/pri.1648.
- Wittrup-Jensen KU, Lauridsen J, Gudex C, Pedersen KM 2009 Generation of a Danish TTO value set for EQ-5D health states. Scandinavian Journal of Public Health 37: 459–466. 10.1177/1403494809105287.
Appendix A.
Prognosis sheet
Completed by the physiotherapist:
Your age: ________
Your sex:________
Name of your hospital: ______________________________________________
Years of clinical experience with patients going through back-surgery: ________________
Patient’s prognosis 12 months after the back surgery (mark a ring around one number):
Very poor prognosisAn excellent prognosis
012345678910
State shortly what you base your judgment upon:
____________________________________________________________________________________________________________________________________________________________
______________________________________________________________________________
______________________________________________________________________________
______________________________________________________________________________
______________________________________________________________________________
______________________________________________________________________________
______________________________________________________________________________
______________________________________________________________________________
Appendix B.
Sensitivity analysis – Dichotomization of the predictive variable
Dichotomization of the predictive variable to a poor projected prognosis (score ≤ 6) and a good projected prognosis (score ≥ 7). There were 43 (25%) with a poor projected prognosis and 127 (75%) with a good projected prognosis.
The unadjusted differences between individuals with a good vs poor prognosis in the continuous outcomes at one-year follow-up (ODI, Back and leg pain, EQ5Dindex and EQ5D VAS) were statistically significant, also confirming our previous results that suggested linear relationships between the prognostic score (on a 0–10 scale) and the outcomes, as presented in .
At one-year follow-up, 23 (53%) patients with a poor prognosis had a satisfactory outcome (SO) and 79 (62%) of the patients with a good prognosis had a SO with a statistically non-significant risk difference of 9% and 95% CI (−26 to 8); P = .31. In relative terms, the association between the dichotomized prognosis and the SO score at one-year follow-up was also not statistically significant (R2 = 0.006; p = .3144) with an OR = 1.43 and 95% CI (0.71 to 2.88). Furthermore, the ability of the dichotomized PT prognosis score to discriminate between patients with a good and bad SO was poor (AUC 0.53 and 95% CI (0.47 to 0.60)).