
ABSTRACT
Visual hallucinations after central or peripheral impairment, commonly called Charles Bonnet syndrome, are often highly distressing and with few available treatment options. Here we report a case where an adolescent developed severely distressing visual hallucinations after hypoxic damage to the occipital cortex following a suicide attempt. The patient received active and sham occipital continuous theta-burst stimulation (cTBS) in a single-case experimental research design and a subsequent open phase, to evaluate cTBS as a Charles Bonnet treatment. The visual hallucinations seemed to decrease more during active than sham cTBS in the blind phase, and in the following week of repeated five daily treatments they almost disappeared. A normalization of increased activity in the lateral visual network after cTBS was observed on a functional magnetic resonance imaging resting-state analysis compared with 42 healthy controls. Visual evoked potentials stayed largely unchanged both in the sham-controlled blind phase and the subsequent open phase. During the two weeks after the open phase with repeated cTBS sessions, the visual hallucinations gradually reappeared and almost returned to the baseline level. Our findings suggest that active cTBS over the primary visual cortex can reduce visual hallucinations through modulation of downstream visual regions, though the effect is temporally limited.
Introduction
Disabling visual hallucinations can sometimes occur after peripheral or central visual impairment and in the absence of severe mental illness it is commonly called Charles Bonnet syndrome (Jurisic et al., Citation2018). This phenomenon occurs predominantly in elderly people, with only a few cases reported in young adults (Elflein et al., Citation2016). There are few available treatment options, none of which have been systematically investigated, as this is a rare disorder (Jurisic et al., Citation2018). According to one theory, the hallucinations result from a release phenomenon due to changes in cortical excitability (Cogan, Citation1973). Thus, treatment with repetitive transcranial magnetic stimulation (rTMS) to inhibit the primary visual cortex has been proposed and there are a few case reports using this strategy with short-term effect in adults with brain tissue damage and visual hallucinations (Merabet et al., Citation2003; Passera et al., Citation2020; Rafique et al., Citation2016).
The aim of this case study was to apply an inhibitory rTMS protocol called continuous theta-burst stimulation (cTBS) over the primary visual cortex to treat an adolescent patient with chronic visual hallucinations after hypoxic damage of the occipital cortex (Huang et al., Citation2005). We also aimed to explore treatment efficacy and describe the neurobiological effects of this intervention in a blinded single-case design and also to explore changes in visual brain networks using a healthy comparison group.
Materials and methods
The first part of this study is a single-case experimental research design (Smith, Citation2012), with repeated measures during and after alternating real and sham intervention. The second part explores the effect of repeated open-label cTBS treatments on symptom ratings as well as visual resting-state networks. There was no procedural changes during the course of the single-case experiment. No replication was planned in advance, but the patient actually came back a year later and asked for, and achieved, the same intervention as in the open-label phase of this study as a clinical treatment. The investigation was performed at an academic, hospital-based centre in Uppsala, Sweden. The study was approved by the Swedish Ethical Review Board and the patient, and both parents, provided written informed consent.
Case presentation
Following a suicide attempt by hanging in early adolescence, this patient suffered from a mixture of continuous simple and complex visual hallucinations with complex patterns, distorted faces, intimidating fingers, but also imagery induced by auditory stimuli, e.g., seeing a bus or a cat when hearing them. The patient was functionally blind (see supplementary material for visual examination details), but also had dysarthria, spastic paresis with dystonia, and paraesthesias, the latter sometimes co-occurring with the visual hallucinations. The visual hallucinations were subjectively the most distressing symptom to the patient. After the anoxia, the patient was cognitively well preserved with good school performance and was maintained psychiatrically stable on a low dose of a serotonergic reuptake inhibitor. Medication with antidopaminergic, antiepileptic, or antidepressant agents had no effect on the hallucinations but many side effects. Subacute magnetic resonance imaging (MRI) one week after the hypoxic incident showed restricted diffusion in widespread occipital regions and in pre- and postcentral cortex bilaterally. Several subsequent MRIs one year later showed focal atrophy in the form of distinct thinning of grey matter in the same regions. Highly suspected atrophy also in the posterior putamina. Susceptibility-weighted imaging showed signal loss in the afflicted cortex, interpreted as iron deposits secondary to parenchymal degeneration. Flair images showed Wallerian degeneration along the corticospinal tracts and discrete occipital gliosis, less widespread than the cortical atrophy. FDG-PET was performed with blindfolds to minimize visual processing and to evoke hallucinations. Uptake was significantly decreased in areas with previously described atrophy (occipital, dorsal putamina, perirolandic cortex). Uptake was slightly increased in lateral temporal regions bilaterally, but not immediately adjacent to the atrophied areas.
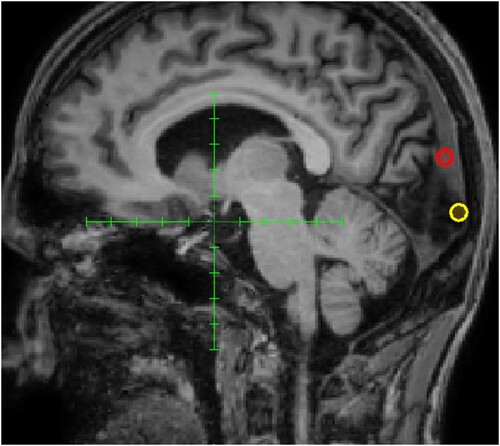
Even though the occipital lesion was widespread according to MRI and PET imaging there was a clinically measurable difference in the upper and lower visual field on the clinical visual examination. Therefore, we chose to empirically test to inhibit the upper and lower part of V1 separately with rTMS as a clinical treatment attempt (see for the targets that were positioned in the midline, and approximately one centimetre above and below the calcarine sulcus, respectively). First, a trial of low-frequency rTMS (1 Hz, 600 pulses) over the superior part of the primary visual cortex with only minimal effect, but when changing target to the inferior part of V1 the patient reported a more distinct reproducible partial suppression of the hallucinations, yet only for a duration of a few hours.
Figure 1. Clinical treatment targets. The red ring shows the first target over the superior part of the occipital cortex with only minimal effects of transcranial magnetic stimulation and the yellow ring shows the subsequent target over the inferior part where symptom relief was achieved.
Thereafter, applying daily low-frequency rTMS during a week was not followed by any increased effect duration or cumulative effect on how much the hallucinations were suppressed. Subsequently, the protocol was switched to daily cTBS (40 s) over the inferior part of V1, whereby the patient experienced a profound decrease of visual hallucinations, with increasing effect duration and cumulative effect of suppression of the hallucinations. As we now had found a possible treatment target and protocol that might work we refrained from applying cTBS over the superior part of V1 and instead initiated the following single-case experiment.
Intervention
A cTBS protocol, shown to decrease cortical excitability, was delivered over the occipital cortex (Huang et al., Citation2005). In the blind phase the intervention alternated every weekday between active and sham cTBS over two weeks. No randomization was done. In the subsequent open-label part of the study, active cTBS was delivered 5 times a day during four consecutive days with 50 min between each session.
The cTBS intervention consisted of bursts of three magnetic pulses at 50 Hz, with bursts delivered continuously at 5 Hz for 40 s. The treatment was targeting the inferior part of V1 in the midline of the occipital lobes using neuronavigation, with the coil handle pointing upwards and the actual point where each stimulation was delivered was recorded for continuous evaluation of procedural fidelity.
As the patient had a marked Wallerian degeneration of the pyramidal tract as further sequelae, a conventional motor threshold determination was deemed unreliable. Instead, yet not reliable, the highest tolerable dose, determined in the previous clinical treatment attempt to be 60% of maximum stimulator output, was used. This was determined using a patient pain rating at 7 on a Numerical Rating Scale (NRS), with 0 being no pain and 10 unbearable pain where we must stop the intervention immediately. This way of determining stimulation intensity may have led to a stimulation being outside the rTMS safety guidelines (Rossi et al., Citation2009). However, the main concern regarding safety is induction of seizures and as we used inhibitory protocols, which are actually also used to decrease epileptic activity, and there are only three reported cases of seizures during cTBS in the literature (Stultz et al., Citation2020), the risk was deemed low. Furthermore, the stimulation was delivered in a hospital at a unit where electroconvulsive treatment is also performed, thus an expert setting taking care of epileptic seizures. The risk of seizures was also discussed with the patient and parents and as the patient was severely distressed by the hallucinations, had no other potential treatment option, and the risk of seizure was deemed low, the potential benefits outweighed the risk and the shared decision was to perform this treatment attempt. The treatment was delivered with a magnetic stimulator (powerMAG research ppTMS, Mag & More), using a double coil PMD70-pCool and a sham version of the same coil which looks identical but where the magnetic field is shielded and diverted to achieve superficial scalp stimulation while mimicking the sensational component of active treatment. The patient and the patient’s parents were blinded to treatment allocation.
Target behaviour: Symptom ratings
A baseline symptom level was determined by one week of five daily symptom ratings pseudo-randomly assigned over 2.5 h slots. Symptom ratings were collected through automated text messages to the patient’s voice-over-controlled smartphone. The patient rated intensity and distress of visual hallucinations during the past hour on a NRS ranging from 0 to 10. Daily symptom ratings continued throughout the two-week blinded intervention phase, the open-label treatment week, and two weeks thereafter.
Depressive symptoms were assessed with the Montgomery and Asberg depression rating scale (MADRS) (Montgomery & Asberg, Citation1979) and perceived health with EQ-NRS from 0 to 100 (Feng et al., Citation2014).
Electrophysiology
For details on data collection and preprocessing, see the supplementary material. Visual evoked potentials (VEPs) from rapid flash stimuli were recorded over the primary visual cortex to assess the functional integrity of the visual pathways (Odom et al., Citation2016).
Brain imaging
Magnetic resonance imaging (MRI) scanning protocol and preprocessing steps are detailed in the supplementary material. Briefly, the patient underwent three resting-state functional MRI (rs-fMRI) sessions, two baseline sessions one week apart and a follow-up session following the last open-label cTBS treatment. Brain images from a control group of 42 psychiatrically healthy participants, recruited by advertising, with a mean age of 29.5 (SD 11.2) using the same scanning parameters were included for comparison. This control group was primarily collected as a comparison group to a trial of dorsomedial intermittent TBS for anhedonia, and all participants provided written informed consent and the study was approved by the ethical review board in Uppsala (Persson et al., Citation2020). Spatial independent component analysis (ICA) was used on a concatenated time series across controls and patient scanning sessions to identify five visual networks based on a previous publication labelled lateral, superior-posterior, anterior, medial, and inferior-posterior here (Allen et al., Citation2011; Boucard et al., Citation2016).
Statistics
To compare spatial components between the patient and control group for each scanning session, voxel-wise Crawford’s modified t-test was used with a significance threshold of p < .01, false discovery rate corrected for multiple comparisons, after regressing out mean FD (Crawford et al., Citation1998).
Results
All planned interventions were delivered. During the blind phase, with alternating sham and active cTBS, there was a cumulative effect on NRS ratings of the visual hallucinations over the treatment course. To visualize the effect of sham vs. active cTBS, mean rating from the previous day was subtracted from the mean rating of each treatment day and plotted as a function of treatment allocation. There was a net decrease in the mean NRS ratings of the intensity of the visual hallucinations from the day before in all days but one after the verum cTBS. In contrast, there was an equal distribution of increase and decrease of the visual hallucinations after sham cTBS ((A)).
Figure 2. (A) Change in symptom intensity ratings as a function of treatment condition during the blind phase. To take into account an overall accumulative effect, each data point represents the mean rating for the corresponding day minus the mean rating for the previous day. (B) Upper: Symptom intensity ratings plotted as a function of time for the baseline period, open phase, and subsequent follow-up. The gap in the X-axis reflects the blind phase. Thus, the last few baseline data points correspond to the weekend following the blind phase. Lower: Symptom intensity ratings for the blinded phase, including the same initial baseline period as the plot above. (C) Comparison of each visual component between healthy controls and the patient for each of the three time points (two baseline sessions and one post cTBS session). Left: For components with a significantly greater activation in the patient compared to controls, bars represent the average beta across voxels for each component and time point (components with no difference in activation are not represented). Right: The differences between controls and the patient across baseline sessions in the lateral component are overlayed on an anatomical image. Increased activity in the patient is observed in the middle and inferior occipital gyri, middle temporal gyrus, fusiform gyrus, and cerebellum anterior lobe in the right hemisphere.
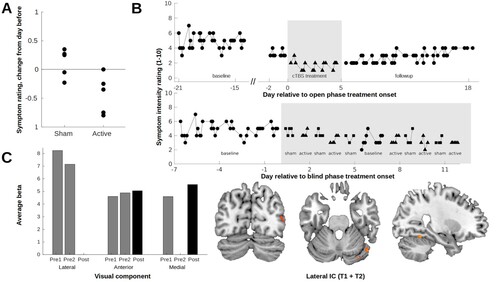
The patient’s NRS ratings of visual hallucinations are detailed in (B). Mean intensity ratings during the baseline period was 4.8 (SD 0.9). During the open phase with five daily cTBS treatments, the NRS ratings dropped during the first day of treatment and stayed around NRS 1–2 during the week of intervention. During the following two weeks of follow-up the NRS ratings gradually increased up to around 4.
Comparing the patient to the 42 controls in the five visual resting-state networks revealed a higher activity in the lateral visual network (including the middle and inferior occipital gyri, middle temporal gyrus, fusiform gyrus, and cerebellum anterior lobe in the right hemisphere) on both of the patient’s two baseline MR scans but this was no longer present on the MR scan after the open phase of 20 occipital cTBS treatments over four days ((C)). There was also altered activity in the anterior and the medial networks over time, but without a clear correspondence to the cTBS intervention.
Reproducible flash VEPs were acquired during baseline, with a negative peak at 50 ms as its most prominent feature. However, VEPs stayed largely unchanged, with the difference between sham and active, as well as before and after open-label cTBS, being well within the range of baseline fluctuations (see Supplementary Figure S1).
No changes in the ophthalmological findings were found directly after the treatment.
The MADRS score was 3 before and after the open phase, and EQ-NRS 70 and 65, respectively. The scalp pain ratings from the cTBS treatments ranged from 2 to 6 during the treatment course. No additional adverse events occurred.
The patient returned one year later for a second identical clinical cTBS treatment. After this treatment course the NRS ratings of the visual hallucinations decreased from 8 to 1 but again the treatment effect only lasted a fortnight.
Discussion
In this first case of treating an adolescent with Charles Bonnet syndrome with occipital cTBS we conclude that the visual hallucinations seemed to decrease more during active than sham cTBS in the blind phase, and that in the open phase of repeated five daily treatments the visual hallucinations almost disappeared. The following two weeks the visual hallucinations gradually reappeared and almost returned to the baseline level.
While the exact mechanisms underlying Charles Bonnet syndrome remain elusive one theory posits that they result from a release phenomenon (Cogan, Citation1973) in this case a disinhibition of secondary visual cortex due to damage of the primary visual cortex. The observed normalization of increased activity in the lateral visual network is in line with this. An alternative explanation is that increased excitatory activity at the border of the lesion drives downstream regions as has also previously been reported (Passera et al., Citation2020), which is in line with both the findings of increased activity at baseline in primary visual regions, suppression of lateral regions following treatment, and reduction of symptoms using an inhibitory protocol. However, we did not observe any direct effect of cTBS on the stimulated region as reflected in unchanged flash VEPs recorded over the treatment target, and activity in primary visual regions.
Apart from the inherent limitation of only having one participant on whom the intervention was tested, there are also some limitations within this research design framework worthwhile mentioning. One limitation is that even more multiple baselines could have been applied, even though that might have affected the tolerability of study participation. Further limitation is the lack of randomization of the treatment sequence and that the magnetic stimulator operator was not blinded to the intervention allocation.
Whether more permanent changes in cortical excitability could be achieved with a prolonged treatment protocol is still an open question, but the results of this study should encourage further investigations.
supplementary_revised.docx
Download MS Word (153.3 KB)Acknowledgements
The authors would like to thank the patient and the patient’s parents for their valuable input and effort spent participating in this study. This work was supported by the Swedish Research Council under Grant 2016-02362 and by an unrestricted grant from Thurings foundation.
Disclosure statement
No potential conflict of interest was reported by the author(s).
Additional information
Funding
References
- Allen, E. A., Erhardt, E. B., Damaraju, E., et al. (2011). A baseline for the multivariate comparison of resting-state networks. Frontiers in Systems Neuroscience, 5. https://doi.org/10.3389/fnsys.2011.00002.
- Boucard, C. C., Rauschecker, J. P., Neufang, S., Berthele, A., Doll, A., Manoliu, A., Riedl, V., Sorg, C., Wohlschläger, A., & Mühlau, M. (2016). Visual imagery and functional connectivity in blindness: A single-case study. Brain Structure and Function, 221(4), 2367–2374. https://doi.org/10.1007/s00429-015-1010-2
- Cogan, D. G. (1973). Visual hallucinations as release phenomena. Albrecht von Graefes Archiv für Klinische und Experimentelle Ophthalmologie, 188(2), 139–150. https://doi.org/10.1007/BF00407835
- Crawford, J. R., Howell, D. C., & Garthwaite, P. H. (1998). Payne and jones revisited: Estimating the abnormality of test score differences using a modified paired samples t test. Journal of Clinical and Experimental Neuropsychology, 20(6), 898–905. https://doi.org/10.1076/jcen.20.6.898.1112
- Elflein, H. M., Rudy, M., Lorenz, K., Ponto, K. A., Scheurich, A., & Pitz, S. (2016). Charles bonnet’s syndrome: Not only a condition of the elderly. Graefe's Archive for Clinical and Experimental Ophthalmology, 254(8), 1637–1642. https://doi.org/10.1007/s00417-016-3387-x
- Feng, Y., Parkin, D., & Devlin, N. J. (2014). Assessing the performance of the EQ-VAS in the NHS PROMs programme. Quality of Life Research, 23(3), 977–989. https://doi.org/10.1007/s11136-013-0537-z
- Huang, Y.-Z., Edwards, M. J., Rounis, E., Bhatia, K. P., & Rothwell, J. C. (2005). Theta burst stimulation of the human motor cortex. Neuron, 45(2), 201–206. https://doi.org/10.1016/j.neuron.2004.12.033
- Jurisic, D., Sesar, I., Cavar, I., Sesar, A., Zivkovic, M., & Curkovic, M. (2018). Hallucinatory experiences in visually impaired individuals: Charles Bonnet syndrome - implications for research and clinical practice. Psychiatria Danubina, 30(2), 122–128. https://doi.org/10.24869/psyd.2018.122
- Merabet, L. B., Kobayashi, M., Barton, J., & Pascual-Leone, A. (2003). Suppression of complex visual hallucinatory experiences by occipital transcranial magnetic stimulation: A case report. Neurocase, 9(5), 436–440. https://doi.org/10.1076/neur.9.5.436.16557
- Montgomery, S. A., & Asberg, M. (1979). A new depression scale designed to be sensitive to change. British Journal of Psychiatry, 134(4), 382–389. https://doi.org/10.1192/bjp.134.4.382
- Odom, J. V., Bach, M., Brigell, M., Holder, G. E., McCulloch, D. L., Mizota, A., & Tormene, A. P. (2016). ISCEV standard for clinical visual evoked potentials: (2016 update). Documenta Ophthalmologica, 133(1), 1–9. https://doi.org/10.1007/s10633-016-9553-y
- Passera, B., Harquel, S., Vercueil, L., Dojat, M., Attye, A., David, O., & Chauvin, A. (2020). Modulation of visual hallucinations originating from deafferented occipital cortex by robotized transcranial magnetic stimulation. Clinical Neurophysiology, 131(8), 1728–1730. https://doi.org/10.1016/j.clinph.2020.04.009
- Persson, J., Struckmann, W., Gingnell, M., Fällmar, D., & Bodén, R. (2020). Intermittent theta burst stimulation over the dorsomedial prefrontal cortex modulates resting-state connectivity in depressive patients: A sham-controlled study. Behavioural Brain Research, 394, 112834. https://doi.org/10.1016/j.bbr.2020.112834
- Rafique, S. A., Richards, J. R., & Steeves, J. K. (2016). rTMS reduces cortical imbalance associated with visual hallucinations after occipital stroke. Neurology, 87(14), 1493–1500. https://doi.org/10.1212/WNL.0000000000003180
- Rossi, S., Hallett, M., Rossini, P. M., & Pascual-Leone, A. (2009). Safety, ethical considerations, and application guidelines for the use of transcranial magnetic stimulation in clinical practice and research. Clinical Neurophysiology, 120(12), 2008–2039. https://doi.org/10.1016/j.clinph.2009.08.016
- Smith, J. D. (2012). Single-case experimental designs: A systematic review of published research and current standards. Psychological Methods, 17(4), 510–550. https://doi.org/10.1037/a0029312
- Stultz, D. J., Osburn, S., Burns, T., Pawlowska-Wajswol, S., & Walton, R. (2020). Transcranial magnetic stimulation (TMS) safety with respect to seizures: A literature review. Neuropsychiatric Disease and Treatment, 16, 2989–3000. https://doi.org/10.2147/NDT.S276635