
ABSTRACT
People with multiple sclerosis (pwMS) report many different visual complaints, but not all of them are well understood. Decline in visual, visuoperceptual and cognitive functions do occur in pwMS, but it is unclear to what extend those help us understand visual complaints. The purpose of this cross-sectional study was to explore the relation between visual complaints and decline in visual, visuoperceptual and cognitive functions, to optimize care for pwMS. Visual, visuoperceptual and cognitive functions of 68 pwMS with visual complaints and 37 pwMS with no or minimal visual complaints were assessed. The frequency of functional decline was compared between the two groups and correlations were calculated between visual complaints and the assessed functions. Decline in several functions occurred more frequently in pwMS with visual complaints. Visual complaints may be an indication of declined visual or cognitive functioning. However, as most correlations were not significant or weak, we cannot infer that visual complaints are directly related to functions. The relationship may be indirect and more complex. Future research could focus on the overarching cognitive capacity that may contribute to visual complaints. Further research into these and other explanations for visual complaints could help us to provide appropriate care for pwMS.
Introduction
Multiple sclerosis (MS) is a progressive demyelinating and neurodegenerative disease that can affect the entire central nervous system (Compston & Coles, Citation2008). Besides for instance the motor, cognitive or autonomic system, the visual system can be affected by MS. In a recent study, we showed that the prevalence of visual complaints in people with MS (pwMS) is high and that pwMS report a wide variety of visual complaints (van der Feen et al., Citation2022). Some of the commonly reported complaints were being blinded by bright light, needing more time to see something, needing more light, difficulty focusing and changes in the visual field (van der Feen et al., Citation2022).
Decline of visual functions can develop both along the efferent and afferent visual pathways in pwMS. Abnormalities in eye motility or eye movements occur in 40–76% of pwMS (Costello, Citation2016) and mainly originate from lesions in the brainstem (Frohman et al., Citation2005; Barnes & McDonald, Citation1992). These lesions can lead to internuclear ophthalmoplegia (INO), nystagmus, impairments of smooth pursuit, saccadic intrusions or dysmetria, ocular flutter, impairments in suppressing the vestibulo-ocular reflex (VOR) and impaired stereopsis (Barnes & McDonald, Citation1992; Frohman et al., Citation2005; Gil-Casas et al., Citation2021; Graves & Balcer, Citation2010; Tilikete et al., Citation2011). Besides impairments of eye movements, several other visual functions can be impaired to a certain extent in pwMS. Low contrast visual acuity, contrast sensitivity, colour vision, and visual field may be impaired in pwMS, even when they have no history of optical neuritis and a good visual acuity (Baier et al., Citation2005; Balcer et al., Citation2012; Mowry et al., Citation2009; Satue et al., Citation2016; Sisto et al., Citation2005). Moreover, it is estimated that 26% of pwMS show visuoperceptual impairments, such as difficulties with object perception, visual spatial perception and visual memory (Vleugels et al., Citation2000; Chiaravalloti & Deluca, Citation2008).
In rehabilitation settings it is assumed that an extensive assessment of relevant functions forms the basis for the rehabilitation programme (Markowitz, Citation2006). Yet, it is currently unclear how visual complaints relate to decline of visual functions. On the one hand, vision-related quality of life in pwMS appears to be correlated with visual functions that are typically declined in pwMS, such as visual acuity, contrast sensitivity and eye movements (Mowry et al., Citation2009; Jasse et al., Citation2013; Ma et al., Citation2002). On the other hand, a recent study in a large cohort of pwMS found that disease duration and optic neuritis were not clearly related to self-reported visual complaints in pwMS (van der Feen et al., Citation2022). Moreover, previous literature shows that cognitive or health-related self-reported complaints may not always reflect impairments in pwMS, in various other clinical groups and in non-clinical groups (Baldwin et al., Citation2017; Burmeister et al., Citation2016; Cuevas et al., Citation2022; van der Hiele et al., Citation2012; Koerts et al., Citation2011; Koerts et al., Citation2012; Ma et al., Citation2002; Reid & McLullich, Citation2006; Scholz & Donders, Citation2022). These insights raise the question whether we have a clear understanding of the visual complaints pwMS report.
Therefore, the main objective of the present study is to explore the relation between the visual complaints and decline of visual or visuoperceptual functions to improve our understanding of visual complaints and to provide appropriate rehabilitation care. We also investigate how cognitive functions are related to visual complaints. Previous research points out that visual functioning may be related to cognition in pwMS (Wieder et al., Citation2013; Jakimovski et al., Citation2021). Not only the eyes, the optic nerves, the retinocortical system and the striate cortex are involved in visual perception, but also parts of the cortex that do not seem to be directly involved in visual perception (Portas et al., Citation2000; Vuilleumier & Driver, Citation2007). Due to the explorative nature of the study, we cautiously hypothesize that visual complaints may show a relationship with decline in visual functions, but that decline of these functions do not fully explain the presence and nature of visual complaints in pwMS.
A better understanding of the underpinnings of visual complaints may contribute to improving existing interventions or lead to the development of novel (neurovisual) interventions to reduce the symptoms, improve vision-related quality of life and support independent participation of pwMS in daily life.
Methods
Participants and procedure
See for a flowchart of the inclusion and data collection process. We included two groups of pwMS. In both groups, the nature of possible visual complaints and the frequency of occurrence was determined by the Screening Visual Complaints questionnaire (SVCq) (Huizinga et al., Citation2020).
Figure 1. Inclusion and data collection process in the referred group and control group. *SVCq: Screening Visual Complaints questionnaire (Huizinga et al., Citation2020). ‘Often/always’ and ‘sometimes’ refer to answer options on the SVCq. ‘Discomfort’ refers to the self-reported discomfort score on the SVCq. The SVCq was used twice. At the MSCNN the SVCq was used either to refer pwMS, or for the inclusion in the control group. The SVCq at Royal Dutch Visio was used to check inclusion criteria.
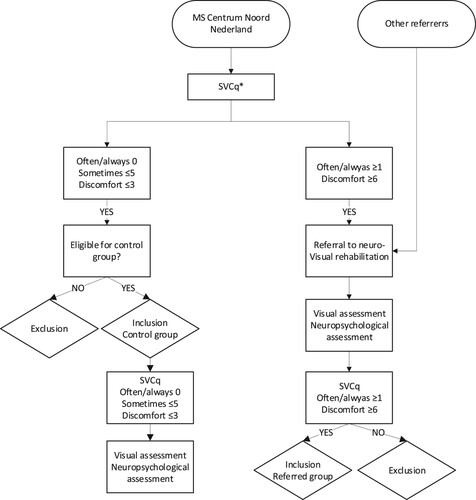
The first group, the referred group, consisted of pwMS who were referred for neurovisual rehabilitation to Royal Dutch Visio (North) after reporting visual complaints (July 2017 to December 2020). The majority of the participants were part of a cohort of pwMS from the MS Centrum Noord Nederland (MSCNN). During a regular consultation at the MSCNN pwMS completed the SVCq (Huizinga et al., Citation2020). People who reported at least one complaint as “often/always” or a discomfort score of ≥6 out of 10 on the SVCq were referred to Royal Dutch Visio. People referred from institutions other than the MSCNN (whose SVCq was not available at the time of referral) were also be included ().
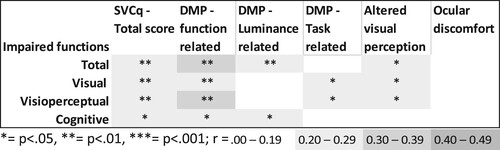
Figure 2. Strength and significance of the correlations between the number of declined functions and the total score and the scores on the subscales of the Screening visual complaints questionnaire.
Note: DMP: diminished visual perception SVCq; Screening Visual Complaints questionnaire.
The second group, the control group, consisted of pwMS with no or minimal visual complaints. These people were recruited exclusively from the MSCNN. People who reported no complaints as “often/always,” ≤ 5 complaints as “sometimes,” and a discomfort score of ≤3 on the SVCq were eligible for inclusion in the control group. People with severe comorbid ophthalmological, neurological or psychiatric conditions were excluded from participation in the control group.
All participants were assessed according to a pre-established protocol of examinations and tests at the same Visio location. The protocol consisted of a visual functions assessment and a neuropsychological assessment. For the referred group, the examinations and tests were part of their regular neurovisual rehabilitation programme. The control group received the tests and examinations only in the context of this study. Before the assessments, SVCq was administered to check if the inclusion criteria were still met. A participant’s first completed SVCq was used for data analysis. The assessments took approximately four hours and were performed by a trained orthoptist and neuropsychologist. Additional medical data were extracted from the patients’ medical files.
Ethics
The study was approved by the Medical Ethics Committee of the University Medical Center Groningen (NL62728.042.17). People in the referred group provided written consent for collecting and using data from the files of their rehabilitation programme for this study. The decision whether to provide consent or not had no influence on the rehabilitation programme. People in the control group gave written informed consent. If any abnormalities were detected during the assessments, the treating physician of the MSCNN was notified. All participants could withdraw their consent at any given time.
Materials
Visual complaints
The SVCq (Huizinga et al., Citation2020) was used to assess visual complaints. shows the 5 subscales and the corresponding items of the SVCq (van der Feen et al., Citation2022). Huizinga (Huizinga et al., Citation2020) showed that the SVCq has a satisfactory convergent and divergent validity, good internal consistency (Cronbach’s α = .85) and test-retest reliability (ICC = .82). The subscales also showed moderate to good internal consistencies (McDonald’s ω = .66–0.81). Ocular discomfort showed an internal consistency of .40 (Spearman’s Brown coefficient) (van der Feen et al., Citation2022). Respondents indicated the frequency of occurrence of each complaint (0 = “never/rarely,” 1 = “sometimes,” 2 = “often/always”). A total score and a score on each subscale was calculated by summing the item scores. At the end of the SVCq, people indicated their discomfort in daily life from these complaints on a scale from 0-10.
Table 1. The five subscales and the corresponding items of the screening visual complaints questionnaire (Huizinga et al., Citation2020; van der Feen et al., Citation2022).
Visual functioning
First a visual functions assessment was performed. presents the visual function tests and the corresponding conditions. For sensitivity of the monocular visual fields, the results of both eyes were assessed separately. Measurements with a false positive rate of ≥10% and a fixation loss rate of ≥20% without a clearly visible blind spot were considered unreliable, as well as visual fields with a clover leaf pattern or any artifacts. Unreliable results were excluded from the analyses. The desaturated D-15 Farnworth test was administered to see if there were any deficiencies in colour vision. In case no colour vision deficiencies were found, the desaturated D-15 Lanthony test was performed to assess more subtle colour discrimination deficiencies (Good et al., Citation2005). The orthoptist assessed the presence of convergence, nystagmus, optokinetic nystagmus (OKN) and VOR. To assess smooth pursuit, participants had to follow a light that moves horizontally and vertically (extending to approximately 40 degrees from the centre). To assess motility, the light moved in eight different directions. For the assessment of saccades, the orthoptist asked the participant to look at one of two objects, which were 40 cm apart horizontally and vertically. Nystagmus, stereopsis, binocular visual field, eye alignment and convergence were scored either 0 (not declined) or 1 (declined). Regarding the binocular visual field, it was assessed whether a participant showed any absolute scotoma or not. Monocular visual fields, colour vision and eye motility were scored 0 (no decline), 1 (declined in 1 eye) or 2 (declined in both eyes). OKN, smooth pursuit, VOR and saccades were scored 0 (no decline), 1 (declined either horizontally in leftward or rightward direction or vertically (upwards or downwards)) or 2 (declined in both directions).
Table 2. Visual functions assessment: tests, assessed functions, test conditions and criteria for declined function.
Optical coherence tomography
Second, optical coherence tomography (OCT) was performed for structural analysis of the retina, using a Canon OCT-HS100 (Canon OCT-HS100, Citation2013). For the left and right eye of the participants, the mean thickness of the retinal nerve fibre layer (RNFL), the ganglion cell layer (GCL) in the macular cube and the mean thickness of the optic disc RNFL were registered. In the analysis, we used the averaged value of an individual’s two eyes for all OCT measures. In some cases, a scan of only one of the eyes was made correctly (n = 6 for RNFL and GCL n = 4). Then, the value of the one correct scan was used in the analysis.
Visuoperceptual and cognitive functioning
Third, a neuropsychological assessment was performed. shows the tests and the visuoperceptual or cognitive functions that the tests aimed to assess. We made use of the DiaNAH-battery to assess visuoperceptual functions. The tests from the DiaNAH-battery (de Vries et al., Citation2018) were administered on a 24” Wacom tablet and were programmed by Metrisquare Diagnosis (www.diagnosis.com). The time taken to complete the task was registered for the Trail Making Test (TMT) A and B, the Bells Test and Taylor Complex Figure (TCF). For the other tests, a total score was registered. For the Corsi Block-Tapping Test (CBTT), the longest sequence was used as a total score. A percentile score or range of percentile scores was registered. In addition to assessing visual perception, global cognitive functioning was assessed. Except for the VTS (Schuhfried, Citation2013), these tests did not use visually presented materials. These tests were classified as cognition tests. In addition, we screened for depression and anxiety symptoms.
Table 3. Neuropsychological assessment: tests, associated domains and classification.
Data analysis
Frequencies of functional decline
To determine the frequency of decline in functions in the referred group (reporting visual complaints) and in the control group (reporting no or minimal visual complaints), performance on each test or examination was classified as either normal or declined in comparison with standard norms (see and for the classification criteria). Cut-offs included severe to mild functional decline. We chose cut-offs that include mild decline in functions over cut-offs that represent absolute functional disorders, to prevent overseeing mild decline present in both groups, that could help us understand visual complaints. We do not intend to report the number of people with a visual or cognitive impairment (<2SD).
For the visual functions, classification was either based on tests scores (visual acuity, contrast sensitivity, monocular visual field and colour vision), or in case of a clinical examination, on the assessment of the orthoptist. For the visuoperceptual and cognitive tests, scores on tests corresponding to <17th percentile (<1SD) compared to a healthy norm group, were considered to be declined. For several tests not a specific percentile, but only a range was available (Crowding Task, Dot Counting Task, Digit Span). The range closest to the 16th percentile was chosen as cut-off. Raw scores of >7 (mild depression or anxiety symptoms) on the two scales of the HADS (Hospital Anxiety Depression Scale) were classified as declined (Zigmond & Snaith, Citation1983; Bjelland et al., Citation2002). Because no normative data was available at the time of the study for the Birthday Party Test, this test was not included in this analysis.
The frequencies of declined visual, visuoperceptual and cognitive functions were calculated and compared between the referred and control group. Fisher’s exact test was used to test for statistical difference between the groups (α < 0.05). Phi effect sizes were calculated (small: 0.1-0.2, moderate: 0.2-0.40, large > 0.40) (Ferris et al., Citation1982).
Relations between visual complaints and visual, visuoperceptual and cognitive functions
First, the number of declined visual, visuoperceptual and cognitive functions was counted per individual in the total group (referred group and controls). Non-parametric partial correlations were calculated between the total score, scores on the subscales of the SVCq and the number of declined functions. Secondly, Spearman’s rank correlations were calculated between the scores of the SVCq and the scores on all tests. We used raw continuous scores where possible (visual acuity, contrast sensitivity and all scores of the neuropsychological assessment) or otherwise categorical scores.
Sample size, missing data and multiple testing
First, an a priori sample size calculation was performed and showed a minimal sample size of 40 for both groups. Not all participants could complete every test in the visual functions assessment or neuropsychological assessment due to time constraints, constraints due to covid-19, or when completion took too much effort from the participants. Furthermore, for some people who used a wheelchair, the visual field assessment could not be carried out. Therefore, the sample sizes of the analyses differ for the different functions. Individual analyses were performed for each function (pairwise deletion of missing values) to maximize sample sizes. Because of the explorative nature of the present study we did not want to risk overseeing mild decline that could help us understand visual complaints. We, therefore, did not formally apply Bonferroni corrections to minimize the chance of type I errors.
Results
In total, 93 pwMS were referred to Royal Dutch Visio (North). Participants who did not provide an informed consent (N = 21), or did not complete an SVCq (N = 4) were excluded from the analysis, resulting in a referred group with people who reported visual complaints of N = 68. Of the 184 people from the MSCNN that reported no or minimal visual complaints, 65 gave consent of which 37 people met all inclusion criteria. presents demographical and medical information of the referred group and the control group. The groups did not differ significantly on these variables.
Table 4. Demographical and medical information of the referred group and the control group.
Frequencies of functional decline
shows the test results and frequencies of functional decline (>1SD) in both groups. Decline in functions were found in all visual functions in the referred group, but not in the control group. Furthermore, all visual functions were more frequently declined in the referred group than in the control group. Sensitivity of the monocular visual field, visual acuity, nystagmus, OKN, colour vision and stereopsis were significantly more frequently declined in the referred group, with moderate effect sizes.
Table 5. Frequency of functional decline in the referred and control group, sorted by effect size.
Functional decline of visual perception and cognition were found in all tested domains in both the referred and the control group. Most, but not all visuoperceptual and cognitive functions were more frequently declined in the referred group, compared to the control group. With a moderate effect size, significantly more people in the referred group had declined scores on visuomotor speed (TMT B), visual load/crowding (Crowding Task), object perception (Silhouettes) and visual search (Dot Counting Task). Furthermore, declined motor speed (VTS S3 MT complex task) occurred more frequently in the referred group (moderate effect size). Depression and anxiety symptoms were also more frequently present in the referred group.
Relations between visual complaints and visual, visuoperceptual and cognitive functions
The strength and significance of the correlations between visual complaints (SVCq total score and the score on the subscales) and the visual, visuoperceptual and cognitive functions are summarized in . See the supplementary materials for a detailed overview of all correlations. In all cases, more complaints were associated with more functional decline.
shows that in general, people with more visual complaints also have a higher number of declined visual, visuoperceptual and cognitive functions. The total score and the score on the diminished visual perception – function related scale showed the highest correlation to functional decline. Correlations were sometimes moderate and mostly weak.
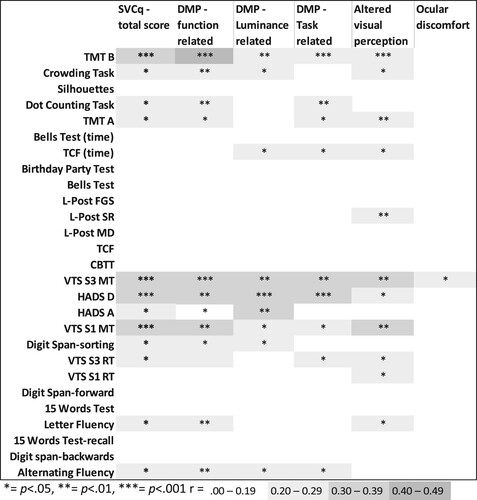
and show the correlations of the SVCq subscores with the individual visual, visuoperceptual and cognitive functions. While most correlations were non-significant and negligible, some weak to moderate correlations were found between the SVCq total score, the scores on the SVCq subscales and visual functions, visuoperceptual functions and cognitive functions. The diminished visual perception – function related scale showed several weak to moderate significant correlations with visual, visuoperceptual, and cognitive functions. This was also the case for the diminished perception – task related scale, but to a lesser extent. The diminished visual perception – luminance related scale and the altered visual perception scale primarily showed significant correlations with visuoperceptual and cognitive functions. The ocular discomfort scale hardly related to any visual, visuoperceptual or cognitive functions. Moreover, none of the subscales clearly related to either specific visual, visuoperceptual or cognitive functions. However, all subscales except for the ocular discomfort scale correlated with motor speed, visual motor speed, depression symptoms, sensitivity of the monocular visual field and peak contrast sensitivity (r = .467 to r = .285). These functions showed the strongest correlations with visual complaints.
Figure 3. Strength and significance of the correlations between visual functions and the total score and the scores on the subscales of Screening visual complaints questionnaire.
Note: DMP: diminished visual perception; OKN: optokinetic nystagmus; SVCq: Screening Visual Complaints questionnaire; VOR: vestibulo-ocular reflex.
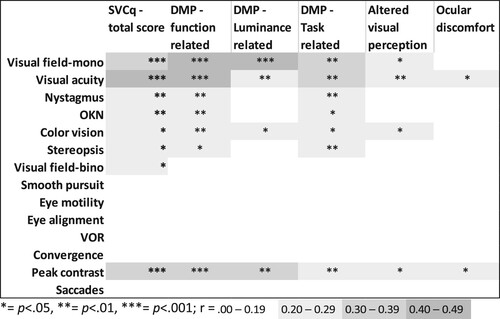
Figure 4. Strength and significance of the correlations between visuoperceptual fuctions, cognitive functions and emotional functioning, and the total score and the scores on the subscales of Screening visual complaints questionnaire.
Note: CBTT: Corsi Block Tapping Test; DMP: diminished visual perception; FGS: Figure Ground Segmentation; HADS: Hospital Anxiety and Depression Scale; L-Post: Leuven Perceptual organisation screening test; Motion Detection; MT: motor time; RT: reaction time; SR: shape ratio; TCF: Taylor Complex Figure; TMT: Trail Making Test VTS: Vienna Test System.
OCT
The SVCq scores did not correlate with any of the OCT variables, except for a positive moderate correlation between the ocular discomfort scale and the mean thickness of the disc (r = .330, p = .013).
Discussion
We explored the possible relations between visual complaints and visual, visuoperceptual and cognitive functions in order to better understand the visual complaints pwMS experience, with the aim of optimizing rehabilitation care.
The present study shows that pwMS with visual complaints more often had a decline in sensitivity of the monocular visual field(s), visual acuity, colour vision, OKN, nystagmus, and stereopsis than pwMS with no or minimal visual complaints. While this is in line with previous research showing that these visual function impairments are found in pwMS (Satue et al., Citation2016; Gil-Casas et al., Citation2021; Spinhoven et al., Citation1997; Nerrant & Tilikete, Citation2017; Felgueiras et al., Citation2016; Harrison et al., Citation1987; Castro et al., Citation2013; Cheng et al., Citation2007), decline in most of these functions were exclusively found in the group of pwMS with visual complaints. These visual functions may therefore contribute to visual complaints. Decline in smooth pursuit and saccades occurred frequently in the referred group with visual complaints and the control group without visual complaints, indicating that these functions do not play a decisive role in the occurrence of visual complaints.
Furthermore, although the frequency of people with a decline in a visuoperceptual function across the groups was not high, declined functions were present. While declined visuoperceptual functions were also present in pwMS with no or minimal visual complaints, pwMS with visual complaints more often appeared to have a declined visual motor speed, visual load (crowding effect), object perception and visual search. Declined cognitive functions were found relatively often in both groups and showed few significant differences between the groups. As expected, a large proportion of pwMS in both groups showed declined motor speed (Vleugels et al., Citation2000; Chiaravalloti & Deluca, Citation2008), but pwMS with visual complaints were significantly more likely to show declined motor speed (68% to 38%). This indicates that motor speed may contribute in the occurrence of visual complaints and help us understand the visual complaints.
The correlation analyses between visual complaints and the number of declined visual, visuoperceptual and cognitive functions showed that having more visual complaints is associated with a higher number of declined functions. Declined sensitivity of the monocular visual fields, depression, (visual) motor speed and contrast sensitivity showed relatively strong correlations with most types of complaints (all SVCq-scales except the ocular discomfort scale) and could be important contributors to visual complaints. However, correlations between visual complaints and visual, visuoperceptual and cognitive test performance were mostly negligible or weak, and did not indicate particular patterns of functional decline relating to specific types of complaints.
Thus, in line with our hypotheses visual, visuoperceptual and cognitive functions contribute to, but may not fully explain visual complaints and visual complaints cannot always be related one-to-one to specific visual, visuoperceptual or cognitive impairments. This is also in line with previous research that shows self-reported complaints do not fully reflect functional disabilities (Baldwin et al., Citation2017; Burmester et al., Citation2016; Cuevas et al., Citation2022; Freed et al., Citation2022; Reid & MacLullich, Citation2006; Scholz & Donders, Citation2022; van der Hiele et al., Citation2012).
Limitations
We are aware of some limitations in this study. The control group consisted of 37 pwMS, while an a priori power analysis recommended a sample size of at least 40 for both groups. A post hoc power analysis revealed acceptable power of the significant comparisons, but insignificant relationships often had a power below 0.80. We therefore might have overlooked relationships (type II error). A probable reason that we could not include a larger control group was that most pwMS in the cohort from the MSCNN, of which we recruited the controls, did not meet the inclusion criteria, because not many pwMS had no or minimal visual complaints (van der Feen et al., Citation2022). On the other hand, there was a relatively high chance that some of the found relations were significant only based on chance (type I error) because we did not formally apply a Bonferroni correction of the α-values. While our sample was not large, the sample was a good representation of a normal sample of pwMS. The results should therefore be generalizable to pwMS outside of the rehabilitation environment where the study took place. The results may provide important insights for other types of acquired brain injuries, but future research is needed to investigate the relation between visual complaints and impairments in other samples.
That not all people could complete the visual functions assessment or neuropsychological assessment may have caused some bias in our analyses. This was most often the case in the group of pwMS with visual complaints, who received the assessments for rehabilitation purposes. There may have been an underestimation of the number of declined functions in the referred group, because people who were not able to complete tests could be more disabled. On the other hand, there is currently no evidence that people who cannot complete certain tasks due to loss of strength in their arm, or because they are in a wheelchair are more likely to experience visual complaints: disability in terms of EDSS score (Kurtzke, Citation1983) due to MS does not seem to be related to visual complaints (van der Feen et al., Citation2022).
Some visual functions were assessed with different methods (stereopsis, contrast sensitivity and binocular visual fields). Different methods may not assess a function in the exact same way, even when the aim of the tests is to assess the same function. This was again especially the case in people who received the assessment during their rehabilitation programme. However, the frequencies in which a function was impaired did not differ between the tests.
For the correlation analyses, raw values of test scores were used wherever possible. We have to take into account that most of the tests in the neuropsychological assessment, but also the visual field measures, could have been influenced by age, sex and/or educational level. Moreover, when categorizing raw scores of the neuropsychological assessment into normal or impaired, normative data was used, but specific percentiles were not always available. The best possible categorization was always chosen. However, norms for the Crowding Task and Dot Counting Task were somewhat stricter (10th or 15th percentile), so the number of pwMS who had an impaired score could be an underestimation, compared to the other tests. The opposite was the case for the three subtests of the Digit Span, on which a slightly more lenient cut off was adopted (14th to 19th percentile).
Finally, people with severe neurological, ophthalmological and psychiatric disorders were only excluded in the control group. For the referred group this was not the case, because we chose to approach a clinically valid group. There were no severe psychiatric disorders in the referred group. In only five people of the referred group, such a neurological and/or ophthalmological disorder was present. This could have slightly altered the frequencies of declined functions in the referred group.
Future research
The results do show that in the presence of visual complaints, presence of declined visual, visuoperceptual or cognitive functions is likely. Therefore, self-reported visual complaints by pwMS on the SVCq may be interpreted as an indication of a lesion to the optic system or damage to a more distributed network of brain regions directly or indirectly involved in vision. However, due to the number of tests and minimal power of some of the analyses, we should be cautious drawing firm conclusions based solely on this exploratory, rather than experimental study. Nonetheless, we think this study may provide grounds for further research.
Firstly, further possible explanations that may lie beyond current visual rehabilitation assessments should be investigated. For example, depression and coping style. In our study, depression symptoms were related to visual complaints. This may be the case because people with depression symptoms are less likely to adopt an effective coping strategy when dealing with (visual) complaints in daily life (Berzins et al., Citation2017; Höhne et al., Citation2014). Research on the relationship between self-reported cognitive complaints and cognitive impairments points out that this relationship is influenced by anxiety, depression and personality traits (Baker et al., Citation2018; Brailean et al., Citation2019; Smit et al., Citation2021; van der Hiele et al., Citation2012). Moreover, the number of complaints itself could also lead to a lower quality of life and hence more depression or anxiety symptoms. In addition, the role of fatigue should be investigated. PwMS often show significant fatigue (Coghe et al., Citation2018; Krupp et al., Citation2010), which could also impact visual complaints, visual functioning and cognitive functioning. Moreover, our finding that a decreased sensitivity of monocular visual fields, depression, declined (visual) motor speed and decreased contrast sensitivity are important contributors to visual complaints may indicate that overall cognitive capacity of pwMS may help us understand the presence of visual complaints. Prior research points out that a decreased sensitivity of the monocular visual field (as opposed to absolute scotoma in the visual field), (visual) motor speed contrast sensitivity form an indication of overall cognitive capacity in pwMS (Wieder et al., Citation2013; Costa et al., Citation2017; Clough et al., Citation2020; Benedict et al., Citation2011; Forn et al., Citation2008). However, the thickness of the inner retina (RNFL, GCL, disc RNFL) did not correlate with visual complaints, while it is often associated with cognitive decline (Coric et al., Citation2018; Giedraitiene et al., Citation2021) and brain atrophy in pwMS (Baetge et al., Citation2021; Herrero et al., Citation2012; Saidha et al., Citation2015). Hence, we cannot conclude that cognitive decline explains visual complaints. A speculative, but nevertheless potentially interesting hypothesis for future research could be that for pwMS making sense of visual stimuli may be too demanding, especially when visual information is poorly received and inaccurately forwarded due to decline of visual functions, such as visual acuity or sensitivity of the visual field (Patoine et al., Citation2021; Gangeddula et al., Citation2017). Since vision may require a large proportion of our cognitive capacity, it might take too much effort when there is an impaired capacity. This lack of capacity may induce an inability to properly reconstruct a visual image. In pwMS, the slower processing speed potentially makes it even more demanding (Owsley & Mcgwin, Citation2010). This was also supported by our findings of impairments of visual load (Crowding Task), or impairments in making a quick overview of a large amount of visual information (Dot Counting Task) in pwMS with visual complaints. In addition, tests with a time constraint were more indicative of visual complaints in our study.
Conclusions
We found that while pwMS with visual complaints are more likely to show decline in visual, visuoperceptual or cognitive functions, the relationship between visual complaints and functions may not be one-to-one and may be more complex. Due to the explorative nature of this study, future research should further investigate the nature of the relation between visual complaints and visual functions. Additional explanations for visual complaints, such as depression, stress, coping style, fatigue or cognitive reserve should be investigated in order to take these possible contributors into account in the rehabilitation programme. Moreover, our hypothesis that overall cognitive capacity could be related to the presence of visual complaints in pwMS should be investigated. Future research could then focus more on developing rehabilitation strategies that are aimed at reducing visual complaints. Besides MS, this line of research could also include people with other types of neurological disorders who report visual complaints, such as people with stroke or Parkinson’s disease (van der Lijn et al., Citation2022).
Since pwMS with visual complaints reported on the SVCq (Huizinga et al., Citation2020; van der Feen et al., Citation2022) are likely to have some kind of decline in visual, visuoperceptual or cognitive functions, the assessment of certain functions can provide support in designing a tailored rehabilitation programme. Such assessments can be used to gain a better understanding of the complaints, to provide insights in which functions should be taken into account during the rehabilitation programme and to determine intact functions. However, our advice for current rehabilitation practice is to base referral and the subsequent rehabilitation programme not only merely on functional impairment, but also on an individual’s visual complaints. Rehabilitation goals should be aimed at reducing those complaints or the impact of those complaints in daily life.
Supplementary_materials.docx
Download MS Word (26.3 KB)Acknowledgements
We would like to express our gratitude to all participants, the research assistants and healthcare professionals for their support in this project.
Disclosure statement
No potential conflict of interest was reported by the author(s).
Correction Statement
This article has been corrected with minor changes. These changes do not impact the academic content of the article.
Additional information
Funding
References
- Baetge, S. J., Dietrich, M., Filser, M., Renner, A., Stute, N., Gasis, M., Weise, M., Lepka, K., Graf, J., Goebels, N., Hartung, H.-P., Aktas, O., Meuth, S., Albrecht, P., & Penner, I.-K. (2021). Association of retinal layer thickness with cognition in patients with multiple sclerosis. Neurology - Neuroimmunology Neuroinflammation, 8(4), e1018. https://doi.org/10.1212/NXI.0000000000001018
- Baier, M. L., Cutter, G. R., Rudick, R. A., Miller, D., Cohen, J. A., Weinstock-Guttman, B., Mass, M., & Balcer, L. J. (2005). Low-contrast letter acuity testing captures visual dysfunction in patients with multiple sclerosis. Neurology, 64(6), 992–995. https://doi.org/10.1212/01.WNL.0000154521.40686.63
- Baker, K. S., Gibson, S. J., Georgiou-Karistianis, N., & Giummarra, M. J. (2018). Relationship between self-reported cognitive difficulties, objective neuropsychological test performance and psychological distress in chronic pain. European Journal of Pain, 22(3), 601–613. https://doi.org/10.1002/ejp.1151
- Balcer, L. J., Galetta, S. L., Polman, C. H., Eggenberger, E., Calabresi, P. A., Zhang, A., Scanlon, J. V., & Hyde, R. (2012). Low-contrast acuity measures visual improvement in phase 3 trial ofnatalizumab in relapsing MS. Journal of the Neurological Sciences, 318(1–2), 119–124. https://doi.org/10.1016/j.jns.2012.03.009
- Baldwin, J. N., McKay, M. J., Hiller, C. E., Moloney, N., Nightingale, E. J., & Burns, J. (2017). Relationship between physical performance and self-reported function in healthy individuals across the lifespan. Musculoskeletal Science & Practice, 30, 10–17. doi:10.1016/J.MSKSP.2017.05.001
- Barnes, D., & McDonald, W. I. (1992). The ocular manifestations of multiple sclerosis. 2. Abnormalities of eye movements. Journal of Neurology, Neurosurgery & Psychiatry, 55(10), 863–868. https://doi.org/10.1136/jnnp.55.10.863
- Benedict, R. H. B., Holtzer, R., Motl, R. W., Foley, F. W., Kaur, S., Hojnacki, D., & Weinstock-Guttman, B. (2011). Upper and lower extremity motor function and cognitive impairment in multiple sclerosis. Journal of the International Neuropsychological Society, 17(4), 643–653. https://doi.org/10.1017/S1355617711000403
- Berzins, S. A., Bulloch, A. G., Burton, J. M., Dobson, K. S., Fick, G. H., & Patten, S. B. (2017). Determinants and incidence of depression in multiple sclerosis: A prospective cohort study. Journal of Psychosomatic Research, 99, 169–176. https://doi.org/10.1016/j.jpsychores.2017.06.012
- Bjelland, I., Dahl, A. A., Haug, T. T., & Neckelmann, D. (2002). The validity of the hospital anxiety and depression scale: An updated literature review. Journal of Psychosomatic Research, 52(2), 69–77. https://doi.org/10.1016/s0022-3999(01)00296-3
- Brailean, A., Steptoe, A., Batty, G. D., Zaninotto, P., & Llewellyn, D. J. (2019). Are subjective memory complaints indicative of objective cognitive decline or depressive symptoms? Findings from the English longitudinal study of ageing. Journal of Psychiatric Research, 110, 143–151. https://doi.org/10.1016/j.jpsychires.2018.12.005
- Burmester, B., Leathem, J., & Merrick, P. (2016). Subjective cognitive complaints and objective cognitive function in aging: A systematic review and meta-analysis of recent cross-sectional findings. Neuropsychology Review, 26(4), 376–393. https://doi.org/10.1007/s11065-016-9332-2
- Canon OCT-HS100. (2013). Amsterdam: Canon Europa N.V Medical Systems Division. https://www.cmi.sk/sites/default/files/oct-hs100.pdf
- Castro, S. M. C., Damasceno, A., Damasceno, B. P., De Vasconcellos, J. P., Reis, F., Iyeyasu, J. N., & Carvalho, K. M. d. (2013). Visual pathway abnormalities were found in most multiple sclerosis patients despite history of previous optic neuritis. Arquivos de Neuro-Psiquiatria, 71(7), 437–441. https://doi.org/10.1590/0004-282X20130058
- Cheng, H., Laron, M., Schiffman, J. S., Tang, R. A., & Frishman, L. J. (2007). The relationship between visual field and retinal nerve fiber layer measurements in patients with multiple sclerosis. Investigative Opthalmology & Visual Science, 48(12), 5798–5805. https://doi.org/10.1167/iovs.07-0738
- Chiaravalloti, N. D., & Deluca, J. (2008). Cognitive impairment in multiple sclerosis. The Lancet Neurology, 7(12), 1139–1151. https://doi.org/10.1016/S1474-4422(08)70259-X
- Clough, M., Dobbing, J., Stankovich, J., Ternes, A., Kolbe, S., White, O. B., & Fielding, J. (2020). Cognitive processing speed deficits in multiple sclerosis: Dissociating sensorial and motor processing changes from cognitive processing speed. Multiple Sclerosis and Related Disorders, 38, 101533. https://doi.org/10.1016/j.msard.2019.101522.
- Coghe, G., Corona, F., Marongiu, E., Fenu, G., Frau, J., Lorefice, L., Crisafulli, A., Galli, M., Concu, A., Marrosu, M. G., Pau, M., & Cocco, E. (2018). Fatigue, as measured using the modified fatigue impact scale, is a predictor of processing speed improvement induced by exercise in patients with multiple sclerosis: Data from a randomized controlled trial. Journal of Neurology, 265(6), 1328–1333. https://doi.org/10.1007/s00415-018-8836-5
- Compston, A., & Coles, A. (2008). Multiple sclerosis. The Lancet, 31(372), 1502–1517. https://doi.org/10.1016/S0140-6736(08)61620-7
- Coric, D., Balk, L. J., Verrijp, M., Eijlers, A., Schoonheim, M. M., Killestein, J., Uitdehaag, B. M., & Petzold, A. (2018). Cognitive impairment in patients with multiple sclerosis is associated with atrophy of the inner retinal layers. Multiple Sclerosis Journal, 24(2), 158–166. https://doi.org/10.1177/1352458517694090
- Costa, S. L., Genova, H. M., Deluca, J., & Chiaravalloti, N. D. (2017). Information processing speed in multiple sclerosis: Past, present, and future. Multiple Sclerosis Journal, 23(6), 772–789. https://doi.org/10.1177/1352458516645869
- Costello, F. (2016). Vision disturbances in multiple sclerosis. Seminars in Neurology, 36(2), 185–195. https://doi.org/10.1055/s-0036-1579692
- Cuevas, H., Danesh, V., & Henneghan, A. (2022). Self-reported cognitive function in persons with nonneurological chronic diseases: A systematic review. Journal of Aging Research, eCollection 2018:5803337. doi:10.1155/2022/5803337
- Dersu, I., Wiggins, M. N., Luther, A., Harper, R., & Chacko, J. (2006). Understanding visual fields, part I; goldmann perimetry. J Ophthalmic Med Technol, 2(2), 1–10.
- de Vries, S. M., Heutink, J., Melis-Dankers, B. J. M., Vrijling, A. C. L., Cornelissen, F. W., & Tucha, O. (2018). Screening of visual perceptual disorders following acquired brain injury: A delphi study. Applied Neuropsychology: Adult, 25(3), 197–209. https://doi.org/10.1080/23279095.2016.1275636
- Esterman, B. (1982). Functional scoring of the binocular field. Ophthalmology, 89(11), 1226–1234. https://doi.org/10.1016/s0161-6420(82)34647-3
- Farnsworth, D. (1957). The Farnsworth-Munsell 100-Hue test for the examination of color discrimination. Munsell Color Company, Inc.
- Felgueiras, H., Parra, J., Cruz, S., Pereira, P., Santos, A. F., Rua, A., Meira, D., Fonseca, P., Pedrosa, C., Cardoso, J. N., Almeida, C., Araújo, M., & Santos, E. (2016). Dyschromatopsia in multiple sclerosis patients: A marker of subclinical involvement? Journal of Neuro-Ophthalmology, 36(3), 275–279. https://doi.org/10.1097/WNO.0000000000000401
- Ferris, F. L., Kassoff, A., Bresnick, G. H., & Bailey, I. (1982). New visual acuity charts for clinical research. American Journal of Ophthalmology, 94(1), 91–96. https://doi.org/10.1016/0002-9394(82)90197-0
- Forn, C., Belenguer, A., Parcet-Ibars, M. A., & Avila, C. (2008). Information-processing speed is the primary deficit underlying the poor performance of multiple sclerosis patients in the paced auditory serial addition test (PASAT). Journal of Clinical and Experimental Neuropsychology, 30(7), 789–796. https://doi.org/10.1080/13803390701779560
- Freed, S. A., Sprague, B. N., & Ross, L. A. (2022). Does the association between objective and subjective memory vary by age among healthy older adults? Aging, Neuropsychology, and Cognition, 1–14. https://doi.org/10.1080/13825585.2022.2143471
- Frohman, E. M., Filippi, M., Stuve, O., Waxman, S. G., Corboy, J., Phillips, J. T., Lucchinetti, C., Wilken, J., Karandikar, N., Hemmer, B., Monson, N., De Keyser, J., Hartung, H., Steinman, L., Oksenberg, J. R., Cree, B. A. C., Hauser, S., & Racke, M. K. (2005). Characterizing the mechanisms of progression in multiple sclerosis - evidence and new hypotheses for future directions. Archives of Neurology, 62(9), 1345–1356. https://doi.org/10.1001/archneur.62.9.1345
- Gal, R. L. (2004). Visual function more than 10 years after optic neuritis: Experience of the optic neuritis treatment trial. American Journal of Ophthalmology, 137(1), 77–83. doi:10.1016/s0002-9394(03)00862-6
- Gangeddula, V., Ranchet, M., Akinwuntan, A. E., Bollinger, K., & Devos, H. (2017). Effect of cognitive demand on functional visual field performance in senior drivers with glaucoma. Frontiers in Aging Neuroscience, 9, 286. https://doi.org/10.3389/fnagi.2017.00286
- Giedraitiene, N., Drukteiniene, E., Kizlaitiene, R., Cimbalas, A., Asoklis, R., & Kaubrys, G. (2021). Cognitive decline in multiple sclerosis Is related to the progression of retinal atrophy and presence of oligoclonal bands: A 5-year follow-Up study. Frontiers in Neurology, 12, 939. https://doi.org/10.3389/fneur.2021.678735
- Gil-Casas, A., Piñero-Llorens, D. P., & Molina-Martin, A. (2021). Binocular vision in patients with multiple sclerosis. Clinical Optometry, 13, 39–49. https://doi.org/10.2147/OPTO.S286862
- Ginsburg, A. P. (1984). A new contrast sensitivity vision test chart. Optometry and Vision Science, 61(6), 403–407. https://doi.org/10.1097/00006324-198406000-00011
- Good, G., Schepler, A., & Nichols, J. (2005). The reliability of the Lanthony desaturated D-15 test. Optometry and Vision Science, 82(12), 1054–1059. https://doi.org/10.1097/01.opx.0000192351.63069.4a
- Graves, J., & Balcer, L. J. (2010). Eye disorders in patients with multiple sclerosis: Natural history and management. Clin Ophthalmol. Dove Press, 4, 1409–1422. https://doi.org/10.2147/OPTH.S6383
- Harrison, A. C., Becker, W. J., & Stell, W. K. (1987). Colour vision abnormalities in multiple sclerosis. Canadian Journal of Neurological Sciences / Journal Canadien des Sciences Neurologiques, 14(3), 279–285. https://doi.org/10.1017/S0317167100026615
- Heijl, A. (1985). The humphrey field analyzer, construction and concepts. In A. Heijl, & E. L. Greve (Eds.), Sixth international visual field symposium. Documenta ophthalmologica proceedings series (Vol. 42, pp. 77–84). Springer. https://doi.org/10.1007/978-94-009-5512-7_10.
- Herrero, R., Garcia-Martin, E., Almarcegui, C., Ara, J. R., Rodriguez-Mena, D., Martin, J., Otin, S., Satue, M., Pablo, L. E., & Fernandez, F. J. (2012). Progressive degeneration of the retinal nerve fiber layer in patients with multiple sclerosis. Investigative Opthalmology & Visual Science, 53(13), 8344–8349. https://doi.org/10.1167/iovs.12-10362
- Höhne, N., Poidinger, M., Merz, F., Pfister, H., Brückl, T., Zimmermann, P., Uhr, M., Holsboer, F., & Ising, M. (2014). Increased HPA axis response to psychosocial stress in remitted depression: The influence of coping style. Biological Psychology, 103, 267–275. https://doi.org/10.1016/j.biopsycho.2014.09.008
- Huizinga, F., Heutink, J., de Haan, G. A., van der Lijn, I., van der Feen, F. E., Vrijling, A. C. L., Melis-Dankers, B. J. M., de Vries, S. M., Tucha, O., & Koerts, J. (2020). The development of the screening of visual complaints questionnaire for patients with neurodegenerative disorders: Evaluation of psychometric features in a community sample. PLoS One, 15(4), e0232232. https://doi.org/10.1371/journal.pone.0232232
- Jakimovski, D., Benedict, R. H. B., Weinstock-Guttman, B., Ozel, O., Fuchs, T. A., Lincoff, N., Bergsland, N., Dwyer, M. G., & Zivadinov, R. (2021). Visual deficits and cognitive assessment of multiple sclerosis: Confounder, correlate, or both? Journal of Neurology, 268(7), 2578–2588. https://doi.org/10.1007/s00415-021-10437-5
- Jasse, L., Vukusic, S., Durand-Dubief, F., Vartin, C., Piras, C., Bernard, M., Pélisson, D., Confavreux, C., Vighetto, A., & Tilikete, C. (2013). Persistent visual impairment in multiple sclerosis: Prevalence, mechanisms and resulting disability. Multiple Sclerosis Journal, 19(12), 1618–1626. https://doi.org/10.1177/1352458513479840
- Koerts, J., Tucha, L., Leenders, K. L., Van Beilen, M., Brouwer, W. H., & Tucha, O. (2011). Subjective and objective assessment of executive functions in Parkinson’s disease. Journal of the Neurological Sciences, 310(1–2), 172–175. doi:10.1016/J.JNS.2011.07.009
- Koerts, J., van Beilen, M., Leenders, K. L., Brouwer, W. H., Tucha, L., & Tucha, O. (2012). Complaints about impairments in executive functions in Parkinson’s disease: the association with neuropsychological assessment. Parkinsonism & Related Disorders, 18(2), 194–197. doi:10.1016/J.PARKRELDIS.2011.10.002
- Kooijman, A. C., Stellingwerf, N., van Schoot, E. A. J., Cornelissen, F. W., & van der W, G. J. (1994). Groningen edge contrast chart (GECKO) and glare measurements. In A.C. Kooijman, P.L. Looijestijn, J.A. Welling, & G.J. VanDerWildt (Eds.), Low vision: Research and new developments in rehabilitation (pp. 101–110). Amsterdam: IOS Press.
- Krupp, L. B., Serafin, D. J., & Christodoulou, C. (2010). Multiple sclerosis-associated fatigue. Expert Review of Neurotherapeutics, 10(9), 1437–1447. https://doi.org/10.1586/ern.10.99
- Kurtzke, J. F. (1983). Rating neurologic impairment in multiple sclerosis: An expanded disability status scale (EDSS). Neurology, 33(11), 1444–1452. https://doi.org/10.1212/wnl.33.11.1444
- Lang, J. (1983). A new stereotest. Journal of Pediatric Ophthalmology & Strabismus, 20(2), 72–74. https://doi.org/10.3928/0191-3913-19830301-08
- Lanthony, P. (1978). The desaturated panel D-15. Documenta Ophthalmologica, 46(1), 185–189. https://doi.org/10.1007/BF00174107
- Ma, S. L., Shea, J. A., Galetta, S. L., Jacobs, D. A., Markowitz, C. E., Maguire, M. G., & Balcer, L. J. (2002). Self-reported visual dysfunction in multiple sclerosis: New data from the VFQ-25 and development of an MS-specific vision questionnaire. American Journal of Ophthalmology, 133(5), 686–692. doi:10.1016/S0002-9394(02)01337-5
- Markowitz, S. N. (2006). Principles of modern low vision rehabilitation. Canadian Journal of Ophthalmology, 41(3), 289–312. https://doi.org/10.1139/I06-027
- Mowry, E. M., Loguidice, M. J., Daniels, A. B., Jacobs, D. A., Markowitz, C. E., Galetta, S. L., Nano-Schiavi, M. L., Cutter, G. R., Maguire, M. G., & Balcer, L. J. (2009). Vision related quality of life in multiple sclerosis: Correlation with new measures of low and high contrast letter acuity. Journal of Neurology, Neurosurgery & Psychiatry, 80(7), 767–772. https://doi.org/10.1136/jnnp.2008.165449
- Nerrant, E., & Tilikete, C. (2017). Ocular motor manifestations of multiple sclerosis. Journal of Neuro-Ophthalmology, 37(3), 332–340. https://doi.org/10.1097/WNO0000000000000507
- Owsley, C., & Mcgwin, G. (2010). Vision and driving. Vision Research, 50(23), 2348–2361. https://doi.org/10.1016/j.visres.2010.05.021
- Patoine, A., Mikula, L., Romero, S. M., Michaels, J., Keruzore, O., Chaumillon, R., Bernardin, D., & Faubert, J. (2021). Increased visual and cognitive demands emphasize the importance of meeting visual needs at all distances while driving. PLoS One, 16(3), e0247254. https://doi.org/10.1371/journal.pone.0247254
- Portas, C. M., Strange, B. A., Friston, K. J., Dolan, R. J., & Frith, C. D. (2000). How does the brain sustain a visual percept. Proc R Soc London Ser B Biol Sci., 267(1446), 845–850. https://doi.org/10.1098/rspb.2000.1080
- Reid, L. M., & MacLullich, A. M. J. (2006). Subjective memory complaints and cognitive impairment in older people. Dementia and Geriatric Cognitive Disorders, 22(5–6), 471–485. doi:10.1159/000096295
- Saan, R. J., & Deelman, B. (1986). 15-Woorden test A en B [15-word test A and B.] Handboekneuropsychologische diagnostiek. In A. Bouma, J. Mulder, J. Lindeboom, & B. Schmand (Eds.), Handbook neuropsychological assessment (2nd ed, pp. 267–282). Pearson Assessment and Information BV.
- Saidha, S., Al-Louzi, O., Ratchford, J. N., Bhargava, P., Oh, J., Newsome, S. D., Prince, J. L., Pham, D., Roy, S., van Zijl, P., Balcer, L. J., Frohman, E. M., Reich, D. S., Crainiceanu, C., & Calabresi, P. A. (2015). Optical coherence tomography reflects brain atrophy in multiple sclerosis: A four-year study. Annals of Neurology, 78(5), 801–813. https://doi.org/10.1002/ana.24487
- Satue, M., Rodrigo, M. J., Otin, S., Bambo, M. P., Fuertes, M. I., Ara, J. R., Martin, J., Polo, V., Larossa, J.M., Pablo, L., Garcia-Martin, E., et al. (2016). Relationship between visual dysfunction and retinal changes in patients with multiple sclerosis. PloS One, 11(6), e0157293. https://doi.org/10.1371/jounral.pone.0157293
- Schmand, B., Groenink, S. C., & Van Den Dungen, M. (2008). Letterfluency: Psychometric properties and Dutch normative data. Tijdschrift Voor Gerontologie en Geriatrie, 39(2), 64–74. https://doi.org/10.1007/BF03078128
- Scholz, M. P., & Donders, J. (2022). Cognitive complaints in older adults: Relationships between self and informant report, objective test performance, and symptoms of depression. Neuropsychology, Development and Cognition. Section B, Neuropsychology and Cognition, 8, 1–16. doi:10.1080/13825585.2022.2144617, 1–16.
- Schuhfried, G. (2013). Vienna test system: Psychological assessment. Moedling. Schuhfried.
- Simons, K. (1981). A comparison of the frisby, random-Dot E, TNO, and randot circles stereotests in screening and office Use. Archives of Ophthalmology, 99(3), 446–452. doi:10.1001/archopht.1981.03930010448011
- Sisto, D., Trojano, M., Vetrugno, M., Trabucco, T., Iliceto, G., & Sborgia, C. (2005). Subclinical visual involvement in multiple sclerosis: A study by MRI, VEPs, frequency-doubling perimetry, standard perimetry, and contrast sensitivity. Investigative Opthalmology & Visual Science, 46(4), 1264–1268. https://doi.org/10.1167/iovs.03-1213
- Smit, D., Koerts, J., Bangma, D. F., Fuermaier, A. B. M., Tucha, L., & Tucha, O. (2021). Look who is complaining: Psychological factors predicting subjective cognitive complaints in a large community sample of older adults. Applied Neuropsychology: Adult, 1–15. https://doi.org/10.1080/23279095.2021.2007387
- Spinhoven, P., Ormel, J., Sloekers, P. P. A., Kempen, G. I. J. M., Speckens, A. E. M., & Van Hemert, A. M. (1997). A validation study of the hospital anxiety and depression scale (HADS) in different groups of Dutch subjects. Psychological Medicine, 27(2), 363–370. https://doi.org/10.1017/S0033291796004382
- Tilikete, C., Jasse, L., Vukusic, S., Durand-Dubief, F., Vardanian, C., Pélisson, D., & Vighetto, A. (2011). Persistent ocular motor manifestations and related visual consequences in multiple sclerosis. Annals of the New York Academy of Sciences, 1233(1), 327–334. https://doi.org/10.1111/j.1749-6632.2011.06116.x
- van der Feen, F. E., de Haan, G. A., van der Lijn, I., Fuermaier, A. B. M., Heersema, T. J., Meilof, J. F., & Heutink, J. (2022). Confirmatory factor analysis of the Dutch screening visual complaints questionnaire in people with multiple sclerosis. Journal of Patient-Reported Outcomes, 6(1), 1–6. https://doi.org/10.1186/s41687-022-00443-0
- van der Feen, F. E., de Haan, G. A., van der Lijn, I., Huizinga, F., Meilof, J. F., Heersema, D. J., & Heutink, J. (2022). Recognizing visual complaints in people with multiple sclerosis: Prevalence, nature and associations with key characteristics of MS. Multiple Sclerosis and Related Disorders, 57, 103429. https://doi.org/10.1016/j.msard.2021.103429.
- van der Hiele, K., Spliethoff-Kamminga, N. G. A., Ruimschotel, R. P., Middelkoop, H. A. M., & Visser, L. H. (2012). The relationship between self-reported executive performance and psychological characteristics in multiple sclerosis. European Journal of Neurology, 19(4), 562–569. doi:10.1111/J.1468-1331.2011.03538.X
- van der Lijn, I., de Haan, G. A., van der Feen, F. E., Huizinga, F., Fuermaier, A. B. M., van Laar, T., & Heutink, J. (2022). The screening visual complaints questionnaire (SVCq) in people with Parkinson’s disease—confirmatory factor analysis and advice for its use in clinical practice. PLoS One, 17(9), e0272559. https://doi.org/10.1371/journal.pone.0272559
- Vleugels, L., Lafosse, C., van Nunen, A. n., Nachtergaele, S., Ketelaer, P., Charlier, M., Vandenbussche, E., et al. (2000). Visuoperceptual impairment in multiple sclerosis patients diagnosed with neuropsychological tasks. Multiple Sclerosis Journal, 6(4), 241–254. https://doi.org/10.1177/135245850000600406
- Vuilleumier, P., & Driver, J. (2007). Modulation of visual processing by attention and emotion: Windows on causal interactions between human brain regions. Philosophical Transactions of the Royal Society B: Biological Sciences, 362(1481), 837–855. https://doi.org/10.1098/rstb.2007.2092
- Walraven, J. (1975). Amblyopia screening with random-Dot stereograms. American Journal of Ophthalmology, 80(5), 893–900. doi:10.1016/0002-9394(75)90286-x
- Wechsler, D. (2008). Wechsler adult intelligence scale-4th ed. Pearson.
- Wieder, L., Gäde, G., Pech, L. M., Zimmermann, H., Wernecke, K.-D., Dörr, J.-M., Bellmann-Strobl, J., Paul, F., & Brandt, A. U. (2013). Low contrast visual acuity testing is associated with cognitive performance in multiple sclerosis: A cross-sectional pilot study. BMC Neurology, 13(1), 167. https://doi.org/10.1186/1471-2377-13-167
- Zigmond, A., & Snaith, R. (1983). The hospital anxiety and depression scale. Acta Psychiatrica Scandinavica, 67(6), 361–370. https://doi.org/10.1111/j.1600-0447.1983.tb09716.x