
 ?Mathematical formulae have been encoded as MathML and are displayed in this HTML version using MathJax in order to improve their display. Uncheck the box to turn MathJax off. This feature requires Javascript. Click on a formula to zoom.
ABSTRACT
The study analyzed the current status and changing trends of PM2.5 pollution, and used Kriging spatial interpolation, spatial autocorrelation analysis, and scan statistics to explore the spatiotemporal characteristics and identify hotspots. The results showed that PM2.5 pollution during 2015–2019 displayed a downward trend year by year, with a pronounced seasonal difference of higher concentrations in winter and lower concentrations in summer. By 2019, there were still 110 cities (n = 194) failed to meet China’s annual grade II air quality standard (35 μg/m3). The spatial distribution of PM2.5 was characterized by marked heterogeneity, with a significant spatial dependence and clustering characteristics. The pollution hotspots of PM2.5 were mainly concentrated in eastern and central China, especially in the Beijing-Tianjin-Hebei region and its surrounding area. The results of this study will assist Chinese authorities in developing strategies for preventing and controlling air pollution, especially in hotspot regions and during peak periods.
KEYWORDS:
Introduction
China has been experiencing rapid economic growth since the late 1970s. The growing economy has accelerated the process of urbanization and industrialization in China, but at the same time it has been accompanied by high levels of energy consumption that have caused serious air pollution in Chinese cities (Xiao et al. Citation2020).The primary pollutant that affects urban air quality is fine particulate matter (PM2.5) (Wang et al. Citation2014). The term PM2.5 refers to particles with an aerodynamic diameter of less than 2.5 μm. Fine particulate matter can remain suspended in the atmosphere for a long time due to its small particle size, enabling it to be transported over long distances. This can result in reduced atmospheric visibility, which has safety implications for travel (Ye et al. Citation2018). In 2016, 235 of 338 cities failed to meet the annual PM2.5 grade II standard (35 μg/m3) of the Chinese Ambient Air Quality Standards (CAAQS) GB 3095–2012 (MEP Citation2012a; Ye et al. Citation2018). In addition, many studies have shown that high PM2.5 concentrations have harmful effects on the health of residents, especially for lung diseases (Guo et al. Citation2020). There is also a significant impact on the incidence of cardiovascular and cerebrovascular diseases. Every 10 μg/m3 increase in the PM2.5 concentration increases the risk of stroke by 13%, and the number of people hospitalized for cardiovascular diseases in the following 24 h will increase by 0.26% (Huang et al. Citation2019; Li et al. Citation2020). Therefore, PM2.5 pollution has attracted widespread attention from the public as well as scientific researchers and policy makers worldwide. The Chinese central government proposed specific targets for improving air quality in the ‘12th Five-Year Plan’ in 2012, including reductions in air pollutant concentrations, industrial smoke and dust emissions, and volatile organic compound (VOC) emissions (MEE Citation2012). Current pollution control policies include the phasing out of heavily polluting vehicles, continuously reducing the proportion of energy generated by coal combustion, and providing cleaner energy sources. In addition, at the end of 2012, China established a national air quality monitoring network, and in 2013 China began nationwide near-surface monitoring of PM2.5. The Ministry of Environmental Protection (MEP) has subsequently released PM2.5 monitoring data to the public in accordance with a new set of AQSs.
Fine particulate matter not only causes serious air pollution, but also affects the travel safety and physical health of urban residents, and therefore PM2.5 pollution has attracted increasing attention. Previous studies of air pollution, and especially PM2.5, in China have generally focused on spatiotemporal distribution (Shen et al. Citation2020), chemical composition (Xu et al. Citation2019), source allocation (Xu et al. Citation2019), and health effects (Guo et al. Citation2020). The temporal and spatial characteristics of the PM2.5 concentrations can be used as an important reference for emission reduction measures. Studies of the physical and chemical processes of air quality and the corresponding health risks require long-term air pollution data with high temporal and spatial resolution (Wang et al. Citation2014). However, most existing studies of the spatiotemporal distribution of PM2.5 pollution are mainly based on specific cities or regions, such as Beijing (Zhang et al. Citation2020), Lanzhou (Filonchyk and Yan Citation2018), the North China Plain (Si et al. Citation2019), the Beijing-Tianjin-Hebei region (Yan et al. Citation2018), and the Yangtze River Delta region (Yang et al. Citation2020a), and have a relatively small data range. Studies of PM2.5 pollution have been gradually expanded to a medium and large scale. The trends of PM2.5 pollution across the country have also been largely researched over short time scales (Huang et al. Citation2018; Ye et al. Citation2018) and through the use of statistical models (Chen et al. Citation2018b; Xiao et al. Citation2020). A study using PM2.5 grid data found that spatial patterns of PM2.5 in China remained stable from 2001 to 2010, according to national long-term data (Lin et al. Citation2014). In addition, most previous studies have used PM2.5 data obtained from remote sensing before 2015, which were possibly affected by the open-access air pollution data published by the MEP and the historical scarcity of local environmental protection agencies (Peng et al. Citation2016; Lu et al. Citation2017). Compared with remote sensing inversion data, PM2.5 ground monitoring data are more reliable and accurate (Wang et al. Citation2019b). Using real-time nationwide PM2.5 monitoring data from 2014 to 2017, some studies have found an overall downward trend in PM2.5 pollution, although there was spatial variability (Li et al. Citation2018; Wang et al. Citation2019b). In recent years, Jiang et al. (Citation2020), Shen et al. (Citation2020), and Zhao et al. (Citation2020) also used PM2.5 ground monitoring data for multi-temporal and multi-spatial scale analysis, but it is rare for studies to consider the spatial and temporal distribution pattern of PM2.5 pollution from the perspective of spatiotemporal aggregation, and there is a need for more information on urban pollution characteristics.
Therefore, based on the data for 194 prefecture-level and above cities in China from 2015 to 2019, the long-term and recent trends of PM2.5 spatiotemporal patterns were analyzed in this study, with visual mapping conducted using a Geographic Information System (GIS). We also reported a detailed analysis of the changes in the PM2.5 AQS non-attainment rate from 2015 to 2019, which would enable the spatiotemporal dynamics and spatial heterogeneity of pollution to be better understood, so providing a scientific basis for formulating effective PM2.5 pollution prevention and control measures in the future.
Materials and methods
Study areas and data
The Chinese mainland was chosen as the study area, including 31 provinces, autonomous regions and municipalities, but not Hong Kong, Macao, and Taiwan. The study data were derived from the PM2.5 monitoring data of 194 prefecture-level and above cities (prefecture-level cities, leagues, and municipalities) across the country from 1 January 2015 to 31 December 2019, which were collected from the National Urban Air Quality Real-time Release Platform released by the China National Environmental Monitoring Center (CNEMC Citation2020). The platform updates monitoring data daily and is open to the public.
Data quality control was conducted to ensure that the minimum requirements of the CAAQS GB 3095–2012 for the validity of PM2.5 concentration data were met (MEP Citation2012a). When calculating the daily average value, data with less than 20 h of average concentration values per day were deleted, and when calculating the monthly average, data with less than 27 daily average concentration values per month (25 in February) were deleted. When calculating the annual average value, data with less than 324 daily average concentration values per year were deleted. At the same time, missing data and outliers in each process were deleted. Through the above processing, PM2.5 monitoring data for 194 cities in China were finally obtained. The geographical locations of 194 cities is shown in Figure S1. The annual grade II AQS for PM2.5 was 35 μg/m3 and the 24-h grade II AQS was 75 μg/m3 according to the CAAQS GB 3095–2012. According to the Chinese Ambient Air Quality Index (AQI) Technical Regulations (MEP Citation2012b), PM2.5 concentrations levels can be classified into excellent, good, light pollution, moderate pollution, heavy pollution, and severe pollution, with daily average concentration ranges of 0–35 μg/m3, 35–75 μg/m3, 75–115 μg/m3, 115–150 μg/m3, 150–250 μg/m3, and 250 μg/m3 or more, respectively. The 12 months of the year were divided into four seasons: spring (March, April, May), summer (June, July, August), autumn (September, October, November), and winter (December, January, February).
Spatial interpolation method
The distribution of environmental monitoring sites in China is not uniform due to human and material resources. It was found that PM2.5 concentrations had a significant spatial dependence in the study region, and therefore spatial interpolation was used to effectively solve this problem (Wang et al. Citation2019b). Kriging interpolation is considered to be the best spatial interpolation method. The interpolation results have no bias and minimum variance, and the accuracy is higher than remote sensing inversion data (Wang et al. Citation2019b). The basic principle of Kriging spatial interpolation is to estimate the value of unknown points from adjacent data, enabling the accurate simulation of the complete spatial distribution of PM2.5 concentrations in the study area. A Kriging spatial interpolation method was applied in this study. Using PM2.5 annual average concentration data for 194 cities in China from 2015 to 2019, a spherical semi-variogram model was constructed by ArcGIS 10.2 software, with 12 interpolation points. Finally, a nationwide visualized spatial distribution map was generated.
Spatial autocorrelation analysis
A, spatial autocorrelation analysis was conducted using Geoda 1.14 software, to explore the similarity or correlation of PM2.5 spatial proximity observation results (Jin et al. Citation2017; Wang et al. Citation2019a; Zhang et al. Citation2020). A global spatial autocorrelation was used to describe the degree of spatial correlation of PM2.5 in the whole study area, with the global Moran’s I used as the statistical index. The Moran’s I was calculated using the following formula
where, n is the total number of study areas; is the sum of all the elements in the spatial weights matrix W, with a value of 1 only when i and j are adjacent, otherwise it is 0; and
and
are the observed values of location or region i and j, respectively. Moran’s I varies from −1 to 1. The closer the value is to 1 the stronger the correlation, while a value of 0 indicates spatial randomness. Its statistical significance is determined by the P value of the standardized Z value. The P value is set to 0.05. The formula for the calculation of Z is as follows:
where, E(I) is the expected value of Moran’s I and Var(I) is the variance of Moran’s I.
A local spatial autocorrelation further determined the specific location and distribution pattern of local spatial clustering. The local Moran’s I was represented by local indicators of spatial association (LISA), which was calculated as follows:
A local spatial autocorrelation analysis can detect four cluster types with statistical significance: high-high clusters (high-incidence areas enclosed by high incidence areas); high-low clusters (high-incidence areas enclosed by low-incidence areas); low-high clusters (low-incidence areas enclosed by high-incidence areas); and low-low clusters (low-incidence areas enclosed by low-incidence areas). The results were visualized in ArcGIS10.2 software.
Scan statistics
The scan statistics were performed separately with the SaTScan™ 9.5 software using a scanning window to identify the high incidence areas of PM2.5 pollution (Kulldorff et al. Citation2009). The size and location of the scanning window can change dynamically, and the window can move spatially and/or temporally. The purely temporal, purely spatial, and spatial-temporal scanning windows were determined by a period of time; a round or oval window; which corresponded to geographical regions; and a cylindrical window with a round or oval geographical base and a height that corresponded to time, respectively. The null hypothesis was that all monthly average PM2.5 concentrations inside and outside the window belonged to the same population, while the opposite hypothesis was that the average value inside the window was higher than that outside the window. In the scan statistics, we calculated the log likelihood ratio (LLR) used to estimate the likelihood of a cluster according to the actual and theoretical monthly average PM2.5 concentrations inside and outside the window. Thus, the cluster with the maximum LLR value was regarded as the most likely cluster, and the other clusters with statistically significant LLR values were secondary clusters, which were sorted according to their LLR values. This study was based on the normal distribution model, and the specific parameters were set as follows: 20% of all monthly average PM2.5 concentrations was the size of the maximum window, 50% of the study period was the size of the maximum time cluster, and the P value was calculated based on the permutation Monte Carlo method to evaluate the statistical significance of clustering, which was set to 0.05. The repetition number was 9999.
Statistical software
A descriptive statistical analysis was conducted using SPSS 25.0 and Excel 2010 software. A spatial analysis (spatial autocorrelation analysis and scan statistics) was performed using the Geoda 1.14 software and SaTScan™ 9.5 software. The ArcGIS 10.2 software was used for the Kriging spatial interpolation and to visualize the spatial analysis results. The statistical significance was set to P < 0.05, with a two-sided P value.
Results
The PM2.5 pollution status
The annual average PM2.5 concentrations of 194 cities at the prefecture level and above in China from 2015 to 2019 decreased year by year, with a total rate of decrease of 26.42%. The minimum rate of decrease was in 2017 (2.08%) and the largest rate of decrease was in 2018 (14.89%), but the annual average PM2.5 concentration in 2019 was still 1.11 times China’s class II AQS (35 μg/m3) (Table S1). The PM2.5 pollution levels displayed a clear seasonality, showing a distinct pattern of high concentrations in winter and low concentrations in summer, and in the middle of spring and autumn. There was also a regularity in the monthly distribution of PM2.5 pollution with a ‘U’-shaped change in the gradual decline from January to May, stable levels from June to September, and a gradual increase from October to December (Figure S2(a)).
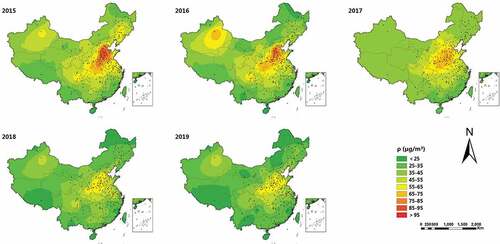
In the spatial analysis, the geographical distribution of the PM2.5 annual average concentration from 2015 to 2019 was obtained by a Kriging spatial interpolation method (). shows that the spatial distribution of PM2.5 pollution was heterogenous, but the distribution pattern in two large regions of Xinjiang and east of the Hu Line did not change significantly. The polluted areas were mainly located at the intersection of the eastern section of the Hu Line and the northern Yangtze River, and were especially prominent in the highly-polluted northern urban clusters in Hebei, Henan, Shanxi, and Shandong provinces. Compared with 2018 and 2019, PM2.5 pollution in China was more serious over a larger area from 2015 to 2017. The pollution hot spot in Xinjiang disappeared in 2017. In the period of 2018 and 2019, the severity of PM2.5 pollution declined significantly, the polluted area reduced annually, and the air quality displayed an improving trend.
Figure 1. Spatial distribution maps of PM2.5 concentrations in China during 2015–2019.
The PM2.5 AQS non-attainment rate
The average annual non-attainment rate of the PM2.5 AQS was calculated as the number of cities (non-attainment cities) whose annual average value exceeded the annual grade II AQS (35 μg/m3) as a proportion of the total number of cities. Similarly, the average daily non-attainment rate was calculated as the ratio of the number of days whose average daily value exceeded the corresponding 24-h grade II AQS (75 μg/m3) (the number of non-attainment days) to the total number of monitoring days in the year. Among the 194 cities in China, the number of non-attainment cities was found to have declined since 2015, but was still 110 (56.70%) in 2019. Although the average daily non-attainment rate increased slightly (0.25%) in 2017, it gradually decreased overall, and the concentration distribution interval gradually decreased from a high to low value (Table S2). As shown in Figure S2(b), the PM2.5 pollution was dominated by the light pollution class (67.35%). Compared with 2015, the proportion of heavy and severe pollution classes in 2019 declined by 52.92%.
The spatial distribution maps of PM2.5 for the period of 2015–2019 (Figure S3) indicated that the average daily non-attainment rate in the 194 cities had spatial differences, with most of the high non-attainment rate cities located in the Beijing-Tianjin-Hebei region and its surrounding area. From 2015 to 2019, the differences in PM2.5 pollution levels between cities narrowed year by year, and air quality also improved. However, in 2019, only 32.47% of all cities had an average daily non-attainment rate of less than 5%. The five cities with the highest average daily non-attainment rate within 5 years were Xingtai (48.80%), Handan (47.90%), Hengshui (47.18%), Liaocheng (47.12%), and Dezhou (47.01%), which were all located in southern Hebei and northwestern Shandong. The southeast coastal areas continued to maintain good air quality.
Spatial autocorrelation analysis
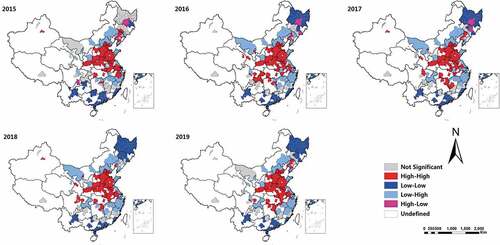
A spatial autocorrelation analysis was conducted based on panel data for the 194 prefecture level and above cities in China. shows that the global Moran’s I was greater than 0, P = 0.0001, indicating that there was a statistically significant positive spatial autocorrelation of PM2.5 during 2015–2019. The local spatial autocorrelation analysis identified many statistically significant spatial clusters. High-high clusters were the spatial hot spots in our research. The locations and regions of all hot spots did not change much each year and were distributed in 21 provinces that were mainly concentrated in eastern and central China, including Beijing, Tianjin, Hebei, Henan, Shandong, Anhui, Jiangsu, Shanxi, and Shaanxi, as shown in .
Table 1. Global spatial autocorrelation of PM2.5 in China, 2015–2019.
Figure 2. Local spatial autocorrelation cluster maps of PM2.5 in China, 2015 to 2019.
Cluster analysis
The purely spatial cluster diagram indicated that there were statistically significant spatial clusters of high-incidence areas of PM2.5 pollution from 2015 to 2019 ()). A total of one most likely cluster and five sub-clusters were detected by the purely spatial scan. It can be seen that the most likely cluster covered 25 cities (middle-east), all of which were concentrated in Hebei, Henan, Shandong, and Shanxi provinces, while the first sub-cluster only included Urumqi. In the second to fifth sub-clusters, the high incidence areas were located in southwest China, northeast China, middle-east China, and central China. The details of the clustering are listed in .
Table 2. Results for yearly spatial clusters of PM2.5 in China from 2015 to 2019.
Figure 3. The spatial and spatiotemporal clusters of PM2.5 in China, 2015–2019. (a) The spatial clusters of PM2.5. (b) The spatiotemporal clusters of PM2.5.
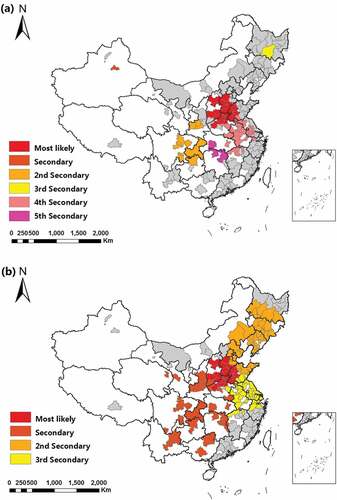
The purely temporal scan analysis identified that the temporal cluster of PM2.5 was from December 2016 to January 2017 (LLR = 30,834.33, P < 0.0001). Four statistically significant high-incidence clusters were identified through a spatiotemporal scan, covering a total of 133 cities, as shown in ) and . The most likely clustering occurred from January 2015 to February 2017, covering 25 cities (middle-east China), all located in the four provinces of Hebei, Henan, Shandong, and Shanxi. The sub-clusters (n = 36) from December 2016 to January 2017 were mainly located in western and central southern China. In the second and third sub-clusters, the high-risk spatiotemporal clusters were located in the northeast and north of east China, respectively.
Table 3. Results for spatiotemporal clusters of PM2.5 in China from 2015 to 2019.
Discussion
In this study, a descriptive statistical analysis of the PM2.5 concentrations in 194 prefecture level and above cities over the past 5 years was carried out, and changes in the non-attainment rate of the PM2.5 AQS were evaluated. The national PM2.5 pollution distribution was revealed through a Kriging spatial interpolation analysis. In addition, a spatial autocorrelation analysis and scan statistics were applied to detect the spatial-temporal changes and cluster characteristics of PM2.5, and identify geographical areas with a high pollution risk. The findings may help the formulation and implementation of public health intervention policies, reduce pollutant emissions, and effectively improve air quality in China.
From 2015 to 2019, the average annual PM2.5 concentration in cities decreased year by year (by 26.42%), and the average daily non-attainment rate also gradually decreased from a high to low value, indicating that the national emission reduction policy implemented by the Chinese government was extremely effective. The urban air quality in China improved year by year, which was consistent with the existing research results (Wang et al. Citation2019b; Jiang et al. Citation2020; Shen et al. Citation2020). Compared with 2015, the proportion of severely polluted days in 2019 decreased by 52.92%, achieving the prevention and control planning targets specified in the ‘Three-year Action Plan for Winning the Blue Sky Defense’ (MEE Citation2018). Notably, the annual average PM2.5 value was 1.11 times higher than the CAAQS grade II AQS (35 μg/m3) in 2019. Only 84 (43.30%) of the cities met the standard, indicating that PM2.5 pollution was still high, with much room for improvement. In addition, our study found that the annual average PM2.5 concentration decreased the least in 2017, and the average daily non-attainment rate increased slightly, with a relatively high concentration interval. This may be associated with meteorological factors, which will reduce PM2.5 concentrations but not significantly improve air quality (Zhang et al. Citation2019). The annual average PM2.5 concentration decreased the most in 2018, indicating that China has made substantial progress in the prevention and control of PM2.5 pollution, which may be closely related to the further deepening and strict control of China’s emission reduction measures. The seasonal and monthly variations in PM2.5 concentrations presented a monthly ‘U’ shape, which was higher in winter and lower in both summer and the middle of spring and autumn, indicating that winter was the peak period for PM2.5 pollution and should be the focus of PM2.5 pollution control efforts. Previous studies (Wang et al. Citation2019b; Shen et al. Citation2020) have reported that this may be caused by the burning of biomass and coal in winter, or may be a consequence of the low rainfall and vegetation cover in winter (Chen et al. Citation2018b). In conclusion, Chinese policy makers should formulate appropriate prevention and control strategies according to the temporal variations of PM2.5, especially in the high-incidence seasons, to reduce the emission of fine particles.
Nationwide, PM2.5 pollution was most serious in the intersection area to the east of the Hu line and north of the Yangtze River, while the southeast coastal areas were found to have maintained good air quality, which was consistent with previous research results (Yan et al. Citation2018; Chen et al.Citation2018b). The urban development level, population density, geographic location, and climatic conditions can affect PM2.5 concentrations (Yang et al. Citation2020b). The urban development level is largely attributed to the local economic conditions. The study found a positive correlation between PM2.5 pollution and economic development, and an imbalance in the level of economic development would lead to an unbalanced distribution of PM2.5 concentrations (Ouyang et al. Citation2019). Many studies have confirmed that there is a significant positive correlation between PM2.5 pollution and population density (Chen et al. Citation2018a; Yang et al. Citation2020b). Population has also been shown to be the most important factor affecting the PM2.5 concentration (Chen et al. Citation2018a). In terms of the geographical location and climate factors, coastal areas are vulnerable to the influence of wind, humidity, and other physical factors favorable to the dispersion of deposition of particulate matter, enabling the air to be purified (Yang et al. Citation2020b). The areas to the east of the Hu line and north of Yangtze River have relatively high levels of urban development and a high population density. Thus, the large differences in geographical location and climatic conditions may be the reasons for the completely different results (Yang et al. Citation2020b). In addition, in the cities with a relatively low level of economic development the PM2.5 concentrations varied considerably. Some researchers have speculated that the main reason for this is that the contribution of different levels of urban development to PM2.5 concentrations is different (Wang et al. Citation2019a). The Hu line is an important population boundary in China, and the polluted areas are mainly distributed to the east of the boundary, indicating that the geographical distribution of PM2.5 is consistent with the population distribution (Jin et al. Citation2017). Li et al. (Citation2018) found that Xinjiang in northwest China is also a PM2.5 pollution center. We also observed this phenomenon, which may be caused by the frequent sandstorms in the region (Wang et al. Citation2020). However, in 2017, the pollution centers in Xinjiang temporarily disappeared, which may be due to favorable weather conditions, such as cold air, in addition to the ongoing emission reduction measures (Zhang et al. Citation2019). Zhang et al. (Citation2019) reported that about 34 large-scale cold air events in China in 2017, which was higher than the average annual value (29.8) from 1980 to 2016, of which 14 were moderate to strong cold air events that affected China. Cold air events could contribute to pollutant diffusion and would favor the formation of unstable weather conditions, leading to air quality improvements. We determined that the high-incidence temporal cluster of PM2.5 pollution was from December 2016 to January 2017, which was exactly consistent with Zhang’s results (Zhang et al. Citation2019). This was because several heavy pollution episodes (HPEs) occurred during the period. Aerosol pollution events mainly occur in the cold season, due to the increased energy consumption for heating and relatively unfavorable meteorological conditions (Zhang et al. Citation2019). Among the 194 cities, we found that the spatial hot spots were mainly located in eastern and central China, and regional pollution occurred between neighboring cities, which was also in accordance with the results of other studies (Li et al. Citation2018; Wang et al. Citation2019b). Most importantly, the geographical locations of pollution hot spots did not change much from year to year, and they tended to occur in clusters. Therefore, it is necessary to use PM2.5 real-time monitoring data to strengthen the prevention and control of pollution, especially in hot spots. The most likely clusters (n = 25) were concentrated in the four provinces of Hebei, Henan, Shandong, and Shanxi, and 21 cities were located in the Beijing-Tianjin-Hebei region and its surrounding area where PM2.5 pollution was serious. Some studies (Yan et al. Citation2018; Chen et al. Citation2018b; Xu et al. Citation2019) have reported that large amounts of coal, a dense population, relatively well developed economy, large number of polluting enterprises, and large amounts of smoke and dust caused by automobile exhaust may be the main reasons for the prevalence of the high PM2.5 pollution in the region. The geographical distribution of PM2.5 not only differed substantially among regions, but also had a significant spatial dependence, with a clustered distribution. Local governments need to maintain a high level of economic development, but corresponding pollution control measures should also be taken, such as focusing on high incidence areas and identifying pollution sources, to prevent PM2.5 pollution from spreading among cities.
Based on the PM2.5 mass concentration data for 194 cities in China over 5 consecutive years, this study revealed the current situation and both long-term and recent trends. It also evaluated the spatiotemporal distribution pattern and identified the spatial hot spots through a variety of analysis methods. At the same time, the results of the analysis can also be applied in the further analysis of the influencing factors and will be a reference for the Chinese government to use in the formulation of effective PM2.5 emission reduction strategies. However, the research still had some limitations. The spatial representation of PM2.5 was limited, and could not be used to fully and accurately understand the spatiotemporal distribution of PM2.5 pollution, although this did not affect the analysis of the overall trend of the PM2.5 distribution. We used a Kriging interpolation method to overcome this defect. Additionally, human activities, meteorological conditions, the social economy, and other potential factors that may affect PM2.5 concentrations were not included in the analysis, and therefore the clustering of PM2.5 was not fully analyzed and evaluated.
Conclusions
The study found that since 2015, PM2.5 concentrations in 194 cities at prefecture level and above in China decreased year by year and the air quality improved significantly, but the PM2.5 concentrations were always high throughout the study period, and therefore the situation is still not acceptable. There was also a clear seasonality in the PM2.5 pollution levels, with winter being a high-risk period. Although the spatial distribution of PM2.5 differed, the clusters with a high concentration risk were relatively concentrated and changed little each year. They were mainly distributed in eastern and central China, especially in the Beijing-Tianjin-Hebei region and its surrounding area. To effectively prevent and control PM2.5 pollution, it is necessary to target regions to conduct real-time spatial early warning, especially within hot spots and at peak periods. The Chinese government and relevant institutions should also adjust pollution control strategies according to actual conditions.
Supplemental Material
Download MS Word (539 KB)Acknowledgments
The authors thank the China National Environmental Monitoring Station (http://www.cnemc.cn/) for providing the air quality monitoring data and are grateful to International Science Editing services for editing this manuscript.
Disclosure statement
No potential conflict of interest was reported by the author(s).
Supplementary material
Supplemental data for this article can be accessed here
Correction Statement
This article has been corrected with minor changes. These changes do not impact the academic content of the article.
Additional information
Funding
References
- Chen J, Zhou CS, Wang SJ, Li SJ. 2018a. Impacts of energy consumption structure, energy intensity, economic growth, urbanization on PM 2.5 concentrations in countries globally. Appl Energy. 230:94–105. doi:10.1016/j.apenergy.2018.08.089.
- Chen L, Gao S, Zhang H, Sun YL, Ma ZX, Vedal S, Mao J, Bai ZP. 2018b. Spatiotemporal modeling of PM2.5 concentrations at the national scale combining land use regression and Bayesian maximum entropy in China. Environ Int. 116:300–307. doi:10.1016/j.envint.2018.03.047.
- CNEMC. 2020. Air quality on-line monitoring and analysing system of China. [accessed 2020 Jan 23]. http://www.cnemc.cn/.
- Filonchyk M, Yan HW. 2018. The characteristics of air pollutants during different seasons in the urban area of Lanzhou, Northwest China. Environ Earth Sci. 77(22):763. doi:10.1007/s12665-018-7925-1.
- Guo U, Bo YC, Chan TC, Zhang ZL, Lin CQ, Tam T, Lau AKH, Chang LY, Hoek G, Lao XQ. 2020. Does fine particulate matter (PM2.5) affect the benefits of habitual physical activity on lung function in adults: a longitudinal cohort study. BMC Med. 18(1):134. doi:10.1186/s12916-020-01570-5.
- Huang K, Liang FC, Yang XL, Liu FC, Li JX, Xiao QY, Chen JC, Liu XQ, Cao J, Shen C, et al. 2019. Long term exposure to ambient fine particulate matter and incidence of stroke: prospective cohort study from the China-PAR project. BMJ. 367:l6720. doi:10.1136/bmj.l6720.
- Huang YY, Yan QW, Zhang CR. 2018. Spatial–Temporal Distribution Characteristics of PM2.5 in China in 2016. J Geovis Spat Anal. 2(2):12. doi:10.1007/s41651-018-0019-5.
- Jiang ZJ, Jolleys MD, Fu TM, Palmer PI, Ma YP, Tian H, Li J, Yang X. 2020. Spatiotemporal and probability variations of surface PM(2.5) over China between 2013 and 2019 and the associated changes in health risks: an integrative observation and model analysis. Sci Total Environ. 723:137896. doi:10.1016/j.scitotenv.2020.137896.
- Jin Q, Fang XY, Wen B, Shan AD. 2017. Spatio-temporal variations of PM2.5 emission in China from 2005 to 2014. Chemosphere. 183:429–436. doi:10.1016/j.chemosphere.2017.05.133.
- Kulldorff M, Huang L, Konty K. 2009. A scan statistic for continuous data based on the normal probability model. Int J Health Geogr. 8:58. doi:10.1186/1476-072X-8-58.
- Li JM, Han XL, Li X, Yang JP, Li XJ. 2018. Spatiotemporal patterns of ground monitored PM2.5 concentrations in China in recent years. Int J of Environ Res Public Health. 15(1):114. doi:10.3390/ijerph15010114.
- Li JX, Liu FC, Liang FC, Huang KY, Yang XL, Xiao QY, Chen JC, Liu XQ, Cao J, Chen SF, et al. 2020. Long-term effects of high exposure to ambient fine particulate matter on coronary heart disease incidence: a population-based Chinese cohort study. Environ Sci Technol. 54(11):6812–6821. doi:10.1021/acs.est.9b06663.
- Lin G, Fu JY, Jiang D, Hu WS, Dong DL, Huang YH, Zhao MD. 2014. Spatio-temporal variation of PM2.5 concentrations and their relationship with geographic and socioeconomic factors in China. Int J Environ Res Public Health. 11(1):173–186. doi:10.3390/ijerph110100173.
- Lu DB, Xu JH, Yang DH, Zhao JN. 2017. Spatio-temporal variation and influence factors of PM 2.5 concentrations in China from 1998 to 2014. Atmos Pollut Res. 8(6):1151–1159. doi:10.1016/j.apr.2017.05.005.
- MEE. 2012. 12th Five-year plan of air pollution prevention and control in key regions. [accessed 2020 May 20]. http://www.mee.gov.cn/gkml/hbb/bwj/201212/t20121205_243271.htm.
- MEE. 2018. Notice of the state council on printing and distributing the three-year action plan to win the blue sky defence war. [accessed 2020 May 17]. http://www.mee.gov.cn/ywgz/fgbz/gz/201807/t20180705_446146.shtml.
- MEP. 2012a. Ambient air quality standards. GB 3095-2012 Beijing:China Environmental Science Press.
- MEP. 2012b. Technical regulation on ambient air quality index (on tria1). HJ 633-2012 Beijing:China Environmental Science Press.
- Ouyang X, Shao QL, Zhu X, He QY, Xiang C, Wei GE. 2019. Environmental regulation, economic growth and air pollution: panel threshold analysis for OECD countries. Sci Total Environ. 657:234–241. doi:10.1016/j.scitotenv.2018.12.056.
- Peng J, Chen S, Lu HL, Liu YX, Wu JS. 2016. Spatiotemporal patterns of remotely sensed PM2.5 concentration in China from 1999 to 2011. Remote Sens Environ. 174:109–121. doi:10.1016/j.rse.2015.12.008.
- Shen FZ, Zhang L, Jiang L, Tang MQ, Gai XY, Chen MD, Ge XL. 2020. Temporal variations of six ambient criteria air pollutants from 2015 to 2018, their spatial distributions, health risks and relationships with socioeconomic factors during 2018 in China. Environ Int. 137:105556. doi:10.1016/j.envint.2020.105556.
- Si YD, Wang HM, Cai K, Chen LF, Zhou ZC, Li SS. 2019. Long-term (2006-2015) variations and relations of multiple atmospheric pollutants based on multi-remote sensing data over the North China Plain. Environ Pollut. 255(Pt 3):113323. doi:10.1016/j.envpol.2019.113323.
- Wang JY, Wang SJ, Li SJ. 2019a. Examining the spatially varying effects of factors on PM2.5 concentrations in Chinese cities using geographically weighted regression modeling. Environ Pollut. 248:792–803. doi:10.1016/j.envpol.2019.02.081
- Wang W, Samat A, Abuduwaili J, Ge YX. 2020. Spatio-temporal variations of satellite-based PM2.5 concentrations and its determinants in Xinjiang, Northwest of China. Int J Environ Res Public Health. 17(6):2157. doi:10.3390/ijerph17062157.
- Wang YG, Ying Q, Hu JL, Zhang HL. 2014. Spatial and temporal variations of six criteria air pollutants in 31 provincial capital cities in China during 2013-2014. Environ Int. 73:413–422. doi:10.1016/j.envint.2014.08.016.
- Wang YZ, Duan XJ, Wang L. 2019b. Spatial-temporal evolution of PM2.5 concentration and its socioeconomic influence factors in Chinese cities in 2014-2017. Int J Environ Res Public Health. 16(6):985. doi:10.3390/ijerph16060985.
- Xiao QY, Geng GN, Liang FC, Wang X, Lv Z, Lei Y, Huang XM, Zhang Q, Liu Y, He KB. 2020. Changes in spatial patterns of PM2.5 pollution in China 2000-2018: impact of clean air policies. Environ Int. 141:105776. doi:10.1016/j.envint.2020.105776.
- Xu H, Xiao ZM, Chen K, Tang M, Zheng NY, Li P, Yang N, Yang W, Deng XW. 2019. Spatial and temporal distribution, chemical characteristics, and sources of ambient particulate matter in the Beijing-Tianjin-Hebei region. Sci Total Environ. 658:280–293. doi:10.1016/j.scitotenv.2018.12.164.
- Yan D, Lei YL, Shi YK, Zhu Q, Li L, Zhang Z. 2018. Evolution of the spatiotemporal pattern of PM2.5 concentrations in China – a case study from the Beijing-Tianjin-Hebei region. Atmos Environ. 183:225–233. doi:10.1016/j.atmosenv.2018.03.041.
- Yang DY, Chen YL, Miao CH, Liu DX. 2020a. Spatiotemporal variation of PM2.5 concentrations and its relationship to urbanization in the Yangtze river delta region, China. Atmos Pollut Res. 11(3):491–498. doi:10.1016/j.apr.2019.11.021.
- Yang Y, Lan HF, Li J. 2020b. Spatial econometric analysis of the impact of socioeconomic factors on PM2.5 concentration in China’s inland cities: a case study from chengdu plain economic zone. Int J Environ Res Public Health. 17(1):74. doi:10.3390/ijerph17010074.
- Ye WF, Ma ZY, Ha XZ. 2018. Spatial-temporal patterns of PM2.5 concentrations for 338 Chinese cities. Sci Total Environ. 631-632:524–533. doi:10.1016/j.scitotenv.2018.03.057.
- Zhang LC, An J, Liu MY, Li ZW, Liu Y, Tao LX, Liu XT, Zhang F, Zheng DQ, Gao Q, et al. 2020. Spatiotemporal variations and influencing factors of PM2.5 concentrations in Beijing, China. Environ Pollut. 262:114276. doi:10.1016/j.envpol.2020.114276.
- Zhang XY, Xu XD, Ding YH, Liu YJ, Zhang HD, Wang YQ, Zhong JT. 2019. The impact of meteorological changes from 2013 to 2017 on PM2.5 mass reduction in key regions in China. Sci China Earth Sci. 62(12):1885–1902. doi:10.1007/s11430-019-9343-3.
- Zhao SP, Yin DY, Yu Y, Kang SC, Qin DH, Dong LX. 2020. PM(2.5) and O(3) pollution during 2015-2019 over 367 Chinese cities: spatiotemporal variations, meteorological and topographical impacts. Environ Pollut. 264:114694. doi:10.1016/j.envpol.2020.114694.