
 ?Mathematical formulae have been encoded as MathML and are displayed in this HTML version using MathJax in order to improve their display. Uncheck the box to turn MathJax off. This feature requires Javascript. Click on a formula to zoom.
ABSTRACT
Water use of domestic activities was quantified by interviewing 217 people in a peri-urban community near Bandung, Indonesia. Resulting in data on domestic water demand and data needed for exposure modelling of domestic activities: drinking, cooking, brushing teeth, swimming, bathing, laundry, dishwashing, religious cleansing, washing hands and cleaning food. Average total domestic water usage was 117 l/person/day, topping the WHO guidelines for basic needs (50–100 l/person/day). This water use level is comparable with higher income countries for the same set of activities but 100% higher than water use in an Indonesian traditional rural community. The final dataset provides insight in quantity of water used for domestic activities, as well as the use-frequency, duration and water sources used. These data are scarce for Indonesia and other low-middle income countries but necessary for water demand studies and estimating risks through exposure to pathogens and emerging contaminants in human exposure modelling.
Introduction
The availability of an adequate and uninterrupted clean water supply to the public is directly related to the protection of public health (Fan et al. Citation2014; Nastiti et al. Citation2017b). In 2017, globally more than 785 million people lacked access to basic water services and more than 884 million people drank unsafe water (UNICEF, WHO Citation2019). Surface- or shallow-groundwater is often the only water source for daily activities such as drinking, cooking, or washing. These water sources are prone to environmental contamination, potentially triggering adverse health effects. The consumption of contaminated drinking water is one of the most significant causes of illness worldwide (Landrigan et al. Citation2018; UNICEF, WHO Citation2019).
For agenda setting, policy formulation in water resources management and the assessment of the human health risks related to water usage, it is essential to know (1) what the domestic water demand is, and (2) the exposure routes from source to community. Domestic water demand data consist of the amounts of water used for various household activities, like sanitation, drinking water, or for irrigating gardens (Jones et al. Citation2007; Fan et al. Citation2014; David et al. Citation2016). Water demand studies often model and estimate domestic water demand because these data are scarce and vary greatly between global regions (Fearnley et al. Citation2004; E and WS (Engineering and Water Service) Citation1993). Accurate estimations are needed to properly assess the current and future water demands to estimate water resources needed.
Assessment of health risks related to water use is achieved by human exposure modelling (HEM; Ragas et al. Citation2009). Water-related exposure routes play an important role in the exposure of humans to contaminants and are determined by the water usage (Henn et al. Citation2018). To calculate uptake and ultimately risks, the U.S. EPA (Citation2011) describes the environmental pathways, exposure factors and exposure routes for surface water in households. The pathways, factors and exposure routes need to be quantified to calculate the total exposure to and uptake of contaminants (U.S. EPA Citation2011). However, the water-related exposure route is complex and based on the water source reliability, accessibility, location, economic situation, and culture (Gilbertson et al. Citation2011; Fan et al. Citation2013; Adams et al. Citation2013; Salleh et al. Citation2015; Nastiti et al. Citation2017b). So localized data on water demand is needed but also is typically scarce, especially in lower-middle income countries like Indonesia (Utami et al. Citation2020).
As domestic water demand and the water-related exposure data consist partly of the same information, we combined their data gathering in this study. The main objectives of this article is (1) to determine the domestic water demand, (2) to map the domestic water-related exposure factors and routes, and (3) to quantify the contact intensity of water-related exposure routes for risk assessment purposes. The study area is a peri-urban community in a lower-middle income country, i.e. the Kampong Ciwalengke, close to the City of Bandung in the Upper Citarum River Basin, Indonesia. Limited access to clean water and adequate sanitary facilities causes the residents in Ciwalengke to revert to use multiple sources, often unprotected and failing the Indonesian criteria for water source quality (Marselina and Putri Citation2022; Utami et al. Citation2022).
Materials and methods
Study area
Kampong Ciwalengke (7.0522° S, 107.7533° E; ) is situated along the Citarum River which is the longest river (297 km) in West Java with a discharge of approximately 12.9 billion m3/year. The Citarum River acts as a water source for 27 million people in West Java and Jakarta (Utami et al. Citation2020).
Figure 1. Location of the study area Kampong Ciwalengke in the upper Citarum river basin (upper basin shown in the red area in inset), Java Island, Indonesia. The kampong is a typical suburban area, located between paddy fields (darker patches north and south) and industry (brighter bigger rooftops).
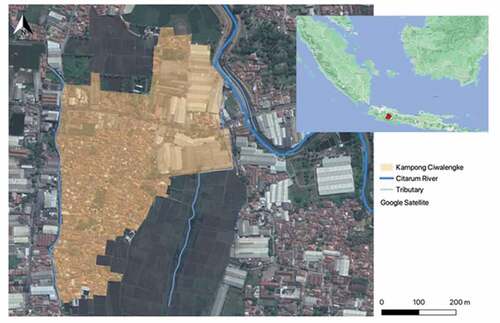
Kampong Ciwalengke (90 ha) is a neighbourhood located in Sukamaju Village of the Majalaya District, Bandung Regency. The main channel of the Citarum River is located to the north-east of Kampong Ciwalengke (). The irrigation channel that borders the western part of the study area is a tributary of the Citarum River and acts as the main water source for Ciwalengke. The water is distributed to the village through pipes and stored in the communal tubs and shallow ground water wells. This water is mainly used for domestic purposes, despite the surrounding industries partly discharge their wastewater into the irrigation channel.
The people of Ciwalengke use this contaminated water because they have limited access to piped water. Additionally, there is access to refill water (bottled) from commercial kiosks around the study location to fulfil the community’s needs of clean water. A brief survey of seven refill water kiosks around Ciwalengke revealed that their raw water originated from upstream rivers connected to the Citarum River (i.e. Drawati Village, Sudi Village, Cipeujeuh Village, see table S8).
Survey design
In the survey, we aimed to get data on the kind of domestic activities related to water; the per-person quantity of water used per domestic activity (water demand); and the data needed to quantify exposure factors and exposure routes for HEM. As a first step in the design of the survey, the activity-based local water usage was determined by literature analysis and this theoretical basis was compared to observed activities (Salleh et al. Citation2015). Subsequently, a questionnaire was drafted to confirm the identified water usage, to collect personal information and to characterize the water usage (e.g. amounts, sources, frequency, duration, and treatment level). The questions were tested in a preliminary survey with 20 randomly selected residents of Ciwalengke, which were excluded from the final survey. We evaluated whether the survey goals were met, the practical feasibility of the questionnaire (such as time needed, estimating volumes), and the necessary field equipment. Lastly, enumerators were trained before the survey. The final questionnaire consisted of 73 questions: 14 about personal data and 59 about behaviours of daily water usage (types of activity, duration, volumes, sources, and treatment). See supplementary material for survey questions (S1) and protocol (S2).
The questionnaire survey is based on a non-probability quota sampling. To achieve 90% confidence and a margin error of 0.05 with a total 1013 households, our total number of interviewed respondents was 217 over a period of eight weeks. Enumerators were walking through the village during daytime (8:00 a.m. to 6:00 p.m.) and recruited the respondents randomly with inclusion criteria, i.e.: being an adult (≥18 years); max. one resident per household; resident of Kampong Ciwalengke.
The ethical clearance, to protect the rights and secrecy of the respondents, was issued by the Ethic Commission of Health Study of Dustira Hospital Cimahi, West Java (No: Etik.RSD/029/I/2019).
Data processing
The survey results were processed in MS Excel and R 4.0.3 (R Core 2020). Tests for significant differences (< p = 0.05) were performed with the unpaired two-sample Wilcoxon test in R 4.0.3.
For quantification of the exposure factors and exposure routes the Body surface area (Sa in cm2), was estimated based on body weight (BW in kg) and height (H in cm), using the following equation (Mosteller Citation1987):
The ingestion rates, fractions of body surface area in contact and the absorption fraction of gastrointestinal tract were taken from the literatures (see subscript note of ).
Table 1. General characteristics of the respondents per gender and age class.
Table 2. Parameters for human exposure modelling. Oral and dermal exposure per activity for age groups, gender, and total respondents.
Results
Characteristics of the respondents
Out of the 223 people contacted, 217 agreed to be interviewed (response rate: 97.3%). summarizes the recorded general characteristics of the interviewees, i.e. gender, age class (18–65 years; ≥ 65 years), demographic data (education level, job, and income) and physical characteristics (body weight, height and body surface area).
Water demand of domestic activities
This section contains the results relevant for estimating the domestic water demand, focused on the quantity of water used for various domestic activities. The water quantity used per activity was determined by recording the amount of water used, the duration of the activity and its frequency. Raw data can be found in the supplementary material (table S11; excel spreadsheet).
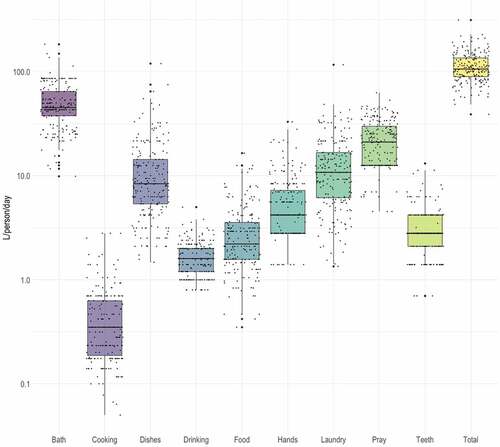
Water usage results are presented as volume per event and volume per day, based on the estimation of water-related activities as reported by the respondents (supp. material table S1 and table S2). Bathing had the highest reported water use per event with 28.1 (±15.90) l/person and drinking the lowest with 0.2 (±0.10) l/person. The average total volume of water used per day was 114.6 l/person/day (). Most water was used for bathing (44.9%) with an average volume of 51.5 (±24.36) l/person/day. Least water was used for cooking (0.4%) with 0.5 (±0.46) l/person/day. The whiskers in (covering 1.5 times the interquartile range) show that the variation in the recorded daily water usage is approximately one order of magnitude for most activities.
Figure 2. Water usage (l/person/day) per activity (log10 scale). Boxes showing lower quartile, median and upper quartiles. Whiskers show data within 1.5 times the interquartile range. Black dots are the (horizontally jittered) data points.
Environmental pathways, exposure routes, mapped water sources & treatments
The domestic activities and their exposure routes as found by survey in the Ciwalengke are presented in this section. Exposure pathways to contaminants in water lead to uptake through the gastrointestinal tract (oral) and skin (dermal). shows the exposure pathways from water sources to human uptake identified in the survey for daily domestic and religious activities in Ciwalengke.
Figure 3. Environmental pathways, domestic activities (basis for exposure factors), and exposure routes that involve water usage based on the results of the survey.
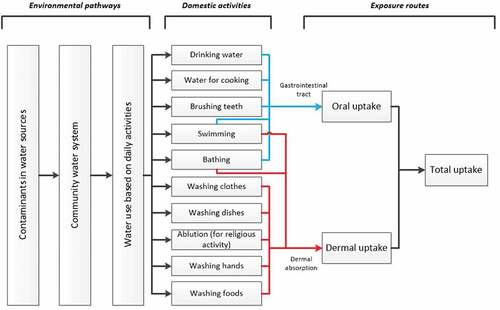
Most routes in are the same as found in other studies (U.S. EPA Citation2011), except for washing before praying (ablution) which is a typical daily activity in Moslem countries. The results of the questionnaire showed that various water sources are used that are classified as improved and unimproved following the Joint Monitoring Program (JMP; UNICEF, WHO Citation2008). The types of improved water sources found in Ciwalengke were piped water (16.4%), ground water pump/borehole (22.5%), protected dug well (1.5%), and branded bottled water (0.2%; bottled water is considered “improved” only if water for other domestic purposes originates from improved source). Meanwhile the rest were unimproved water sources that consist of refill water kiosk (8.7%), unprotected dug well (6.0%), unprotected dug well with mixed water (26.2%; it is the ground water wells which also collect distributed water from the river), and river water that distributed to the village through pipes and stored in the private or communal tubs (18.5%). In total, about 60% of the water-related activities in Ciwalengke used unimproved water sources. The water sources data recapitulation is presented in table S5 and table S6, and fig. S1 and fig. S2.
Water treatments were also evaluated in the survey. Around 85% of respondents stated that water-related activities did not start with any water treatment. While for some activities water was treated such as cloth filtering (4.1%), water settlement (2.7%), boiling (5.2%), water settlement and boiling (2.3%), filtering and boiling (0.2%), water settlement and filtering (0.3%), and combined water settlement, filtering and boiling (0.1%). Water boiling was the most preferred method of disinfection among the slum households, particularly for drinking water purposes. Meanwhile, the water settlement mostly was done before cooking and food washing activity. Filtering by cloth was common for each water-related activity, mostly by fitting a used cloth on the faucet. The proportion of water treatments for each water-related domestic activity can be seen in supplementary material (table S7 and fig. S3).
Quantified exposure factors and routes to estimate contaminants exposure through water-related domestic activities
In this section, the Environmental pathways, activity-based exposure factors and exposure routes identified in the previous section are quantified using the data from the questionnaire to be able to do a human exposure modelling (HEM) and risk assessment. These data can be applied in HEM studies in similar regions for water related domestic activities and coupled to local predominant water sources (the environmental pathway).
The questionnaire data was used to calculate parameters needed for HEM. Based on the identified water use (), shows HEM-related parameters for the activities that contribute to oral and dermal exposure.
Activities that lead to oral exposure were drinking, water for cooking, teeth brushing, bathing, and swimming. For drinking and water for cooking, all the water volume was assumed to directly enter the gastrointestinal tract as water intake. While for teeth brushing, bathing, and swimming, the amount of water that enters the body through oral entry was calculated based on the duration of activities and the assumptions of ingestion rate from the literature ().
For dermal exposure, contaminants can enter the skin through water-based activities: swimming, bathing, ablution (religious activity of washing before praying), washing hands, dishes, clothes, and food. Parameters that are important for dermal exposure are contact duration between the contaminated water with human skin and the fraction of skin exposed to water. In some activities such as washing clothes, washing dishes, ablution, washing hands, and washing foods, only part of the body surface area (BSA) is exposed to (contaminated) water. To quantify the partial exposure, the fraction of BSA in contact during activities was acquired from literature (). Volumes or duration of cooking, drinking, laundry washing, and food washing differed significantly between age and/or gender classes, see indications in .
Discussion
In this study, we queried a low-income suburban neighbourhood to research the domestic activity-based water use and reported (1) the quantity of water used for all activities (i.e. the domestic water demand), (2) the mapped environmental pathways (incl. sources), exposure factors and routes and (3) the quantified exposure factors and routes. For the latter we created a database containing parameters describing oral and dermal exposure of found domestic activities. The database includes the prevalence of water usage among gender and age categories, frequency of use, amount of use, and duration. This comprehensive and detailed study providing volume and duration information of 10 domestic activities for a single population on an individual level in Indonesia.
Practicalities during the survey
The structured questionnaire used proved useful. Important aspects were test driving and then optimizing the questionnaire to actual encountered activities, keeping the questionnaire simple and providing flexibility to let interviewees describe the activity freely, and let them demonstrate the water usage if the details were unclear.
The enumerators were trained to understand the intent behind the questions, the preliminary survey helped in this regard. Understanding the local language, Sundanese, is a prerequisite. Especially older respondents who predominantly speak the local language, could better understand the questions.
A common problem encountered during the survey was that some respondents were struggling to recall their water usage habits while answering the questionnaire and had difficulties quantifying the precise amounts of water use. Studies have shown that people often have misconceptions on actual water consumption and tend to underestimate or overestimate their water consumption (Fan et al. Citation2014). Fan et al. (Citation2014) proved that some consumers tend to underestimate their outdoor and kitchen water consumption and overestimate their indoor water consumption. To overcome both issues, the enumerators checked the respondents’ water sources, observed their water-related domestic activities, measured the volume of water containers used by respondents, and measured the water flow of their running water. These actions might validate the respondents’ answers of the survey questions. Measuring (or weighing in other product usage studies) is a more accurate method to assess the precise amount of product used (Bennett et al. Citation2011). Another measurement approach by Ovaskainen et al. (Citation2008) was taking photographs to assess the amount of food consumed in nutritional studies. This approach was tested for water use (in the preliminary survey), but abandoned because of the variety in water containers used by respondents.
Multi-sources water, water treatments and domestic water demand
The communities’ behavior in water usage is influenced by many factors, including seasonal variability of water availability, water supply restrictions, home ownership, tariff structure and water pricing, household habits and characteristics, water situation, beliefs, attitudes, perception, subjective norms and intentions regarding water conservation and personal capability factors such as various age, educational, income, and occupation (Gilbertson et al. Citation2011; Fan et al. Citation2013; Adams et al. Citation2013; Salleh et al. Citation2015; Nastiti et al. Citation2017b). Those factors both directly and indirectly drive water consumption and usage behaviours. With respect to the mentioned factors influencing water usage, the community under survey is rather homogeneous in socio-economic situation, religion, and social capabilities. In general, the frequency and the activity-based-volume of water use varied over individuals, a variation also observed by Wu et al. (Citation2010), but does not divide widely across groups, except for drinking and laundry water volume and cooking and laundry duration.
The water sources analysis (table S5) shows that people in Ciwalengke used multi-sources for domestic activities, and improved and unimproved water sources are combined. This common practice, especially in low-middle income countries without high access to piped water (Bain et al. Citation2012; Muntalif et al. Citation2017). Also some water sources tend to be used for specific activities. For example, respondents mostly used water from the refill water kiosk to fulfil their drinking water needs. Whereas river sourced water is mostly used for laundry. This shows that residents are still aware what is considered “safe water”. Sometimes the perception and actual water quality differs. For example, the high trust in refill water is often misplaced since the safety of such water sources is weakly enforced. Our results show that only one out of seven refill water kiosks could prove that water quality was monitored regularly (table S8).
Problems with unimproved water sources such as inconsistent supply and unknown quality lead to mitigation strategies, such as water treatment and home or community storage (Nastiti et al. Citation2017a). Water boiling is the most common method of water treatment among the slum households (Muntalif et al. Citation2017). The effectiveness of boiling has been examined; households that do not boil water pose a higher risk of water contamination compared to those who do (Sodha et al. Citation2011). However, the survey result shows that most domestic activities (85%) did not involve water treatment at all, while the remainder often only performed very basic treatment as using a cloth as water filter. The low percentage of water treatment in the study area was probably affected because of the respondent’s economic condition and lack of knowledge about water, sanitation, and hygiene (WASH). These factors are proven to affect water-related behavior including water treatment (Hurlimann et al. Citation2009).
How does the observed water quantity usage compare to similar surveys done elsewhere? The data most widely available in literature are amounts of water used per person per day (l/day/person) either for drinking water or more generally for all combined activities in a domestic setting. The average daily drinking water consumption in the study is 1.7 l/person/day. While below the WHO guideline of 2.0 liters drinking water per day, lower daily drinking water consumption average values are reported in many countries around the world. According to Williams et al. (Citation2001), one person needs at least 1.6 l/d to fulfil the basic needs. In America, the average drinking water consumption of British Columbia, Canada, and USA was 1.00 l/person/day, 1.62 l/person/day and 1.23 l/person/day, respectively (Levallois et al. Citation1998; U.S. EPA Citation2000; table S9Jones et al. Citation2007). Lower daily drinking water consumption averages are also reported in European countries such as England and Sweden with average value of 1.56 l/person/day and 1.86 l/person/day, respectively (FWR 1996; Westrell et al. Citation2006; table S9). Overall, findings in this study are in line with daily volumes reported in other studies.
The average total volume of domestic water usage in this study was 114.6 l/d/person for all combined activities. For Indonesia, David et al. (Citation2016) found a water use for sanitary activities and drinking water of 25 l/day/person in a traditional rural community of the forested remote area of Harapan Rainforest, Jambi, Sumatera Island. To compare, the results for bathing, teeth brushing, washing hands, and drinking of this study amount to about 62.5 l/day/person. The peri-urban domestic water demand is more than double for these basic activities showing the variation of water demand in countries like Indonesia.
Outside of Indonesia, studies were found in South Australia, Netherlands, Switzerland and Denmark (E and WS (Engineering and Water Service) Citation1993; Dixon et al. Citation1999; Terpstra Citation1999; Fearnley et al. Citation2004; table S10). The domestic water use in the Australian studies ranged from 116–137 l/person/day, but increased to 272–348 l/person/day when garden irrigation was taken into account. The average daily domestic water volume used in the Netherlands (145 l/person/day; Terpstra Citation1999), Switzerland (450 l/person/day), and Denmark (250 l/person/day; Dixon et al. Citation1999) was considerably higher than in our study area supp. material table S10). However, it is unclear which domestic activities were included in these European studies. WHO has noted that a person needs between 50 and 100 litres of water per day to meet basic requirements, such as, drinking, cooking, cleaning and washing (OHCHR (United Nations Human Rights), UN-Habitat (United Nations Human Settlement Programme), WHO (World Health Organization) Citation2010; Gilbertson et al. (Citation2011); Salleh et al. Citation2015). Most studies result in a total water usage exceeding the water levels of basic human needs as stated by the WHO. Basic domestic water usage seems similar to other international studies, but activities connected to a higher living standard such as gardening, which was not observed in the study area, greatly contribute to much higher water usage reported in literature. The rapid urbanisation reported in Indonesia will probably lead to a higher water demand in the future when people from remote areas transfer into urban settings.
Water-related domestic activities, exposure factors and exposure routes
The exposure pathways through water-related domestic activity found in our study area (see ), largely followed the pathways known from international literature (Ragas et al. Citation2009; Henn et al. Citation2018). There are some differences between the exposure pathways in this study and others, especially high-income countries (Dixon et al. Citation1999; Fearnley et al. Citation2004; Fan et al. Citation2014). The main differences within the study community are that the laundry and dishwasher are done by hand and not by machine. Furthermore, only bathing was observed (not showering) because of the typical hygiene habit in the study location. Another difference was “ablution” which is an Islamic procedure for cleansing parts of the body, a type of ritual purification, is common in this Moslem community. All these differences are crucial considering that the exposure routes and factors dependent on the activities involved (U.S. EPA Citation2011).
For oral exposure, drinking water consumption is generally one of the most affecting parameters in calculating the total uptake of the contaminant in a HEM. Also, in this study, volume-wise, drinking water is the dominant oral route. HEM studies show that uptake from oral routes is noticeably higher compared to dermal and inhalation (Ragas et al. Citation2009). However, the lower oral exposure that occurs during swimming, still can contribute to a health risk in case the water quality exposed is worse than the water used for drinking, especially in case of microbial contamination.
Although oral exposure has been assumed as the major route of contaminant exposure in humans, there is still potential contaminant uptake through skin (dermal) contact (Ragas et al. Citation2009). Dermal exposure depends on the duration and the amount of body surface area exposed. Based on duration and percentage body surface exposed results (table S4), dominant dermal exposure routes are bathing (27.8 min/person/day), laundry (17.6 min/person/day) and dishwashing (16.2 min/person/day). While the other activities average duration is below 7 min/person/day. This result is in line with Wilkes et al. (Citation2005) study which showed that bathroom water used dominates personal exposure to water-borne contaminants.
The percentage of female respondents in this study (80.6%) is higher than male respondents. This gender disparity is an issue in WASH services particularly in low- and middle-income countries (Wali et al. Citation2020). In this study, the disparity between male and female respondents is probably caused by the survey’s timing, it was executed during the daytime (8:00 a.m. to 6:00 p.m.) when mostly male residents were at work. Besides that, often when we explained the domestic nature of the questionnaire survey, male respondents would ask their wife to answer the questions. A few significant differences found are between males and females. In the average water volume results, we presented male and female apart, and also the average volume of total respondents (see supp. material table S1 &amp; S2). From those tables, it can be seen that the average volumes (both per occurrence and per day) of female respondents were higher (compared to male and total respondents averages) for particular domestic activities, i.e.: laundry, dish washing, and food washing. It is a reality that women, in Ciwalengke and Indonesian context, hold a crucial role in domestic water demand and they are also more vulnerable to contaminant exposure from water sources due to their role (Singh and Mukherjee Citation2018; Pouramin et al. Citation2020).
In assessing exposure of specific population groups to contaminants in water, knowing the population’s water-use is vital to realistic exposure estimates (Wilkes et al. Citation2005). Data on water-use in Indonesia and other low- and middle-income countries are limited. This study presents valuable data on water domestic water demand (quantity) and exposure routes (applicable in HEM) when connected to data of water quality.
Conclusion
Using a questionnaire to obtain the water usage in a domestic setting proved effective, providing a preliminary survey is carried out to test assumptions on activities; the enumerators are properly trained to interface with the local population; and water quantities are measured instead of verbally acquired. The water demand and exposure route data collected is rare or presently not available for Indonesia.
The study area’s water demand is comparable to that of higher income countries based on the same activities. However, in high income countries the overall domestic use can be 200% higher when all domestic activities are included (such as gardening). Compared to an Indonesian traditional rural community, the domestic water use was 100% higher in the suburban research area. The found water use topped the WHO guidelines for basic human needs (50–100 litres of water per day).
The water-related domestic activities are similar to other studies with the exception of ritual washing (ablution) and that dish and laundry are washed by hand. The results show the oral and dermal exposures based on the water usage and duration of activities. The final dataset is valuable for (1) calculating domestic water demand and (2) for human exposure modelling to quantify environmental and toxicological risks when the water quality of water sources is known.
Supplemental Material
Download MS Excel (110.5 KB)Supplemental Material
Download MS Word (93.6 KB)Acknowledgements
The authors thank the enumerators (Siti Maryam and Nina Mulyani) for their survey work. We also acknowledge the anonymous reviewers for their valuable comments on this manuscript draft. The research was funded by Deltares and Radboud University.
Disclosure statement
No potential conflict of interest was reported by the authors.
Supplementary data
Supplemental data for this article can be accessed online at https://doi.org/10.1080/09603123.2022.2163986.
Additional information
Funding
References
- Adams DC, Allen D, Borisova T, Boellstorff DE, Smolen MD, Mahler RL. 2013. The Influence of water attitudes, perceptions, and learning preferences on water-conserving actions. Nat Sci Educ. 42(1):114–122. doi:10.4195/nse.2012.0027.
- Bain R, Wright J, Yang H, Pedley S, Gundry S, Bartram J. 2012. Improved but not necessarily safe: water access and the millennium development goals. Canberra: GWF Discussion Paper.
- Bennett DH, Wu X, Teague CH, Lee K, Cassady DL, Ritz B, Hertz-Picciotto I. 2011. Passive sampling methods to determine household and personal care product use. J Expo Sci Environ Epidemiol. 22(2):148–160. doi:10.1038/jes.2011.40.
- David W, Widianingsih NN, Ploeger A. 2016. Water usage pattern on different group residing in vicinity Harapan rainforest. Agric Agric Sci Procedia. 9:309–316. doi:10.1016/j.aaspro.2016.02.137.
- Dixon A, Butler D, Fewkes A. 1999. Water saving potential of domestic water reuse systems using grey water and rainwater in combination. Water Sci Technol. 39(5):25–32. doi:10.2166/wst.1999.0218.
- E & WS (Engineering and Water Service). 1993. Water Consumption and Conservation. Adelaide (SA): SA Government Publication.
- Fan L, Liu G, Wang F, Geissen V, Ritsema CJ. 2013. Factors affecting domestic water consumption in rural households upon access to improved water supply: insights from the Wei River Basin, China. PLoS ONE. 8(8):e71977. doi:10.1371/journal.pone.0071977.
- Fan L, Wang F, Liu G, Yang X, Qin W. 2014. Public perception of water consumption and its effects on water conservation behavior. Water. 6(6):1771–1784. doi:10.3390/w6061771.
- Fearnley EJ, Thomas KD, Luscombe A, Cromar NJ. 2004. Determination of water usage rates and water usage patterns in a residential recycling initiative in South Australia. Environ Health. 4:2.
- FWR (Foundation for Water Research). 1996. Tap water consumption in England and wales: findings from the 1995 national survey. Birmingham (UK): M.E.L. Research, Environmental Management Research Unit. Report No.: DWI0771.
- Gilbertson M, Hurlimann A, Dolnicar S. 2011. Does water context influence behaviour and attitudes to water conservation? Australas J Environ Manag. 18(1):47–60. doi:10.1080/14486563.2011.566160.
- Henn BC, Ogneva-Himmelberger Y, Denehy A, Randall M, Cordon N, Basu B, Caccavale B, Covino S, Hanumantha R, Longo K, et al. 2018. Integrated assessment of shallow-aquifer vulnerability to multiple contaminants and drinking-water exposure pathways in Holliston, massachusetts. Water. 10(1):23. doi:10.3390/w10010023.
- Hurlimann A, Dolnicar S, Meyer P. 2009. Understanding behaviour to inform water supply management in developed nations–a review of literature, conceptual model and research agenda. J Environ Manage. 91(1):47–56. doi:10.1016/j.jenvman.2009.07.014.
- Jones AQ, Majowicz SE, Edge VL, Thomas MK, MacDougall L, Fyfe M, Kovacs SJ. 2007. Drinking water consumption patterns in British Columbia: an investigation of associations with demographic factors and acute gastrointestinal illness. Sci Total Environ. 388(1–3):54–65. doi:10.1016/j.scitotenv.2007.08.028.
- Landrigan PJ, Fuller R, Acosta NJR, Adeyi O, Arnold R, Basu NN, Baldé AB, Bertollini R, Bose-O’Reilly S, Boufford JI, et al. 2018. Lancet commission on pollution and health. Lancet. 391(10119):462–512. doi:10.1016/S0140-6736(17)32345-0.
- Levallois P, Guevin N, Gingras S, Levesque B, Weber JP, Letarte R. 1998. New patterns of drinking-water consumption: results of a pilot study. Sci Total Environ. 209(2–3):233–241. doi:10.1016/S0048-9697(97)00320-3.
- Marselina M, Putri NM. 2022. Sustainability analysis of the upper citarum watershed based on water quality, water quantity, and landuse indicators. IOP Conf Ser: Earth Environ Sci. 1065(1):012043. doi:10.1088/1755-1315/1065/1/012043.
- Mosteller RD. 1987. Simplified calculation of body-surface area. N Engl J Med. 317. 1098–1098.
- Muntalif BS, Nastiti A, Roosmini D, Sudradjat A, Meijerink SV, Smits AJM. 2017. Household water supply strategies in urban bandung, Indonesia: findings and implications for future water access reporting. J Eng Technol Sci. 49(6):811–832. doi:10.5614/j.eng.technol.sci.2017.49.6.8.
- Nastiti A, Meijerink SV, Oelmann M, Smits AJM, Muntalif BS, Sudradjat A, Roosmini D. 2017a. Cultivating innovation and equity in co-production of commercialized spring water in peri-urban bandung, Indonesia. Water Altern. 10(1):134–154.
- Nastiti A, Sudradjat A, Geerling GW, Smits AJM, Roosmini D, Muntalif BS. 2017b. The effect of physical accessibility and service level of water supply on economic accessibility: a case study of Bandung city, Indonesia. Water Int. 42(7):831–851. doi:10.1080/02508060.2017.1373323.
- OHCHR (United Nations Human Rights), UN-Habitat (United Nations Human Settlement Programme), WHO (World Health Organization). 2010. The right to water. Geneva (CH): Office of the United Nations High Commissioner for Human Rights. https://www.ohchr.org/sites/default/files/Documents/Publications/FactSheet35en.pdf.
- Ovaskainen ML, Paturi M, Reinivuo H, Hannila ML, Sinkko H, Lehtisalo J, Pynnonen-Polari O, Mannisto S. 2008. Accuracy in the estimation of food servings against the portions in food photographs. Eur J Clin Nutr. 62(5):674–681. doi:10.1038/sj.ejcn.1602758.
- Pouramin P, Nagabhatla N, Miletto M. 2020. A systematic review of water and gender interlinkages: assessing the intersection with health. Front Water. 2:6. doi:10.3389/frwa.2020.00006.
- Ragas AMJ, Brouwer FPE, Buchner FL, Hendriks HWM, Huijbregts MAJ. 2009. Separation of uncertainty and interindividual variability in human exposure modeling. J Expo Sci Environ Epidemiol. 19(2):201–212. doi:10.1038/jes.2008.13.
- Salleh NSM, Rasmani KA, Jamil NI. 2015. The effect of variations in micro-components of domestic water consumption data on the classification of excessive water usage. Procedia Soc Behav Sci. 195:1865–1871. doi:10.1016/j.sbspro.2015.06.422.
- Singh R, Mukherjee P. 2018. ‘Whatever she may study, she can’t escape from washing dishes’: gender inequity in secondary education – evidence from a longitudinal study in India. J Comp Int Educ. 48(2):262–280. doi:10.1080/03057925.2017.1306434.
- Sjögren K, Ekstrand J, Birkhed D. 1994. Effect of water rinsing after toothbrushing on fluoride ingestion and absorption. Caries Res. 28(6):455–459. doi:10.1159/000262020.
- Sodha SV, Menon M, Trivedi K, Ati A, Figueroa ME, Ainslie R, Quick R. 2011. Microbiologic effectiveness of boiling and safe water storage in South Sulawesi, Indonesia. J Water Health. 9(3):577–585. doi:10.2166/wh.2011.255.
- Strenge DL, Chamberlain PJ. 1996. Multimedia environmental pollutant assessment system (MEPAS®): exposure pathway and human health impact assessment models. Richland (WA): Battelle Memorial Institute. Report No.: PNL-10523, UC-630. Contract No.: DE-AC06-76RLO 1830.
- Terpstra PMJ. 1999. Sustainable water usage systems: models for the sustainable utilisation of domestic water in urban areas. Water Sci Technol. 39(5):65–72. doi:10.2166/wst.1999.0223.
- UNICEF, WHO. 2008. Progress on drinking water and sanitation: special focus on sanitation. New York: United Nations Children’s Fund (UNICEF) and World Health Organization.
- UNICEF, WHO. 2019. Progress on household drinking water, sanitation and hygiene 2000-2017: special focus on inequalities. New York: United Nations Children’s Fund (UNICEF) and World Health Organization.
- U.S. EPA. 2000. Estimated per capita water ingestion in the United States. Washington (DC): Office of Science and Technology/Office of Water, U.S. Environmental Protection Agency. Report No.: EPA-822-00-008.
- U.S. EPA. 2004. Risk assessment guidance for superfund volume I: human health evaluation manual (part E, supplemental guidance for dermal risk assessment). Washington (DC): Office of Superfund Remediation and Technology Innovation, U.S. Environmental Protection Agency. Report No.: EPA/540/R/99/005.
- U.S. EPA. 2011. Exposure factors handbook: 2011 Edition. Washington (DC): National Center for Environmental Assessment, Office of Research and Development, U.S. Environmental Protection Agency. Report No.: EPA/600/R-09/052F.
- Utami RR, Geerling GW, Salami IRS, Notodarmojo S, Ragas AMJ. 2020. Environmental prioritization of pesticide in the Upper Citarum River Basin, Indonesia, using predicted and measured concentrations. Sci Total Environ. 738:140130. doi:10.1016/j.scitotenv.2020.140130.
- Utami RR, Salami IRS, Geerling GW, Notodarmojo S, Ragas AMJ. 2022. Health risk-based prioritization approaches of pharmaceuticals in the Upper Citarum River Basin. IOP Conf Ser: Earth Environ Sci. 1065(1):012064. doi:10.1088/1755-1315/1065/1/012064.
- Wali N, Georgeou N, Simmons O, Gautam MS, Gurung S. 2020. Women and WASH in Nepal: a scoping review of existing literature. Water Int. 45(3):222–245. doi:10.1080/02508060.2020.1754564.
- Westrell T, Andersson Y, Stenström TA. 2006. Drinking water consumption patterns in Sweden. J Water Health. 4(4):511–522. doi:10.2166/wh.2006.0034.
- Wilkes CR, Mason AD, Hern SC. 2005. Probability distributions for showering and bathing water-use behavior for various U.S. subpopulations. Risk Anal. 25(2):31. doi:10.1111/j.1539-6924.2005.00592.x.
- Williams B, Florez Y, Pettygrove S. 2001. Inter- and intra-ethnic variation in water intake, contact, and source estimates among Tucson residents: implications for exposure analysis. J Expo Anal Environ Epidemiol. 11(6):510–521. doi:10.1038/sj.jea.7500192.
- Wu XM, Bennett DH, Ritz B, Cassady DL, Lee K, Hertz-Picciotto I. 2010. Usage pattern of personal care products in California households. Food Chem Toxicol. 48(11):3109–3119. doi:10.1016/j.fct.2010.08.004.