
 ?Mathematical formulae have been encoded as MathML and are displayed in this HTML version using MathJax in order to improve their display. Uncheck the box to turn MathJax off. This feature requires Javascript. Click on a formula to zoom.
ABSTRACT
Electrical potential drop (EPD) is a powerful technique to gauge crack depth in many contexts, including fracture, creep and fatigue testing, and in-field NDE, however it has only seen limited use for monitoring pre-crack creep cavitation damage. The authors have previously reported promising results using a combination of AC and DC EPD on large pressure vessel creep tests, even detecting incipient damage. However, that study lacked linkage to the underlying microstructural mechanisms. Here we present the results of a more fundamental creep study using EPD on P91 pressure vessel steel specimens taken from weldments, suffering HAZ-related Type IV cracking. This work confirmed that EPD could detect incipient damage, with ACPD being particularly sensitive to life fraction, but allowed linkage to changes in material properties, such as permeability and resistivity. Discussion of the implications for future off-line (in-field) NDE methods and on-line continuous monitoring of high-temperature plant components is also made.
Introduction
The electrical potential drop (EPD) technique has enjoyed a long history of application for the measurement of crack initiation/growth in metals. Early EPD systems were based on the DC variant (DCPD), but the AC equivalent (ACPD) began to be employed from the 1980’s onwards [Citation1]. The ability to electrically follow crack growth in unattended testing contexts, as well as under environments where clip gauges and optical methods face serious challenges, means that the EPD method (also known as Potential Drop, PD) remains a powerful way to gauge crack dimensions (principally depth) in laboratory-based fracture/fatigue testing [Citation2], and in the continuous monitoring of crack initiation and growth, with time. EPD has also been used for field-based NDE, although the need for good electrical contact (which is often made using sprung pins in a hand-held ‘probe’) is a disadvantage when compared to non-contacting methods such as eddy current or ultrasound inspection.
Using sophisticated noise reduction methods, modern lab-based EPD instruments offer ultimate resolutions below 10 microns of crack growth [Citation3] and have widened their appeal beyond simple cracks, to detect subtle microstructural changes inherent in a wide range of testing situations – including case depth measurement [Citation4], and the incipient damage occurring during creep [Citation5]. Furthermore, the sensitivity of ACPD to the state of stress (strictly strain) in a ferritic metal has widened its appeal to detecting and measuring stress and other strain-related effects [Citation6], notwithstanding the fact that the sensitivity to strain can sometimes also complicate the use of ACPD for routine materials testing (such as for the measurement of fracture toughness). Clearly, such a sensitivity to strain should also have implications when ACPD is used to measure and follow creep damage.
The use of EPD for creep-based studies relies upon the fact that many of the factors associated with the early stages of creep in metals, such as the development of plastic strain, and the formation and eventual coalescence of cavities, are likely to affect EPD signals. However, EPD is usually employed to detect cracking per se – so finds most use when much of the creep lifetime of a specimen or component has been expended. A previous paper by the authors [Citation5] showed how this restrictive view of EPD can be expanded – and that changes in EPD, due to pre-cracking creep damage, can be detected well before any major flaws develop. Such changes in EPD are normally subtle – but by employing continuous monitoring (as opposed to spot-checking at outages), in conjunction with other methods, these were detectable. The work undertaken in the study was on large diameter welded P91 and P92 pressure vessels undergoing long-term (ca. 10,000 h) creep testing at elevated temperature and pressure (ca. 650°C), with the aim of comparing online EPD measurements with offline techniques such as ultrasound and surface replication. This work pioneered the use of simultaneous AC and DCPD in a synergistic methodology that aimed to combine the benefits of each EPD variant and so raise the confidence that observed signal changes were due to creep degradation, and not to other factors. So successful was this methodology, however, that in addition to easily detecting end-of life sub-surface cracking (often several weeks in advance of catastrophic failure) it was also possible to detect much more subtle changes in the AC and DCPD (several orders of magnitude less than that due to cracking) months ahead of failure. At that time, these changes were ascribed to unknown phenomena – with the strong belief that they were nevertheless responses to some form of incipient damage associated with creep of the P91 and P92 steel, such as the development of creep cavitation.
Clearly more controlled laboratory testing, preferably interrupted, was required to determine the underlying phenomena responsible for the changes in AC and DCPD and, with this in mind, a programme of EPD studies was initiated as part of wider research with several academic and industrial partners to better understand creep in P91 (particularly weldments) with the ultimate aim of delivering improved on-line and off-line NDE methods for remaining lifetime prediction. This paper only details the results of the EPD studies, draws some interesting conclusions, and offers valuable recommendations for future EPD/creep-related research, and plant demonstrations, both off-line and on-line. Results for the other NDE methods and techniques are mentioned briefly for comparison, but are reported elsewhere [Citation7].
Background
In essence, EPD relies upon a measurement of a specimen’s electrical impedance. In the case of DCPD, this translates specifically into the electrical resistance, but in ACPD, capacitive and inductive components can join the electrical resistance to generate a more complex response [Citation6]. For accurate measurements on materials of good electrical conductivity, impedance is normally measured using a 4-point arrangement of in-line electrical contacts, with the outer two connections delivering the excitation current, and the inner two allowing measurement of the potential drop, (between these two inner connections), as required to drive the excitation current through the specimen – this being directly related to the specimen’s local impedance. Normally, crack-like defects act to increase the local impedance, and therefore can be detected by a rise in the local EPD. Measurements are usually simplified by ensuring that the excitation current is known and remains constant.
A major difference between DCPD and ACPD is the latter’s reliance upon the so-called ‘skin effect’, where the excitation current is found to travel close to the surface of the specimen, rather than uniformly throughout its cross-section, as in DCPD. A practical consequence of this phenomenon is that the calibration methodology (EPD vs crack depth) is different for ACPD, as compared to DCPD. The skin effect results in the ‘skin-depth’ – the depth to which most of the current penetrates – being a function of the frequency of the AC excitation. The higher the frequency, the smaller the skin depth, and the more ‘specific’ the technique becomes to surface breaking defects (in theory). If the same absolute excitation current is applied, then, ACPD further benefits over DCPD, because the skin effect raises the local current density – so increasing signal magnitudes.
This behaviour has meant that ACPD is regarded (unless used at very low frequencies) as being insensitive to sub-surface defects – hence would not be expected to detect bulk creep cavitation, unless this was close to the specimen surface. In contrast, DCPD can probe the specimen’s bulk but at the expense of current density (for a given value of excitation current) – so again is unlikely to be able to detect exceptionally subtle changes in specimen resistance.
Thankfully, previous work [Citation5] has shown that with careful experimentation, and attention to detail, both methods are able to detect changes associated with creep damage. Furthermore, the depth penetration of ACPD is now regarded as being sufficient to ‘see’ defects at depths exceeding the skin depth. This is most probably a consequence of the better instrumentation that is available to researchers nowadays, matched to the use of the equipment in a continuous on-line sense – rather than employing off-line measurements. In the former, gradual changes are being detected, whereas in the latter such changes are often dominated by experimental variables such as temperature, the state of elastic and plastic strain in the material, and random effects such as surface condition, contact location and contact placement. The on-line results, cited above, will not be reviewed here in detail, but over the period of the test duration (ca. 10k hrs, 1 year+) typical DCPD signals were seen to gradually rise by less than 5% (upon absolute levels) usually after a small drop in the first few weeks of monitoring, whilst ACPD fell by a similar amount, from the start of testing. In contrast, both signals would eventually (and rapidly) rise by several 100% when an internal crack/defect finally developed and propagated to a failure condition.
Given the nature of the work presented here, i.e. creep testing of standard laboratory specimens, online measurements were not attempted. Instead, multi-specimen creep testing (and/or interrupted creep testing) was undertaken so that a variety of characterisation methods could be employed simultaneously – and done so at regular intervals throughout the expected lifetime of the material. This interrupted testing methodology was expected to inevitably introduce inter-specimen differences and thus to prove very challenging for EPD in whatever form employed. The dichotomy here was simple – previous studies had shown that sensitivity to early-stage creep damage could be observed by monitoring EPD continuously, but in order to associate those changes with fundamental creep mechanisms, interrupted EPD measurements had to be made – so adding to the ‘noise’ in the measurement process – potentially to the extent that absolute (and statistically significant) EPD changes would no longer be detectable.
Practical details
The test specimens were prepared (and creep tested) by our research partners and consisted of P91 material cut from a large (160 mm plate) demonstration pressure vessel multi-pass weldment, so as to contain 50% base metal and 50% weld metal, with the associated main heat affected zone (HAZ) located approximately mid-span along the specimen long axis and loading direction. Failure was expected to initiate in the HAZ of the welds by Type IV cracking and it was these vulnerable zones that were monitored by the EPD system in the previous online EPD study [ibid]. Multiple specimens were machined and creep tested, under uniaxial load, at two temperatures (600°C and 620°C) for durations that corresponded to various life fractions. Two repeat specimens per condition were employed (each obtained from different depths in the weld wall thickness, i.e. t/4 and 3 t/4, where ‘t’ is the parent plate thickness). The interrupted specimens were re-machined (to a nominal dimension of 120 × 10 × 4.5 mm) using electrical discharge machining (EDM) to avoid the introduction of surface damage, and polished to generate substantially flat regions of the gauge length, suitable for subsequent characterisation. This was a major programme of creep testing, with specimens being removed from testing and supplied to a range of stakeholders for round-robin testing, with each party using their own mix of characterisation methodologies. A range of characterisation techniques were eventually employed – electromagnetic (EM) tests (e.g. magnetic Barkhausen noise (MBN) and measurements of magnetic permeability), metallography, Transmission Electron Microscopy, and Atomic Force Microscopy, in addition to EPD.
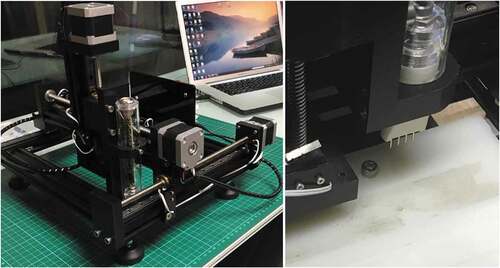
For the EPD electrical connections , the welded stainless-steel stud and soldered silver wire methodology, developed in the previous work [ibid] clearly could not be employed here. Instead, a dedicated X-Y table based on rigid aluminium extruded rails, lead screws and stepper motors was constructed and employed to ‘scan’ the surface of test specimens using a rigidly mounted ‘probe’ head which incorporated the necessary sprung loaded EPD contact pins (rated to be able to pass the 5 A DC excitation current chosen for the tests). Computer software controlled the scanning procedure and, in this way, both area scans and line-scans could be made across the surface of a specimen, either employing DCPD or ACPD. A Z-axis motor allowed the measurement probe to be lifted off the specimen and then repositioned back down for the next reading, once the X-Y translation had been accomplished. shows this general set-up.
Figure 1. Two views of the X-Y EPD scanning table. LHS shows the overall apparatus with measurement probe at centre forward, and RHS shows close up of the four-point probe head. Z axis control, for the sequential offering up of the probe to the specimen, is possible using the stepper motor seen centre top in LHS view
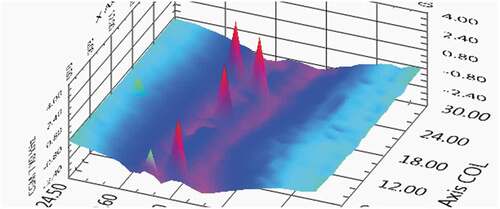
The software allowed ‘fast’ line-scans to be made (but at low resolution in terms of step size – i.e. measurement points per mm) but also slower scans at higher effective resolution. Step sizes ranged from about 1 mm to 0.1 mm with the latter taking up to 10 h to complete a high-resolution line-scan. Full-area scans were also performed to create 3D ‘PD maps’ (see ) but, given the 2D nature of the specimen/test, and the length of time required to acquire a high-resolution scan, only limited areas were probed, using a sequence of parallel line-scans. This enabled a self-consistent set of measurements to be taken across all specimens.
Figure 2. A typical 3d area scan false colour image, with distance as the X-Y axes and the Z axis representing EPD. The peaks are outliers to full-scale which are due to temporary poor connectivity of the sprung pins during a measurement. They are normally removed by post processing
Most ACPD measurements were undertaken at a fixed excitation current frequency of 3 kHz, and at 2 A magnitude. During preliminary multi-frequency testing (and in keeping with the previous on-line study) 3 kHz was chosen because it showed the largest variation in signal magnitudes across typical line-scans – hence was likely to show the greatest sensitivity to microstructural changes. Sensitivity of ACPD is a complex balance of many factors, including the way in which a given material property (for example, magnetic permeability) is affected by frequency, plus issues associated with specimen geometry and skin depth, and even the way in which wires are routed away from the specimen – so it is often easier to run a series of tests at varying frequency to determine the optimum, rather than try to settle upon a frequency per se, from a theoretical viewpoint.
The success of 3 kHz is not immediately obvious from a theoretical basis. At this frequency, the skin depth is estimated to be approximately 0.6 mm (assuming commonly accepted average values of relative permeability of 100 and resistivity of 0.5 μΩm) so only the near-surface region would be probed (although it should be remembered that the ‘accepted’ definition of skin depth is the depth to which the current density has diminished to ca. 37% of its surface value – thus penetration of current beyond the skin depth does still occur). In truth, given that the specimens were relatively thin (4.5 mm thickness), parallel to the scanned surface (see ), any creep damage was likely to be seen equally throughout the specimen cross-section in any case, so the discussion of skin depth is somewhat superfluous. It is most likely that 3 kHz offered the best ‘detectability’ because of a complex interplay between the frequency response of the changes occurring in electromagnetic properties, over time, and the spatial variation in those properties within the specimen.
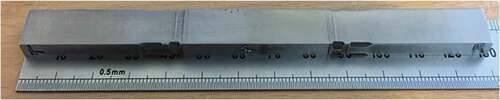
Figure 3. Representative creep test specimen after machining to final dimensions for NDE testing. Original specimen had threaded ends for mounting/loading in the creep testing frame, but these have been machined off to allow unhindered access by a range of testing methodologies to the top surface. Longitudinal direction is defined as along long side (axial to load), transverse as perpendicular to this, along top surface
In terms of frequency, however, a more important point to consider arises should the EPD methodology ever be transferred to ‘working’ thick section welds, in the field – where the lack of theoretical depth penetration, inherent in ACPD, will pose a strong limitation for EPD, and indeed almost all EM techniques employed, in which frequency is an influential parameter. Further discussion of this aspect is given below.
In addition to having an amplitude, ACPD signals contain phase information, hence can be resolved into vectors representing the real (in this case, resistive) and the imaginary (capacitive and inductive) components of a signal. The multi-frequency (10 Hz-500 kHz) ACPD system utilised (CGM-7, Matelect Ltd, Harefield, UK) was capable of providing both real and imaginary components of the ACPD readings. Under ‘ideal’ conditions the resistive component is related to crack depth through a substantially linear relationship, whereas the imaginary component tends to be ignored in conventional ACPD. The imaginary component does help optimise the measurement set-up, however. If the value of the imaginary component is large, then this could compromise the validity of the resistive component via saturation of the amplifiers in the ACPD instrumentation. Thus, minimising the imaginary component (for example, by careful attention to lead placement and employing twisted pairs for the wiring), is always advisable.
For the DCPD measurements, a pulsed DCPD system was employed (DCM-2, Matelect Ltd, Harefield, UK). In contrast to ACPD, for any given specimen, direct currents of ca. 50 A are sometimes required for comparable signal magnitudes, and this often poses significant practical issues. High currents can cause specimen heating and this can lead to drift in DC signals, especially for metals with a high temperature coefficient of resistivity. Pulsing the current overcomes this to a certain extent, but such drift is conventionally compensated for by mathematical normalisation using a second (simultaneous) ‘reference’ DCPD measurement – usually across a region that is not expected to show cracking or defects. Given the specimen geometry, and linear scanning methodology, conventional methods of referencing were not possible, nor was referencing deemed necessary given that the test variables normally warranting the use of a reference (such as temperature, or excitation current) were largely held constant. Additionally, it was not practical to feed 50 A through the connection points (see more below), so 5 A was chosen as the optimum DC excitation current.
Results and analysis
Only the EPD results are reported here, but parallels are drawn with other techniques wherever appropriate. We first discuss the DCPD results, which were promising but ultimately not as impressive as those for ACPD. This has some important implications for future work, and transfer of the technology to an NDE setting, which are discussed later.
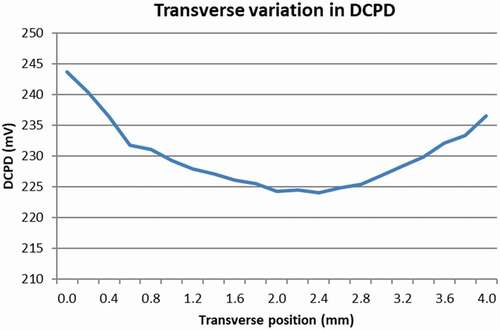
One of the most obvious (and unexpected in magnitude) observations from the DCPD scans was the substantial variation of DCPD seen transversely across the specimen (as distinct from longitudinally, along the specimen axis, parallel to the load direction, and traversing the HAZ). Thus, perpendicular to the specimen long axis, the DCPD rose to a maximum at each extreme edge (see ). This is obviously an effect of the constraint that the edge presents to the flowing current (which, in an infinite specimen, like a large component, would otherwise continue to spread past the measurement line). Such a constraint ‘bunches-up’ the current, raising its local density and thus the measured DCPD. The magnitude of this rise was far greater than the observed longitudinal variations in DCPD – so it was critical that line-scans were always taken along the same long-axis line – and that this did not vary (transversely) from specimen to specimen. Accordingly, a jig was developed to hold the line of the specimen constant – but this assumed all specimens were of similar breadth.
Figure 4. Amplified surface DCPD plotted against distance across the specimen breadth (i.e. perpendicular to the longitudinal and loading axis). The longitudinal centre-line of the specimen lies at the minima of the plot, and the transverse distance probed extends approximately 2 mm either side of this line. DCPD is the average of transverse plots at 400 different locations along the longitudinal specimen axis
Given this transverse variation, to ensure results were comparable between specimens, many line-scans were taken along, and either side, of the geometric long axis of the specimen, to cover an area over the central section of the specimen’s surface. Post-processing of the data sought to locate the line-scan with the lowest average value, and assign this to the specimen ‘centre-line’. A set number of line-scans above and below this line were then included in the calculation of an overall average – in order to reduce the ‘noise’ in the signal. Typically, over a 4 × 0.8 mm area, 120 datapoints were used to create a moving average during post processing of the data.
Taking multiple line-scans naturally lengthened the EPD testing durations, but also posed as a salutary reminder that variations in geometry and positioning of ‘probes’ between off-line NDE inspections could easily scupper any attempt at detecting subtle variations in EPD between outages – as suggested earlier. Some form of probe position ‘registration’ must be employed in other words, in any practical NDE context.
ACPD line-scans were also found to be prone to transverse variations, so similar care and procedures were applied. With an improved probe design, the authors believe that such ‘edge’ effects could almost certainly be eliminated, if not for DCPD, certainly for ACPD, given that the latter offers some control over the injected excitation current distribution in a conductor [Citation3].
shows some selected DCPD line-scan data (averaged over several line-scans at different lateral positions, along the long axis – see figure caption for details) for three conditions – virgin material (as cut from the weldments), and that creep tested at 620°C and 600°C, for 400 and 500 hours respectively (corresponding to a life fraction of 19% and 6% respectively). The ‘cr-xx’ designations were an internal identification system – however the precise loading and temperature conditions, for each specimen, are shown in the legend. Clearly, a step change (rise) can be detected in the DCPD data, when compared to the as-received virgin specimen, and this corresponds to approximately the location of the transition from parent plate to weld metal, and hence the location of the left hand HAZ. The noise in each individual line-scan was substantial but the data has been smoothed using the averaging methodology mentioned above. This need to average the data shows just how sensitive the DCPD readings are to position, and to the fact that each measurement point involves a Z-axis movement of the measurement probe, off and then back on to the specimen – so introducing additional variations in contact quality, and hence in reading.
Figure 5. Line-scans of amplified surface DCPD plotted against distance along the specimen length (i.e. longitudinal and parallel to the loading axis). Each line-scan is averaged from DCPD measurements (in 0.2 mm steps) in a zone extending ± 20 mm either side of the transverse centre line (along specimen length) and ± 2 mm across specimen breadth. Level change (over virgin material) is seen at RHS for both 600 and 620 °C specimens, and begins at left hand HAZ
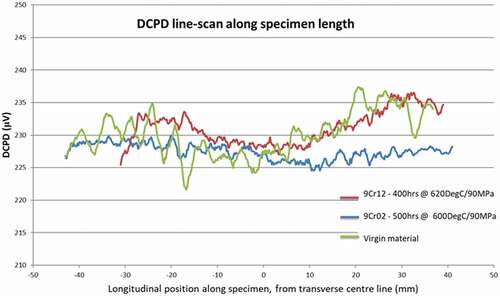
Although these results were promising, follow-on DCPD readings (not shown) for specimens of greater expended lifetime did not show any significant change in the observed step height – although they did show substantial variations in the absolute DCPD values between specimens. Mathematical normalisation to try and tease out a trend did not serve to improve the step height variations, so DCPD was abandoned in favour of the ACPD measurements, which showed greater promise. Longer term, this might prove somewhat unfortunate, as DCPD offers a possible route to creep damage detection at depth – something which ACPD is not supposed to excel at, nor something that we could test for in this largely contrived series of creep experiments. The tests, although designed to help relate signal changes to microstructural effects, somewhat ignore the ultimate goal, which is for a reliable on-site, in-field NDE technique – and one that can cope with specimens of significant thickness as well as defects lying at considerable depth. That said, DCPD did seem to reproducibly detect differences between creep tested and non-tested specimens – and some promising ideas are put forward later, in the discussion, to build on this and enhance the sensitivity of DCPD in any future work of a similar context.
The long-term on-line creep tests on pressure vessels, reported previously [Citation5], saw a definite rise in DCPD, over the test duration (of ca. 10,000 h) – which may tally with the step-changes seen in the DCPD data of . Indeed, this jump was in fact expected to be initially muted (after only 400–500 h of creep testing), as the original on-line data did display a gentle decrease, at the start of the P91 vessel tests, before the beginning of the long-term rise [Citation5]. To explain first a decrease and then an increase in DCPD, from a mechanistic viewpoint, some thought needs to be given to how resistance (or more properly, resistivity) might change during a creep test.
DCPD measurements, given they are inherently resistive in nature, should show sensitivity to the reduction in cross-sectional area (of metal) inherent following a substantial rise in cavitation. This reduction is a natural consequence of cavities appearing and of the specimens being subsequently machined to constant dimensions (so resulting in less metal per unit area for conduction). Although this reduction in area must be minute, the sensitivity of the DCPD instrumentation employed (which has nano-volt resolution) may well be able to detect the changes in electrical resistance that these geometric changes impart. Also, if it is assumed that a random 3D array of cavities is actually a random sequence of 2D cross-sectional arrays (of cavities) then such a sequence is highly likely to present a more contorted geometric path for current flow (hence higher electrical resistance) than a sequence of aligned 2D cavity arrays (which would, in essence be an array of elongated tubes). Thus, the effect of cavitation on the DC resistance would be expected to be even easier to detect than a simple geometric cross-sectional area model might suggest. Whilst this neatly explains the observed long-term rises previously seen in DCPD signals [Citation5] it does not help much with the observed initial decrease cited above. This is much more likely to be an effect of changes in the bulk resistivity of the metal – which is expected to be sensitive to parameters such as dislocation density, grain size, etc. Generally, disruptions in the crystal ordering, such as dislocations, point defects, and grain boundaries would be expected to raise bulk resistivity. Thus, effects that would tend to anneal the metal, would be commensurate with a reduction in DCPD, at least initially.
Turning to the ACPD results, synthesises numerous measurements representing line-scans taken across creep specimens from all the life fractions tested. The x-axis represents the distance along the specimen's long axis (as for ), however, this is now measured from the known position of the major HAZ (plus and minus either side in mm). In contrast to the DCPD data, clear peaks have been detected using ACPD, which apparently correspond to the HAZ. Several scans and other peaks to the RHS side of the principal peak are seen, and this might indicate the ability of ACPD to detect some of the other passes in, (what was) a multiple-pass weld. Care was taken to ensure that the specimens were always oriented with the weld metal to the RHS relative to the centre of the line-scan; however, a variation in longitudinal position of the principal peak can be seen between specimens, in . This was ascribed to a possible error in the exact position of the HAZ.
Figure 6. Line-scans of amplified surface ACPD against distance along specimen length (i.e. longitudinal & hence parallel to loading axis). Each line-scan is the average of ACPD measurements taken in 0.2 mm steps, covering an area in the specimen’s central zone, as for . All line-scans are normalised about 1.0 (V/V) – see text. Major peaks correspond to the left hand HAZ. Further peaks may highlight multiple weld passes
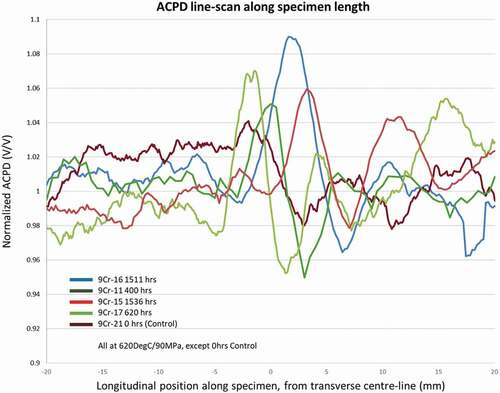
The ACPD data were generally ‘quieter’ than the DCPD readings and required less averaging, but it should be noted that erratic readings had to be removed. An erratic reading is one that usually drives the EPD instrument into saturation, and is most probably caused by poor electrical connection of one of the four pins used in an EPD measurement, usually as a consequence of the build-up of contamination, or via sparking which in turn causes tip oxidation. Given the ACPD instrumentation ‘locks-in’ its EPD measurements to the frequency of the excitation current, it is considered relatively immune to general electrical ‘noise’ in the laboratory.
The data has also been normalised via division of each line-scan against its totalled (i.e. averaged) value, thus eliminating any variations between specimens in the ‘standing’ PD (for example, due to specimen thickness differences, or temperature differences between testing occurrences). The Y-axis is thus plotted around a value of 1.0 (this being the mathematical ratio of an average point, with the overall total average). Most of the line-scans were obtained using a 3 kHz AC excitation frequency (and 2 A RMS current). Some were taken at slightly higher frequencies but have been normalised to take into account any variations in skin depth.
If the peak heights in are considered against the key of specimens in the figure legend, it can be seen that they are in order of expended lifetime, with the highest peaks corresponding to the longest creep exposure times and lowest remaining lifetime. Two of the peaks (specimens 9cr15 and 9cr16) correspond to the same creep exposure time (1500 h) – but have different peak heights – however, the average remains above the next lowest creep exposure result (at 1000 h).
plots the peak heights against the Bell curve determined life fraction for a better view of the way in which the ACPD varies at the HAZ. Clearly, the ACPD peak height is responding to something associated with creep, and in particular something that seemed confined to the HAZ. Cross comparison with the other characterisation techniques employed in the testing programme revealed remarkably similar and comparable trends in some of these, (for example, in peak magnetic Barkhausen noise (mV) [Citation7], which rapidly rises with life fraction and then saturates similarly to the ACPD at around 50% life fraction). Creep cavity volume (as measured by optical microscopy) saw a steady rise in magnitude (from the detection limit) but only from about 3000 h creep exposure (70% lifetime), although AFM-based cavity measurements saw more promising steady rises from around 18% lifetime [Citation8]. It is therefore certainly a possibility that the peak ACPD is responding to variations in cavitation density as the HAZ is traversed.
Figure 7. Major peak height (taken from data in Fig. 6) plotted against Bell curve determined Life Fraction. Peak values are of normalised, not absolute ACPD data
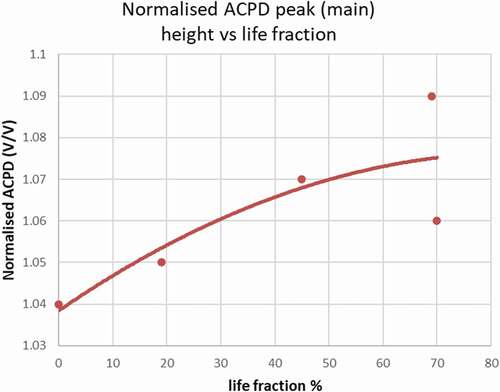
The large variation in peak height for the two specimens at around 70% lifetime is interesting, but definitely reproducible, given the number of line-scans that were performed per specimen. This variation is not, therefore, ascribable to ‘noise’ or similar experimental errors, but must reflect some genuine variation in the specimen microstructure, or creep damage, and associated EM properties. It is possible that the accumulated damage in a weld near to end-of-life has developed in a highly non-linear way, resulting in some specimens exhibiting greater severity of that damage due to differences in their original location in the weld (from which the specimens were extracted).
In addition to creep cavitation (or even rather than), it might be that the ACPD signals are responding to other microstructural or material effects – such as recovery, changes in grain size, or creep strain. The rise in peak height suggests that the change is most pronounced in the HAZ and, given that this is the part of the material that is most vulnerable to creep cavitation, would lend support to the idea that ACPD is responding to cavitation per se. However, if we remain with the issue of strain development – in ferromagnetic materials, the magnitude of an ACPD signal reduces with a rise in stress [Citation6] (both that generating elastic and plastic strain), due to a change in the shape of the internal magnetic domains affecting the magnetic permeability (in the direction of strain). A rise in local (i.e. delta) PD could therefore be ascribed to a reduction in such strain – perhaps through relaxation of elastic residual stresses (caused here by the welding process, and not necessarily completely removed through post-weld heat treatment). Significantly, however, it is well known that the weaker areas of the weld would be expected to see a rise in local plastic strain during a prolonged creep test, not a fall, which again suggests that the ACPD is fundamentally responding to creep cavitation. Thus, if a strain effect on the ACPD is present, it seems to be totally swamped by that due to cavitation.
In contrast, if the absolute ACPD is considered (see ) exactly the opposite effect is seen – the absolute ACPD (calculated as an average of complete line-scans, and so inclusive of all peaks) drops steadily with life fraction. This is far more in keeping with the observed steady drop in ACPD that was seen in on-line monitoring of pressure vessels by the authors, as cited previously [Citation5]. In those tests, the measurement locations were fixed, and completely straddled the HAZ location – so generating a similar ‘average’ to the one presented in . Measurements of magnetic permeability conducted by partner researchers (and reported elsewhere [Citation7]) showed a similar response – with the permeability dropping almost immediately with life fraction, and then reaching a minimum at about 50% of life. Remarkably, the close correspondence between these magnetic permeability results and absolute ACPD was also carried across to the 620°C specimens which showed a subsequent (and unexpected) final rise in both the permeability and the ACPD, towards the expected end of life and 100% life fraction.
Figure 8. Absolute amplified ACPD (volts) vs life fraction. Data is calculated from Fig. 6. Each line-scan is averaged (including all peaks) along the entire length of scan, to obtain a single ACPD value. The higher creep test temperature reveals a modified response at higher life fractions. Results, from two different depths in the original weld, are very similar suggesting creep behaviour is not localised vertically
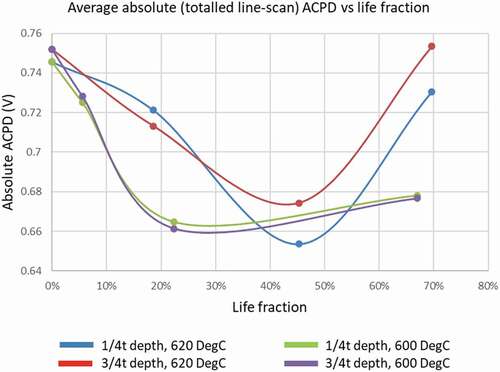
also reveals that the ACPD response does not vary significantly between specimens that have undergone the same creep test but have been obtained from different parts of the original weld. Although variations were not expected in this respect, (given that creep behaviour is likely to be dominated by microstructure and given the specimens were cut from different depths, but still centred on the HAZ, so would have contained similar microstructures), it did reinforce the belief that the ACPD was responding to damage induced by creep, presumably on the material’s permeability.
The fundamental origin of the change in permeability is not currently understood, nor was it investigated, but with respect to the observed correspondence between it and the ACPD, this can be easily understood by reference to the skin effect, which sees an increase in the skin depth with a decrease in permeability (according to EquationEquation 1)(1)
(1) and hence a reduction in the current density, and a corresponding reduction in measured potential drop.
where d = skin depth, ρ = resistivity, μ = magnetic permeability, and f = frequency. For mild steel, under undeformed conditions, d is approximately 0.6 mm at 3 kHz, assuming commonly accepted average values of the relative permeability of 100 and resistivity of 0.5 μΩm.
The expectation, of course, is that strain is yet again implicated in these changes – in this case global strain as seen throughout the specimen, as a function of global (rather than local) creep deformation. This matches well with the original on-line data [Citation5] which saw a steady reduction in ACPD over many months – before rapidly rising at failure, and where simultaneous measurements of strain, using high-temperature strain gauges placed over several points on the pressure vessel’s surface, also registered commensurate rises in global strain, as expected as part of the normal creep behaviour of such vessels.
Discussion, conclusion and implications
The work presented here succeeded in shedding more light upon the possible microstructural and nano-level mechanisms affecting EPD during creep – and backing up some of the observations and assertions made over the on-line practical pressure vessel tests conducted previously [ibid]. This was a major deficiency of the previous work.
Unfortunately, the DCPD results failed to provide much evidence of a change that tracked life fraction. As discussed previously, if this is not addressed, this has implications for the use of DCPD in creep testing applications – particularly those involving creep damage that takes place sub-surface (where DCPD would be expected to excel over ACPD). In truth, the DCPD results obtained under previous long-term (on-line) monitoring showed (all considered) far more promise than the corresponding ACPD data – a fact that prompted the present study into the inherent background mechanisms of the changes seen. It can be concluded therefore, that the present DCPD testing environment and set-up was simply not as good as it could have been – but should be capable of being improved to the point where changes in the DCPD (when measured in an off-line context) can be reliably detected. One of the most obvious improvements that can be made is to rotate the plane of the four DCPD sprung contacts by 90 degrees so that it lies perpendicular to the specimen long-axis and thus perpendicular to the direction of traverse by the XY probe head, and along the line of the HAZ. Although this is somewhat counter-intuitive to how EPD measurements are normally made (they always tend to straddle defects), this simple expedient would ensure that more of the HAZ per unit mm is ‘probed’ (assuming a weld is along a continuous line), and hence any subtle difference in resistivity could be more readily detected. It is clear from the results that this is now the only way of ensuring that off-line DCPD can ‘see’ the subtle level of change that hitherto has been detectable using continuous (on-line) monitoring.
The ACPD technique seemed to cope far better when employed in a conventional manner (i.e. with ‘in-line’ contacts) and was able to detect the drop in absolute level with fractional lifetime, first seen in the on-line tests. Furthermore, ACPD could detect lateral differences in the potential drop that corresponded to known parts of the weld region, and importantly, also showed that the magnitudes of these effects were influenced by remaining life. Both the drop in absolute ACPD and the rise in differential ACPD (as measured along a line-scan) seemed to correlate to measurements of other parameters made by research partners using other EM characterisation methods. This is not entirely surprising, given that ACPD is also an EM technique, by definition, and is likely therefore to be affected by changes in similar material properties to those driving other EM measurements.
It is highly probable that both the EPD measurements and the other EM data are responding to either the development and build-up of cavitation (which could affect the electrical resistance in a purely geometric manner), or to changes in the EM properties such as magnetic permeability (when considering ACPD) – and, in particular, to how these properties are influenced by the state of strain in metals.
Given the likely influence of strain, it is therefore important to make a distinction between absolute ACPD and peak ACPD (delta ACPD), and to note that they both should be influenced by strain effects – with the absolute ACPD being associated with global changes and the delta ACPD to more localised differential strain effects (although the belief here, was that the effect on the ACPD of local cavitation dominated over local strain).
Whatever the underlying physics (and it is clear that more targeted testing is required to better understand these), the link between the on-line and off-line data now seems convincing and this will allow the on-line set-up to be better optimised for sensitivity to changes associated with creep lifetime. This will especially be the case for DCPD (or low-frequency ACPD) which seems to offer the only way forward if high wall thicknesses are to be probed for damage (both on and off-line) and/or creep damage is localised sub-surface – but also if back face (i.e. internal) damage is to be detected from front face inspection. Low-frequency ACPD may offer a compromise approach, and there may well be an optimum frequency for such measurements. Further work is planned to determine if this is the case. Frequency scanning is another approach that would allow the benefits of both methods to be combined in one instrument – an important consideration if a form of the methodology presented here is to succeed in operational field and NDE applications.
One aspect that has not been covered here, is that of calibration and how the changes that have been detected are likely to vary across different steels and indeed different metals. The possibility is that large variations in response will exist even within ferritic materials (non-ferritics are likely to behave very differently) – and that these will need to be compensated for before a reliable material independent NDE methodology can be trialled. In this respect, DCPD again offers a way forward, as it responds only to resistivity variations, and is not affected by the non-linear EM properties which influence ACPD. Additionally, a factor of particular concern for calibration (but ironically one that is probably responsible for the apparent success of ACPD at detecting life fraction-related change) is stress – with this being directly related to the strain in the system – and thus influenced by both residual strains and those induced by the creep process itself.
For now, it remains encouraging that a simple EM technique, that is over half a century old, can readily generate a response that varies with fractional lifetime under creep conditions in ferritic metals.
Acknowledgments
The authors would like to thank Dr D Robertson of ETD Consulting of Leatherhead, UK, for his help and support in undertaking the work described here, to Dr Y Hasegawa of Nippon Steel Corporation, Japan, for access to the all-important creep specimens, as well as Dr J Wilson and Prof. A Peyton, University of Manchester, UK, for sight of their EM results, and to Dr D Allen, of ETD Consulting, for life-fraction data and his ever helpful and perceptive advice.
Disclosure statement
No potential conflict of interest was reported by the author(s).
References
- Venkatsubramanian TV, Unvala BA. An AC potential drop system for monitoring crack length. J Phys E: Sci Instrum. 1985;17(9):765–771.
- Gibson GP. The use of alternating current potential drop for measuring J-crack resistance curves. Eng Fract Mech. 1987;26(2):213–222.
- Wojcik AG. Potential drop techniques for crack characterisation. Materials World. 1995;3(8):379–381.
- Bowler JR, Huang Y, Sun H, et al. Alternating current potential-drop measurement of the depth of case hardening in steel rods. Meas SciTechnol. 2008;19(7):075204.
- Wojcik A, Waitt M, Santos AS. The use of the potential drop technique for creep damage monitoring and end of life warning for high temperature components. Mater High Temp. 2017;34(5–6):458–465.
- Okumura N, Venkatasubramanian TV, Unvala BA, et al. Application of the AC potential drop technique to the determination of R curves of tough ferritic steels. Eng Fract Mech. 1981;14(3):617–625.
- Wilson W, Peyton A, Allen D, et al., (2020), The development of an Electromagnetic (EM) Sensor technique for creep damage detection and assessment, Proceedings of the MIMA Conference, ETD Ltd.
- Shibli A, (2019), Further developments in inspection and monitoring techniques for high temperature plant, Proceedings of the EPERC Conference, Rome, 1-3 Apr. 2019.