
ABSTRACT
The results are presented on the oxidation behaviour of two chromia-forming steels, over the temperature range 800°C to 900°C, regions of premature localised breakaway oxidation were observed. SiO2 formation along emergent grain boundaries encapsulated smaller grains, acting as diffusion barriers to the replenishment of chromium from deeper in the alloy. Rapid depletion of chromium from these isolated grains continued with increasing time until the concentration was insufficient to maintain a protective Cr2O3 resulting in the localised chemical failure and formation of breakaway oxides. A finite difference model was used to demonstrate the effect of SiO2 formation. It was also found that the low concentration of silicon restricted the encapsulation process to only the smaller grains at the surface and protective oxidation was re-established underneath at the alloy surface. The predicted lifetime of components with wall thicknesses of 2 mm was calculated to be in excess of 30 years.
Introduction
High chromium steels are used in applications over the temperature range of 600°C to 900°C where a surface oxide scale of Cr2O3 forms, providing the alloys with the optimum oxidation protection. To ensure a complete layer of Cr2O3 forms at the surface a minimum concentration of chromium is need in the alloy, CrCrit, ranging from 9 to 12 wt.% depending on the oxidising environments [Citation1–5]. To enable the early establishment of the Cr2O3 secondary elements, such as Si, can be included in the alloy, where the more thermodynamically favourable SiO2 provides the nucleation sites for the Cr2O3 [Citation5–10]. Similarly, selective oxidation under controlled pO2 conditions has also been found to preferentially form Cr2O3 across the surface on steels [Citation6,Citation8,Citation11,Citation12]. The oxidation process depletes the alloy of chromium from the region adjacent to the oxidising surface with replenishment occurring by diffusion from deeper in the bulk alloy [Citation13,Citation14]. To maintain the protectiveness of the surface Cr2O3, the oxide much continue to grow and further depleting the alloy of chromium. When the concentration of chromium in the alloy, adjacent to the oxidising surface, falls below CrCrit the protection can no long be maintained and breakaway oxidation ensues with the formation of mixed oxides, as described in references [Citation4,Citation5,Citation15].
Modelling the oxidation processes can be achieved by balancing the rate at which the oxidising element is removed to the diffusion rate of that element from deeper within the alloy. This has been achieved by a number of authors for relatively simple alloy systems [Citation4,Citation5,Citation16–19], and computational models have been produced by some researchers with examples of a few given in refs [Citation20–24]. The approach used by Evans et al. [Citation23,Citation24] is employed in this study. This model determines the removal rate of the oxidising element from the oxidation kinetics for a single oxide species, and assumes the oxide is formed at the surface of an alloy, i.e. no internal oxidation is occurring. The diffusion rates, for the replenishment process, are readily available in the open literature, applicable to single or even dual phase alloy. These input parameters reflect the oxidation conditions of the thermal exposure. The dimensions of the component are also included within the model as this represents the reservoir of the elemental species. The outputs are in the form of elemental compositional profiles into the alloy for the oxidising element at selected times. Such predictions, e.g. on the time it takes for an element to be depleted from a component to some critical concentration, are very useful to alloy manufacturers and plant managers, informing of the time periods for plant shut down and replacement of components.
Generally, for steels operating within the temperature range of 600°C to 900°C, the higher the starting concentration of chromium the longer will be the lifetime of any component. Upper limits to the starting concentration can be dependent on the impact of that element on the microstructure and mechanical integrity of the alloy system, with the formation of adverse phases needing to be avoided. Another method of ensuring long life-times is to produce components of sizes and wall thicknesses which provide a sufficient reservoir of the oxidation protective element. In this way, the reservoir of the element present enables the required lifetime to be achieved without compromising the chemistry, microstructure or mechanical properties of the component.
High chromium steels, SS304 and SS316, are used in a prototype plant capable of taking in hard-to-recycle, mixed end-of-life, waste plastics (including films, crisp packets and food trays) and generating a valuable hydrocarbon product, Plaxx®. The company, Recycling Technologies, is currently engaged in developing this unique process for industrial deployment; scaling it up from their existing demonstration plant and controlling the output product to maintain quality for customers. As part of this development detailed examination has been made of materials from a number of locations in the plant. In this paper, the results from examination of samples of the alloys exposed under laboratory testing conditions are presented. The model ODIN [Citation23,Citation24] is used to demonstrate the depletion processes and to provide lifetime predictions for plant components.
Experimental procedures
Tube sections of the alloys were provided by Recycling Technologies in the condition used to construct the plant. These tubes had been subjected to the usual manufacturing processes including heat treatments and surface treatments and the dimensions are given in .
Table 1. Dimension of tube sections of alloys supplied.
The compositions of the alloys investigated were determined using Energy Dispersive Spectroscopy (EDS) and are given in . The values obtained were within the specifications for these alloys [Citation25–28]. To assess the oxidation behaviour of the alloys, samples of approximate dimensions 20 mm by 20 mm were extracted from the tubes. The inner and outer surface of the samples were left in the as-produced condition and burrs, etc., produced during the sectioning procedure, were removed and the edges chamfered to reduce stress concentrators. The samples were measured and weighed for identification purposes and ultrasonically cleaned in ethanol. For oxidation testing, the samples were positioned in alumina boats and placed into hot furnaces set at 800°C, 850°C or 900°C for isothermal exposure times of up to 2000 hours. Testing was conducted in laboratory air which corresponds to the exposure conditions experienced at the outer surface of the tubes in plant. The partial pressure of oxygen within the plant has been measured as approximately 0.06 atm in nitrogen. An investigation into the effect of this slight reduction in pO2 on the oxidation behaviour of the alloys [Citation29,Citation30] showed that no change in the oxide composition was predicted and thus the results obtained under air exposure will correspond to that occurring to the inside of the tubes.
Table 2. Compositional range of alloys, from EDS analysis, taken from the inner surfaces and cross-sections of the tube samples.
On completion of the thermal exposures the samples were removed from the furnaces and cooled in laboratory air, Ni-plated and mounted in resin. The cross-sections through the samples were revealed by grinding on SiC paper from 240 to 1200 grit with water as a lubricant followed by polishing using 6 µm and then 1 µm diamond suspension in a water-based lubricant and finished with a silica sol. The cross-sections were examined using a Scanning Electron Microscope (SEM) equipped with Energy Dispersive Spectroscopy (EDS). Examination of the surfaces of the alloys in the as-received condition was also performed.
Results
The surfaces of interest in this study were those in contact with the oxidising environments in plant and this included both the inner and outer surfaces of the tubes. The images of these surfaces, for both the SS304 and SS316 alloys, revealed the result of the pickling process used to remove the oxides formed on the surface of components during the manufacturing procedures, . During production, heat treatments are used to relieve stresses and generate the required grain size and microstructure. The pickling process removed unwanted oxides, etc., formed during these processes and preferentially etched the grain boundary regions resulting in the uneven topography observed in the images. The outer surfaces of all samples showed a similar effect from the etchant with additional marks and abrasions caused during standard handling and transport of the tubes. These abrasions left superficial damage only, none of which appeared to penetrate into the component. No damage to the inner surfaces of the tubes was noted on the sections extracted.
Figure 1. SEM images of surfaces of inner and outer surfaces of SS 304 (a and b, respectively) and similarly for SS 316 (c and d), showing the effect of pickling on the surface with preferential etching of the grain boundaries. Abrasive damage was also present on the outer surfaces (b and d) occurring during standard handling and transportation.
Examination of cross-sections through the two alloys in the as-received condition, , revealed the topology of the surface resulting from the pickling process. EDS analysis taken from the cross-sections showed that the composition fell within the range reported for these alloy types [Citation25–28] as presented in . EDS profiles taken from various sites on the cross-sections showed flat composition profiles including at grain boundary regions. Thus, the composition of the oxidising surfaces was that of the bulk alloy.
Figure 2. Back scattered SEM images through (a) 304 and (b) 316 revealing the contours of the inner surface of the tubes created by the pickling process.
After thermal exposure the cross-sections through the samples showed the formation of two distinct oxide morphologies covering the surfaces, identifiable by thickness, . This was the case for the inner and the outer surfaces of the samples on both alloys with no obvious difference in oxide formation related to alloy composition or surface. The thicker oxides contained a higher proportion of porosity. Also present in both alloys was the formation of darker contrast oxide penetrating along grain boundaries.
Figure 3. BSE images of cross-sections showing (a) the outer surface of a sample of SS 304 exposed to 850 °C for 4 × 100 hours, (b) the outer surface of a sample of SS 316 exposed to 900 °C for 200 hours, (c) the inner surface of a sample of SS304 exposed to 900 °C for 200 hours, and (d) the inner surface of a sample of SS316 exposed to 900 °C for 200 hours, showing the darker contrast oxides at the outer surface of the alloy protected by the Ni-plate. The thickness of the surface oxide varied across the surface of the sample and penetration of an oxide into the alloy along the grain boundaries had occurred.
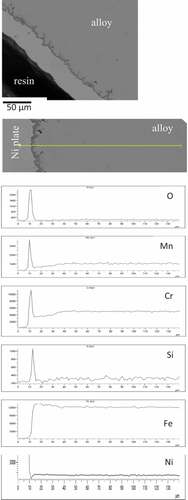
EDS maps showing the relative compositions of the elements present in the two distinguishable surface oxide regions are shown in for the alloy SS304 exposed to 900°C for 200 hours. In all cases, it was found that the regions of thinnest oxides were predominantly Cr2O3 with discontinuous regions of manganese oxide, also possibly present as a (Cr,Mn)3O4 spinel. The thicker islands of oxide consisted of varying concentrations of iron, chromium and manganese with no obvious presence of NiO found. It was noted that a layer of oxide rich in chromium had formed adjacent to the alloy underneath these thicker oxides. Manganese was present in higher relative concentrations within the thinner oxide regions compared to the thicker oxide regions. Evidence of SiO2 was found at the surface of the alloys underneath the Cr2O3 and also at the grain boundaries showing that internal oxidation of this element had occurred. As can be seen in the smaller grains, in the order of 20 μm diameter, were completely encased in SiO2. The EDS maps also showed depletion of chromium and manganese from the underlying alloy most notably from the grain boundary regions indicating these as faster diffusion routes from deeper in the alloy to the surface maintaining of the protective chromium and manganese surface oxides.
Figure 4. BSE image with EDS maps for the major constituents of SS304 exposed to 900 °C for 200 hours showing the location of the surface oxide from the oxygen map, a continuous surface oxide rich in Cr adjacent to the alloy and islands of thicker oxides containing Fe, Mn and Cr; no obvious presence of NiO was found. Internal oxidation of Si had occurred, forming predominantly at the alloy grain boundaries. Smaller grains of the alloy were encased in the SiO2. Depletion of Cr was observed at the grain boundaries indicating faster diffusion occurring at these sites.
EDS line scans were taken at multiple sites for a wide range of thermal exposures and times. The results, shown in for the alloy SS304 exposed at 850°C for a total of 400 hours, revealed that the composition of the thin oxide was predominantly chromium with manganese and an underlying layer of silicon at the interface with the alloy. Depletion depths for chromium and manganese were between measured as 25–30 μm underneath the thin-oxide regions, for the example given in . The depletion depth for silicon was less clear due to the low concentration of this element in the alloy and the high diffusion rates [Citation18]. Slight enhancement of the concentration of iron was seen in the alloy within 30 μm of the surface which is indicative of a selective oxidation process leading to the formation of a protective oxide at the surface. There is also a clear demarcation between the oxide and the alloy for iron and nickel demonstrating that oxides of these elements had not occurred. The results show that at the sites where thin chromium-rich oxides had formed, protective oxidation behaviour had been achieved. This was facilitated by the low rate of diffusion through the oxide and the sufficiently high diffusion rate of chromium in the alloy.
Figure 5. Compositional profiles obtained from a sample of SS304 after a total of 400 hours thermal exposure at 850 °C showing the formation of a surface oxide of chromium and manganese with a layer of SiO2 at the interface with the alloy. Depletion of these elements had occurred from the alloy with enhancement of iron demonstrating protective oxidation at these sites.
A similar examination was performed on regions of the alloys where thicker oxide layers had formed, with an example taken from the alloy SS304 sample exposed to 850°C for 800 hours given in . EDS line scans through the oxide showed multiple elements present with chromium dominating at the outer and inner regions. As with the thinner sections of oxide, manganese was also present in the oxide layer. Iron-rich oxides were also present within the oxide layer with the EDS profiles indicating that a number of oxides have formed with varying amounts of iron, chromium and manganese. The ratios of the elements present suggest that the surface oxide consisted of Cr2O3, an iron oxide and an iron/chromium/manganese spinel. The chromium-rich oxide adjacent to the alloy and the developing depletion profile of chromium in the alloy adjacent to the surface suggests that this oxide has re-established and was providing oxidation protection for the alloy. Also found was a near continuous layer of SiO2 at the interface with the alloy.
Figure 6. BSE image of a cross-section through a sample of SS304 exposed to 850 °C for 800 hours with EDS line scans showing the surface oxide to be of varying composition. Iron oxides are present with a chromium-rich oxide established beneath and a layer of silicon oxide at the alloy interface.
A region of the alloy SS304, exposed at 900°C for 100 hours, where oxide penetration along a grain boundary had occurred and had encapsulated a grain adjacent to the surface is shown in . The analysis of this region showed that the encapsulating oxide was silicon-rich, SiO2, and that the concentration of chromium at the three sites A, B and C indicated in , were 19.2 wt.%, 15.1 wt.%, 12.1 wt.%, respectively. At site A, the concentration of chromium was that of the bulk alloy, . Adjacent to the SiO2 containing grain boundary, the concentration of chromium had reduced demonstrating depletion was occurring with the most likely route being along the grain boundary to the surface. The linescan for chromium, , showed depletion occurring at both of the grain surfaces intersected, and lower concentration within the grain demonstrating that replenishment into this grain from the bulk alloy was not occurring. The SiO2 was thus providing a barrier to replenishment of chromium into the encapsulated grain but not forming a barrier to the diffusion of chromium to the surface via the grain boundaries. Within the encapsulated grain the concentration had reduced to a level close to the Crcrit value necessary to maintain that protectiveness [Citation1–5], thus, this grain is close to the point of going into chemical failure [Citation15]. With longer time at temperature the grain would continue to deplete of chromium and once below the Crcrit concentration chemical failure would ensue with the formation of oxides of all the remaining elements, i.e. breakaway oxidation.
Figure 7. BSE image of a cross-section through a sample of SS304 exposed to 900 °C for 100 hours with EDS line scans showing penetration of silicon oxides along the grain boundary encapsulating a region of the alloy. The concentration of Cr at the three sites indicated in the micrograph are (A) 19.2 wt.%, (B) 15.1 wt.% and (C) 12.1 wt.% showing greater depletion occurring within the encapsulated region.
It was also noted that the number of sites of the thick oxide increased with time and temperature but that the thicknesses did not. This will be discussion in the next section in conjunction with the proposed mechanism responsible for the formation of these regions.
Discussion
The examination of cross-sections through samples of SS304 and SS316 exposed to temperatures in the range of 800°C to 900°C revealed two distinctly different oxidation processes occurring at the surface. One, characterised by the formation of a thin chromium-rich surface oxide, demonstrated the expected protective oxidation behaviour expected from these high chromium containing steels. However, the formation of thick oxides of mixed compositions suggested that localised chemical failure of the alloy has occurred. The cross-sectional examination also revealed the presence of SiO2 at the outer surface and penetrating into the alloys along grain boundaries. The minor alloying additions of silicon to steels has been shown to improve the oxidation resistance [Citation5–10]. SiO2 forms readily due its low free energy of formation and initially forms as an amorphous layer at the surface of the alloy. This layer promotes the early nucleation of Cr2O3 grains accelerating the establishment of this highly protective oxide layer [Citation5,Citation8]. It has been shown that the kinetics of growth of Cr2O3 on a high chromium steel at 900°C is reduced from 11 × 10−5 g2.m−4.s−1 with 0% Si present to 3 x 10⁻⁵ g2.m−4.s−1 by the introduction of approximately 0.7% [Citation10], or 4 × 10⁻¹⁸ m2.s−1 to 1.5 × 10⁻¹⁸ m2.s−1 at 850°C by the introduction of 0.9 wt% Si [Citation7]. It was also shown that increasing the silicon content above these values resulted in a deterioration in the oxidation kinetics increasing to the levels obtained with 0 wt.%.
Grain boundaries offer sites of faster diffusion of chromium to the surface to form Cr2O3 compared to lattice diffusion, as demonstrated by Hansson et al. [Citation31]. This is also the case for silicon and oxygen. In this study, one reason for the localised adverse effect on the oxidation behaviour has been revealed with the development of significant amounts of SiO2 penetrating into the alloys via the grain boundaries. The depth of penetration of the SiO2 was sufficient to encase grains at the surface, . The effect of the pickling process, used to remove oxides formed during the manufacture of the component, preferentially etch the grain boundaries and may play a part in enhancing the encapsulation process. Evidence provided by EDS analysis showed that the concentration of chromium within encapsulated grains decreased rapidly with thermal exposure when compared to adjacent regions of the alloy where encapsulation of grains had not occurring. This demonstrated that the presence of the SiO2 at the grain boundaries was acting as a diffusion barrier to the replenishment of chromium within the grain from the bulk alloy but that chromium continued to diffuse to the surface to form Cr2O3. The low concentration of silicon in the alloys leads to the early depletion of the element in forming SiO2 and thus the encapsulation process as described here is limited by the silicon concentration.
Such diffusionally isolated features have been identified in air plasma-sprayed high temperature resistance MCrAlY coatings, where M is Ni and/or Co [Citation32]. In that work the effect of the formation of stringers of Al2O3, formed at the surface of the MCrAlY particles during the coating process and subsequently incorporated into the coating, was described. On exposure to temperature, 900°C to 1100°C, and where oxygen access into the coating occurred these stringers of Al2O3 continued to grow and acted as barriers to the diffusion of aluminium from deeper in the coating to form a protective Al2O3 surface oxide. The diffusionally isolated regions were termed ‘diffusion cells’. Where the diffusion cells were completely encased in Al2O3 rapid depletion occurred to below Alcrit and chemical failure ensued with the formation of faster growing mixed oxides. The processes described in that earlier work replicates the findings in this study differing only in the oxide formed and the diffusing species.
In the study on diffusion cells in air plasma-sprayed coatings the predicted depletion profiles for aluminium were compared to experimentally determined values. The processes used, of depletion by oxidation balanced with replenishment by diffusion from deeper in the coating or alloy, were subsequently developed into the finite difference model Oxidation, Diffusion and Interdiffusion, ODIN [Citation23,Citation24], as described in the introduction. The model is used here in one dimension to study the depletion process occurring within the tube walls of dimensions given in , and also the diffusionally isolated grains.
The kinetic data for the model was taken from the thin oxide regions in this study, i.e. before chemical failure had occurred, . The values obtained in this way compared well to Cr2O3 formation on similar alloys [Citation7,Citation10]. The starting point for determining the most representative diffusion coefficients of chromium in the steels was taken from the literature [Citation33,Citation34]. The model was run and the elemental profiles were compared to those obtained under this investigation. Minor adaptations to the coefficients were made, included in , in order to more accurately match the elemental profiles in this study, as shown in ) for samples of SS304 exposed at 850 C for 800 and 1500 hours. The prediction, ) showed a good match to the experimental data. The model was used to predict the elemental profiles for chromium in the alloys at extended life-times, up to approximately 300,000 hours (34 years), ). The profiles show the effect of depletion of chromium from the surfaces of a tube of thickness 2 mm. It can be seen that the surface concentration of chromium was maintained at 15 wt.%. The depth of depletion increased with increasing time but for the example presented in ) concentration of chromium at the centre line is maintained at the level in the bulk. The results show that the alloys are predicted to maintain a surface concentration comfortably above Crcrit with a sufficient reservoir of chromium to maintain the Cr2O3 in excess of 300,000 hour or 32 years at 850°C. These profiles will also represent the depletion of chromium occurring underneath the thick mixed oxide regions where it has been shown that rehealing of the surface occurs with the formation of a continuous layer of Cr2O3 at the oxide alloy interface.
Figure 8. (a) Concentration profiles for chromium in SS304 exposed to 850 °C for 800 hours and 1500 hours at the sites of formation of thick surface oxides showing concentration of Cr at the outer region of the alloy at approximately 17 at.% and Cr-rich oxides formed adjacent to the alloy surface with lower concentrations in the outer oxide layers and (b) predicted chromium depletion profile for 1500 hours showing good agreement with experimental data.
Figure 9. Predicted chromium depletion profiles for (a) 2 mm thick section and (b) 25 µm diameter grain, for increasing times at 850 °C demonstrating the protectiveness of the surface Cr2O3 layer and the influence of the size of the reservoir on the time taken to reach CrCrit.
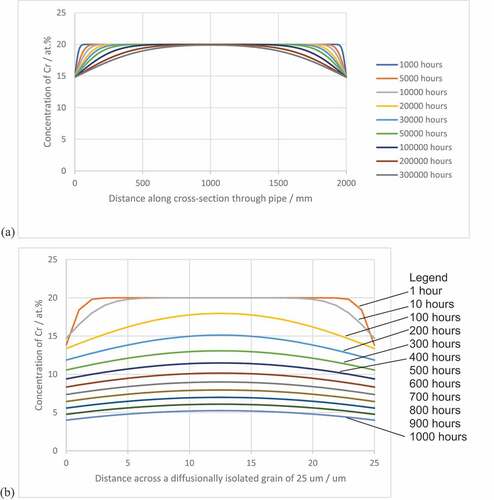
Table 3. Diffusion coefficients for chromium in steels and kinetics of Cr2O3 growth determined for this study.
The model was also run to simulate the depletion processes for a diffusionally isolated grain of diameter 25 µm, ). The profiles for chromium clearly show that accelerated depletion of chromium occurred compared to ). The concentration of chromium at the mid-point falls to 12 at% by 400 hours with the concentration at the surface of the grain as low as 9 at%. At this point, the concentration of chromium is close to the point of chemical failure and further time at temperature will result in breakaway oxidation and the formation of oxides as observed in the cross-sections. It can be appreciated that the smaller the grain the shorter the time to reach this Crcrit concentration. A series of schematic diagrams describing the sequence of events is given in .
Figure 10. Series of schematic diagrams describing the oxide formation and development during exposure of SS304 and SS316 to temperatures ranging from 750 to 900 °C up to approximately 400 hours showing (a) formation of external oxide at the surface of the alloy, (b) internal oxidation of silicon along grain boundaries (g.b), (c) encasement of smaller grains by SiO2 which acts as a diffusion barrier to chromium to maintain protectiveness of surface oxide with subsequent chemical failure of the isolated grain resulting in breakaway oxidation processes, and (d) the potential re-establishment of a protective oxide underneath the non-protective oxides.
In earlier work on a silicon containing high chromium alloy the formation of SiO2 along grain boundaries was also shown but encapsulation and the consequences were not reported [Citation18]. One reason for the difference was the grain size in the alloy in the earlier work which was reported as 100 μm. An additional consideration in the formation of the diffusionally isolated regions formed in this study is the effect of the pickling procedure. This process resulted in the production of a clean, compositionally uniform surface with preferential etching at the grain boundaries. Although the composition at the grain boundary sites was not adversely affected the effect was to reduce the penetration depth of SiO2 required to encapsulate the surface grains. Thus, the resultant topology will accelerate the encapsulation process of the surface grains and also present a larger surface area over which Cr2O3 formation was occurring, accelerating the depletion processes, an observation similar to that observed as occurring on electro-plated MCrAlY coating [Citation35].
Conclusion
Two oxidation processes were observed as occurring at the surface of two high-chromium steels, SS304 and SS 316, containing 20 and 17 wt.% of chromium, respectively. One site exhibited the expected protective oxidation processes with the formation of thin, continuous, dense Cr2O3 with an underlying layer of SiO2. The other site exhibited premature chemical failure, with the formation of mixed oxides. A mechanism has been proposed which attributes the localised formation of the mixed oxides, associated with chemical failure, to the formation of SiO2 along the emergent grain boundaries. Where the penetration of this oxide resulted in encapsulation of the smaller grains of the alloy, this acted as a diffusion barrier preventing replenishment of the depleting chromium to form the surface Cr2O3. The concentration of chromium within the encapsulated grains decreased rapidly to below CrCrit (approximately 12 wt.%) and breakaway oxidation ensued with the formation of the mixed oxides observed. The encapsulation process was found to be self-limiting due to the low starting level of silicon present in the alloys. Sufficient chromium was available in the alloy underneath these regions to reform a protective Cr2O3 layer. The lifetimes of components and the effect of diffusional isolation of grains was demonstrated using a finite difference model. Predictions using this model show that where protective oxidation occurs the times to the onset of chemical failure should be in excess of 30 years for 2 mm thick walled components.
Acknowledgments
The authors acknowledge the support given by Innovate UK in funding via the Smart Grant April 2019 (Application no. 37151, project number 105771), provision of samples and discussions with the staff at Recycling Technologies. Thanks also go to the Centre of Electron Microscopy at the University of Birmingham for technical help and maintenance of equipment.
Disclosure statement
No potential conflict of interest was reported by the author(s).
References
- Whittle DP, Stringer J. VIII. Improvement in properties additives in oxidation resistance. Phil Trans R Soc Load. 1980;A 295:309–329.
- Stott FH. The protective action of oxide scales in gaseous environments at high temperature. Rep Prog Phys. 1987;50:861–913.
- Stott FH, Wood GC, Stringer J. The influence of alloying elements on the development and maintenance of protective scales. Oxid Met. 1995;44(1/2):113–145.
- Vossen JPT, Gawenda P, Rahts K, et al. Limits of the oxidation resistance of several heat-resistant steels under isothermal and cyclic oxidation as well as under creep in air at 650°C. Mat High Temp. 1997;14(4):387–401.
- Bauer R, Baccalaro M, Jeurgens LPH, et al. Oxidation behavior of Fe–25Cr–20Ni–2.8Si during isothermal oxidation at 1,286 K; life-time prediction. Oxid Met. 2008;69:265–285.
- Bainbridge JE, Horsley GW, Cairns JA, et al., UK patent: GB 2 097 821A. Carbon Deposition Inhibition; 1982.
- Evans HE, Hilton DA, Holm RA, et al. Influence of Silicon Additions on the Oxidation Resistance of a Stainless Steel. Oxid Met. 1983;19:1–18.
- Bennett MJ, Desport JA, Labun PA. Analytical electron microscopy of a selective oxide scale formed on 20% Cr-25% Ni-Nb stainless steel. Oxid Met. 1984;22(5/6):291–306.
- Bennett MJ, Desport JA, Labun PA. Transverse microstructure of an oxide scale formed on a 20% Cr-25% Ni-niobium stabilised stainless steel. Math Phy Sci. 1987;412:223–230.
- Lobb RC, Sasse JA, Evans HE. Dependence of oxidation behaviour on Si content of steels. Mat Sci Tech. 1989;5(8):828–834
- Ding R, Taylor MP, Chiu YL, et al. Influence of Pre-oxidation on filamentary carbon deposition on 20Cr25Ni stainless steel. Oxid Met. 2019;91(5–6):589–607.
- Zurek J, Young DJ, Essuman E, et al. Growth and adherence of chromia based surface scales on Ni-base alloys in high- and low-pO2 gases’. Mater Sci Eng A. 2008;447(1–2):259–270.
- Wagner C. Theoretical analysis of the diffusion processes determining the oxidation rate of alloys. J Elect Chem Soc. 1952;99(10):369–380
- Wagner C. Oxidation of alloys involving noble metals. J Elect Chem Soc. 1956;103(10):571–579
- Evans HE, Donaldson AT, Gilmour TC. Mechanisms of breakaway oxidation and application, to a chromia-forming steel. Oxid Met. 1999;52(5/6):379–402.
- Bastow BD, Whittle DP, Wood GC. Alloy depletion profiles resulting from the preferential removal of the less noble metal during alloy oxidation. Oxid Met. 1978;12(5):413–438.
- Nesbitt JA, Heckel RW. Modelling degradation and failure of Ni-Cr-A1 overlay coatings. Thin Solid Films. 1984;119(3):281–290.
- Evans HE, Donaldson AT. Silicon and chromium depletion during the long-term oxidation of thin-sectioned austenitic steel. Oxid Met. 1998;50(5/6):457–475.
- Quadakkers WJ, Bongark K. The prediction of breakaway oxidation for alumina forming ODS alloys using Oxidation Diagrams. Mat Corro. 1994;4(5):232–241.
- Nesbitt JA, Heckel RW. Interdiffusion in Ni-Rich, Ni-Cr-AI Alloys at 1100 and 1200 °C~ Part II. diffusion coefficients and predicted concentration profiles. Met Trans A. 1987;18:2075–2086.
- Nijdam TJ, Jeurgens LPH, Sloof WG. Modelling the thermal oxidation of ternary alloys compositional changes in the alloy and the development of oxide phases. Acta Materialia. 2003;51:5295–5307.
- Chyrkin A, Huczkowski P, Shemet V, et al. Sub-scale depletion and enrichment processes during high temperature oxidation of the nickel base alloys 625 in the temperature range 900-1000 °C. Oxid Met. 2011;75:143–166.
- Pragnell WM, Evans HE. A finite-difference model to predict 2D depletion profiles arising from high temperature oxidation of alloys. Model Simul Mater Sci Eng. 2006;14:733–740.
- Pragnell WM, Evans HE. Chromium Depletion at 2-Dimensional Features during the Selective Oxidation of a 20Cr–25Ni Austenitic Steel. Oxid Met. 2006;66(3/4):209–230.
- Moore P. Stainless steel grade selection. Atlas steels. 2020 , https://www.atlassteels.com.au
- smst_booklet_304_2008.pdf. Salzgitter Mannesmann, 2008. 2020. https://salzgitter-mannesmann-uk.com
- smst_booklet_304l_2008.pdf. Salzgitter Mannesmann, 2008. 2020. https://salzgitter-mannesmann-uk.com
- smst_booklet_304ln_2008.pdf. Salzgitter Mannesmann, 2008. 2020. https://salzgitter-mannesmann-uk.com
- Ellingham HJT. Reducibility of oxides and sulphides in metallurgical processes. J Soc Chem Ind. 1944;63:125–133.
- Richardson FD, Jeffes HEJ. The thermodynamics of substances of interest in iron and steel making from 0 °C to 2400 °C. J Iron Steel Inst. 1948;160:261–273.
- Hansson AN, Hattel JH, Dahl KV, et al. Modelling Cr depletion under a growing Cr2O3 layer on austenitic stainless steel: the influence of grain boundary diffusion Modelling Simul. Mater Sci Eng. 2009;17:1–19.
- Evans HE, Taylor MP. Diffusion cells and chemical failure of MCrAlY bond coats in thermal-barrier coating systems. Oxid Met. 2001;55:17–34.
- Mizouchi M, Yamazaki Y, Iijima Y, et al., Low temperature grain boundary diffusion of chromium in SUS316 and 316L stainless steels. Mat Trans. 2004;45:2945–2950.
- Mehta A, Belova IV, Murch GE, et al. Measurement of interdiffusion and tracer diffusion Coefficients in FCC Co-Cr-Fe-Ni multi-principal element alloy. J Phase Equilib Diffus. 2021;42:696–707.
- Taylor MP, Pragnell WM, Evans HE. The influence of bond coat surface roughness on chemical failure and delamination in TBC systems. Mat Corro. 2008;59:508–513.