
ABSTRACT
Global power consumption is predicted to double by 2050, notably driven by the transportation and energy sectors necessitating limitations of emissions. Due to its compact turbomachinery, better thermal efficiency, and simpler layout, supercritical-CO2 cycles have received attention, with numerous variations proposed (either indirect-fired/closed cycles or direct-fired-open cycles). One technical challenge is degradation pathway quantification of turbine materials in sCO2 as selection is crucial to successfully and economically operate new plants. This requires degradation assessment in representative environments simulating the Allam cycle. Laboratory tests were conducted on a first stage turbine blade alloy, CM247, with either an environmentally resistant coating or bond coat/thermal barrier coat at one atmosphere and 800°C, with potential exposure including (O2, H2O, N2, SO2) for up to 1000 h. Weight change and metallographic measurements tracked scale development. Scanning electron microscopy/energy dispersive X-ray spectroscopy studied scales and internal precipitates. Locations of contaminant element in the CO2-rich environment were investigated.
KEYWORDS:
Introduction
The energy industry has acknowledged the need for cleaner, and more sustainable energy as the increase in population and economic activities over the past two decades has driven global energy demand subsequently resulting in environmental concerns. According to the Department of Business, Energy and Industrial Strategy, the UK’s energy demand has increased by 3.2 mega tonnes (oil equivalent) since 2020 with the UK’s electricity demand in 2021 approximately 334 terawatt-hours [Citation1]. Improving power generation efficiency whilst considering its environmental impact can be achieved through three areas – increasing the percentage of energy from the heat source that can be collected for use in the thermal power cycle; enhancing the thermal power cycle’s inherent efficiency; and minimising the parasitic power demand for plant balance [Citation2].
Existing power conversion cycles, as shown in , include the Rankine cycle and Brayton cycle which generally utilise water or combustion gases as their working fluids. However, with the necessity of attaining higher thermal efficiencies, alternative working fluids are being brought to the limelight. Over the years, the interest in carbon dioxide as working fluid for power generation has grown. Utilization of supercritical carbon dioxide, sCO2, has the potential to improve cycle efficiency in comparison to the steam-based Rankine cycle [Citation4]. To achieve higher thermal efficiency, the sCO2 Brayton cycle has been postulated as a novel power conversion cycle with a thermal efficiency reaching over 50%.
Figure 1. Principles of a power conversion system [Citation3].
![Figure 1. Principles of a power conversion system [Citation3].](/cms/asset/d8712404-7b24-48b8-91bc-f23a142614ec/ymht_a_2205744_f0001_c.jpg)
CO2 has a critical temperature and pressure of 31°C and 73.78 bar respectively and its unique features (stable supercritical fluid, non-toxic, low cost, and low critical point) have made it an ideal working fluid. sCO2 power cycles have been postulated as novel cycles, however, with high thermal efficiencies and turbine inlet temperatures >350°C [Citation2] there are material challenges especially for the heat exchangers and turbine blades, as both experience the hottest region of the cycle. Exposure of materials at high temperatures and pressures over long periods, results in degradation of the metal.
shows the thermal efficiency vs turbine inlet temperature of the different power generation systems for sCO2 cycles with different heat sources – nuclear, solar thermal, coal, etc. shows that power conversions utilising sCO2 have a high thermal efficiency in comparison to other power generation means.
Figure 2. Various power conversion efficiencies [Citation3].
![Figure 2. Various power conversion efficiencies [Citation3].](/cms/asset/5ebaa927-9f75-4464-a9bc-f794dfa9c87f/ymht_a_2205744_f0002_c.jpg)
Angelino explored the practicality of utilising CO2 as a working fluid for power generation, with further work considering supercritical cycles applied to different cycle layouts [Citation5–7]. CO2 gas has been applied widely for commercial and industrial use, refrigerators, and air conditioning systems [Citation8,Citation9], heat pumps [Citation10], and in its supercritical state, supercritical Brayton cycle, [Citation11] etc. Utilization of supercritical CO2 has been investigated for different applications – nuclear, geothermal [Citation12], and concentrated solar [Citation13].
Turbine blades play a critical role in power plants and typically operate in harsh conditions – high pressure, high temperature, and complex dynamic loading conditions, and as a result, the demand for high-efficiency power conversions systems have driven the need for improvements in materials selection. Turbine blade failure can occur due to different factors. Life-limiting mechanisms include high-temperature oxidation, hot corrosion, and creep, etc., while other degradation factors include fatigue, erosion, and/or foreign object damage [Citation14,Citation15]. Failure of turbine blades results in unexpected and economic repercussions so suitable alloys are needed. Nickel-based alloys are extensively used for severe environments in turbine engines, processing plants, and nuclear power [Citation16]. This paper focuses on illustrating the failure mechanisms anticipated in first-stage blade materials in a direct fired sCO2 power cycle. So far, research and development for materials reliability of a sCO2 power cycle has not been fully explored; thus, the high-temperature corrosion behaviour, oxidation behaviour and carburisation of nickel-based alloys are addressed.
Experimental
Experimental exposures were carried out at high temperature to study the chemical properties, i.e. the material systems’ oxidation behaviours as well as the carburisation behaviours.
The materials systems
In this study, one nickel-based alloy, CM247, was exposed. This was used bare or with a bond coat with and without a thermal barrier coating. Such material systems are used for current power generation because of their high oxidation and corrosion resistance. The nominal compositions of the alloy and coatings are shown in along with chemical composition of coating layers.
Table 1. Composition based on EDX outputs (wt.%) [Citation17].
Exposure procedure
The four stages include pre-exposure, testing, monitoring, and analysis phase. The pre-exposure stage involves separating the samples, which were machined from alloy rods into cylinders between 8 and 10.9 mm long, with a diameter of 7.9 and 10.9 mm. After this, the samples were ultrasonically cleaned in acetone and isopropanol before the preliminary dimensional and mass measurements were taken.
In the testing phase, a high-temperature corrosion test chamber has been utilised to simulate an sCO2 corrosive environment. The schematic diagram is shown in with the main parts being the alumina corrosion vessel, a water pump, and mass flow controllers. The gas input was CO2 with a vertical upward flow through the vessel with working temperature and pressure, 800°C and 1 bar, respectively. The gas flow rate was set at 88.74 sccm using the mass flow controller with deionised water automatically injected into the furnace at 0.002 ml/min. The gas composition for tests 1 and 2 were CO2 + 2.7 mol% H2O + 0.17 mol% O2 and CO2 + 1.43 mol% N2 + 0.17 mol% O2 + 300 ppm SO2, respectively. The samples were exposed for up to 1000 h, each cycle lasting 200 h. As a real operating scenario contains contaminants, H2O, N2, O2 and SO2, tests 1 and 2 can thus be compared to illustrate the effects of contaminants and protective treatments on material corrosion.
Figure 3. Simple schematic of a furnace [Citation18].
![Figure 3. Simple schematic of a furnace [Citation18].](/cms/asset/afb7149a-6487-40fb-b88c-8093a4e95005/ymht_a_2205744_f0003_c.jpg)
In the monitoring and exposure stage, mass measurements were taken between each cycle. After completing their exposure time, samples were mounted in resin and sections, cut, ground, and polished for analysis.
In the last phase, the analysis stage, the acquired mass change data were plotted. An optical microscope analysed the sample surface to study the metal loss across the sample surface – dimensional metrology. The last step of the analysis phase was using the SEM/EDX to investigate the surface morphology and oxide scale on the sample.
Results and discussion
Average weight change
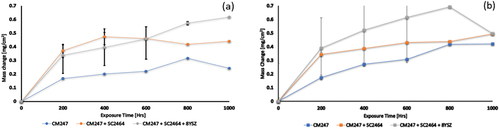
The average weight change data for samples exposed in both environments are shown in . All test samples exhibit an increase in average mass over the exposure period. shows that after 1000 h of exposure in test 1, CM247 + SC2464 + 8YSZ exhibited the highest average mass change of 0.618 mg/cm2, whilst CM247 exhibited the lowest average mass change of 0.168 mg/cm2. This can be compared with the data obtained after exposure in test 2 where CM247 had an average mass change of 0.4921 mg/cm2 whilst CM247 + SC2464 and CM247 + SC2464 + 8YSZ had 0.494 mg/cm2 and 0.497 mg/cm2, respectively. These datasets indicate that the uncoated samples are affected by the SO2 (present in the test 2) environment, whereas the coated samples were not influenced. The observed increase in masses suggests the formation of corrosion products, which are likely carbides or oxides.
Figure 4. Averaged weight change plot showing mass change vs exposure time for test 1 and 2; (a) Metal change for 800 °C/1 bar/CO2 + 2.7 mol% H2O + 0.17 mol% O2 and (b) Metal change for (b) 800 °C/1 bar/CO2 + 1.43 mol% N2 + 0.17 mol% O2 + 300 ppm SO2.
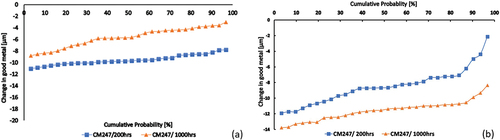
Dimensional change in metal data presented in terms of cumulative probability of metal loss exceedance is shown in . (test 1) shows that, after a 1000 h exposure time, CM247 had a good metal loss of approximately 9 μm at the lowest level of probability, while in (test 2) CM247 for the same exposure time had approximately 14 μm of good metal loss. Although there has been a loss of good metal from the samples, the chart shows that the rate at which metal was lost is small. , dimensional metrology data, shows that the second testing environment, although not a highly damaging environment, does accelerate corrosion. This indicates that the presence of contaminants does not influence the rate at which corrosion progresses.
Figure 5. Dimensional metrology for tests (a) 1 and (b) 2.
Despite there being a significant but small metal loss across 1000 h, corrosion rate could be fitted using equation, X2 = Kpt + C. The Kp values were calculated and shown in .
Table 2. Kp values where the exposure time was 1000 h. (Units are mg2/cm−4.s−1).
shows the backscattered micrographs of the coated and uncoated CM247 alloys under the two experimental conditions as well as unexposed reference samples. shows that after exposure in test environment 1, a continuous scale is formed on the surface of the sample. This is a Cr-rich oxide scale shown in . shows a continuous scale on the surface has also formed after exposure in test environment 2. However, there is also evidence of oxides within the alloy matrix adjacent to the surface. These phases are further examined in .
Figure 6. SEM micrographs of CM247. (1), (2) and (3) represent the unexposed samples of CM247, CM247+SC2464, and CM247+SC2464+8YSZ. respectively. (a) and (b) CM247 at 1000 h for test 1 and 2. respectively, (c) and (d) CM247+SC2464 at 1000h for test 1 and 2. respectively. whilst (e) and (f) CM247+SC2464+8YSZ at 1000h for test 1 and 2. respectively.
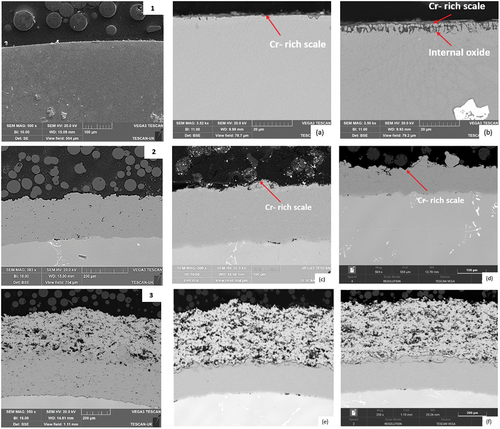
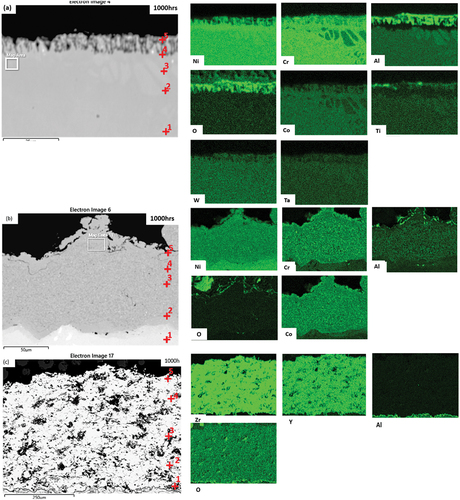
Figure 7. Backscattered and EDX maps for test 1 exposed for 1000 h. (a) CM247, (b) CM247 + SC2464, and (c) CM247 + SC2464 + 8YSZ.
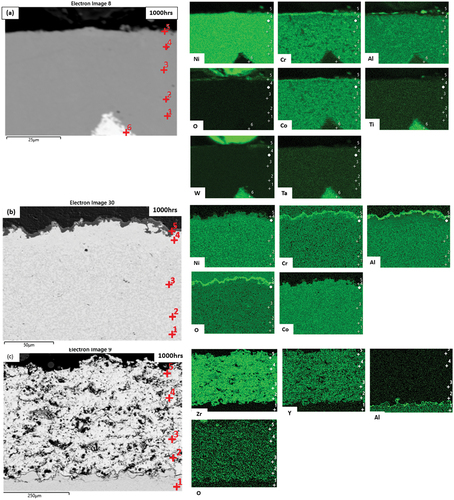
Figure 8. Backscattered and EDX maps for test 2 exposed for 1000 h (a) CM247, (b) CM247 + SC2464 and (c) CM247 + SC2464 + 8YSZ.
shows BSE images of CM247+SC2464 after 1000 h exposure in test environments 1 and 2 respectively. In comparison with the unexposed reference sample in , both samples show little to no change in surface morphology. exhibits a thin (approximately 2 μm) oxide layer, shown to be rich in Cr and Al based on the EDX analysis shown in . The formation of this oxide layer may explain the increase in mass observed in .
depicts the BSE images of CM247 + SC2464 + 8YSZ after 1000 h exposure in test environments 1 and 2, respectively. These images show little change in morphology in either environment.
presents the EDX maps and point analysis of the tested materials exposed for 1000 h in test environment 1. shows the element distribution of CM247 revealing the formation of a continuous oxide scale rich in Cr and Al. The point analysis in indicates a higher wt.% of Al, O, Cr and depletion in the Ti, Ta, and Ni content at the surface (point 5). The EDX analysis also indicates that the carbide phase (point 6) is rich in Ta and Ti.
Table 3. EDX analysis composition (wt.%) of CM247 exposed for 1000 h in test environment 1 (C excluded from analysis).
, relating to CM247+SC2464, also shows the formation of an oxide scale rich in Al and Co at the surface of the coating. This indicates the formation of a scale on the surface.
, relating to CM247 + SC2464 + 8YSZ, does not show any significant changes in the composition of the ceramic coating through its thickness. However, the maps indicate the formation of an Al-rich layer at the interface of the SC2464 bond coat and 8YSZ TBC. This Al-rich layer, while in the location expected for a thermally grown oxide, does not appear to contain oxygen. This could be due to the presence of oxygen in the TBC affecting the EDX map scale.
presents the EDX maps and point analysis of the exposed materials after 1000 h in environment 2. shows the elemental distribution of bare CM247, revealing the formation of an oxide scale rich in Cr and Al (thicker than that in ). The maps also indicate the formation of internal oxides which are also rich in Al, supported by point analysis, . The EDX maps also indicate that the alloy below the oxide scales is depleted of Al, Ti and Ta, leaving a Ni-rich zone. The depletion of oxide forming metals is believed to be as a result of the protective scale being formed. Comparing the composition with , it can be postulated that exposing CM247 in environment 2 results in a more depleted alloy, with a thicker oxide scale. Based on the SEM analysis of these uncoated samples, the effect of oxidation is more pronounced in environment 2, indicating the importance of the change in contaminants; this is supported by the average weight change data.
Table 4. Elemental composition of CM247 in test environment 2 (wt.%).
, relating to CM247+SC2464, also shows the formation of an oxide scale rich in Al (and with a slight Cr enrichment) at the surface of the coating. However, this layer does not appear continuous, which may account for the higher weight change as compared to the bare alloy. This effect may be exacerbated by the relatively rougher surface (and hence greater surface area) of the coating, compared to the bare alloy.
, relating to CM247 + SC2464 + 8YSZ, does not show the significant change to the TBC’s composition. (Similar to environment 1; ). However, the maps do indicate the formation of an Al- and O-rich layer at the interface of the SC2464 bond coat and 8YSZ TBC. This Al-rich layer appears to contain oxygen unlike .
Conclusion
In this study, a nickel-based superalloy, CM247, either bare or with two different coating systems (an environmentally resistant coating or a bond coat/thermal barrier coating system), was tested, simulating a sCO2 cycle for a power plant scenario. Testing was carried out at 800°C and 1 atmosphere. Samples were studied to investigate the effects of contaminants on the oxidation/carburisation processes, finding that adding contaminants such as SO2 and N2 to the gas lead to a more rapid oxidation process in the bare alloy, although neither S not N has been detected in the substrate alloy using EDX. Coatings did not result in a lower rate of oxidation (as observed from weight change measurements); this may be due to the greater surface area of the coating compared to the bare alloy.
Disclosure statement
No potential conflict of interest was reported by the authors.
Additional information
Funding
References
- Alaves B Electricity demand in the UK 2021 | Statista. 2022. Available at: (Accessed: 21 June 2022). https://www.statista.com/statistics/323381/total-demand-for-electricity-in-the-united-kingdom-uk/
- Department of Energy U. Chapter 4: advancing clean electric power technologies. 2015. Available at: https://www.energy.gov/sites/default/files/2016/06/f32/QTR2015-4R-Supercritical-Carbon-Dioxide-Brayton%20Cycle.pdf (Accessed: 22 June 2022)
- Ahn Y, Bae SJ, Kim M, et al. Review of supercritical CO2 power cycle technology and current status of research and development. Nucl Eng Technol. 47(6). Elsevier Elsevier. 647–661. 1 October 2015(Accessed: 1 October 2022). DOI:10.1016/J.NET.2015.06.009.
- Weiland NT, Dennis RA, Ames R, et al. Fossil energy. Fundamentals and applications of Supercritical Carbon Dioxide (SCO2) Based power cycles. Woodhead Publishing; 1 January 2017 (Accessed: 1 January 2022). pp. 293–338 Available at 10.1016/B978-0-08-100804-1.00012-8.
- Angelino G Real gas effects in carbon dioxide cycles. International Gas Turbine Conference and Product Shows. Cleveland, Ohio: AMSE; 1969. Available at: DOI:10.1115/69-GT-102 (Accessed: 9 March 2023)
- Angelino G. Carbon dioxide condensation cycles for power production. J Eng Power. Available at1 July 1968 (Accessed: 1 July 2022); 90(3):287–295. https://asmedigitalcollection.asme.org/gasturbinespower/article/90/3/287/405421/Carbon-Dioxide-Condensation-Cycle-For-Power.
- Angelino G. Perspectives for the liquid phase compression gas turbine. J Eng Power. 89(2): American Society of Mechanical Engineers Digital Collection American Society of Mechanical Engineers Digital Collection:229–236. 1 April 1967 (Accessed: 1 April 2023). DOI:10.1115/1.3616657.
- Kim MH, Pettersen J, Bullard CW. Fundamental process and system design issues in CO2 vapor compression systems. Prog Energ Combust Sci. 1 January 2004 (Accessed: 22 June 2022); 30(2):119–174. Pergamon Available at. DOI:10.1016/J.PECS.2003.09.002
- Ma Y, Liu Z, Tian H. A review of transcritical carbon dioxide heat pump and refrigeration cycles. Energy. 55 Pergamon Available at 15 June 2013 (Accessed: 22 June 2022): 156–172. 10.1016/J.ENERGY.2013.03.030
- Sarkar J. Ejector enhanced vapor compression refrigeration and heat pump systems—a review. Renew Sust Energ Rev. 16(9): Pergamon Available at:6647–6659. 1 December 2012 (Accessed: 22 June 2022). 10.1016/J.RSER.2012.08.007
- Dostal V A supercritical carbon dioxide cycle for next generation nuclear reactors. Prague; 2004. Available at: https://dspace.mit.edu/handle/1721.1/17746 (Accessed: 22 February 2022)
- Wright SA, Conboy TM, Ames DE.CO2-based mixtures as working fluids for geothermal turbines.Albuquerque, NM, and Livermore, CA (United States): JanuaryJune 2012. Available at 10.2172/1049477 (Accessed: 21 June 2022).
- Turchi CS, Ma Z, Dyreby J. Supercritical carbon dioxide power cycle configurations for use in concentrating solar power systems. Proc ASME Turbo Expo. 9 July 2013 (Accessed: 21 June 2022); 5:967–973. American Society of Mechanical Engineers Digital Collection Available at. DOI:10.1115/GT2012-68932
- Wang WZ, Xuan FZ, Zhu KL, et al. Failure analysis of the final stage blade in steam turbine. Eng Fail Anal. 1 June 2007 (Accessed: 20 July 2022); 14(4):632–641. Available at. DOI:10.1016/J.ENGFAILANAL.2006.03.004
- Hunter I, Daleo J, Wilson J, et al. Analysis of hot section failures on gas turbines in process plant service. Proceedings of the 28th Turbomachinery Symposium, Texas A&M University, Texas, USA. pp. 9–20.
- Pollock TM, Tin S. Nickel-based superalloys for advanced turbine engines: chemistry, microstructure and properties. J Propul Power. American Institute of Aeronautics and Astronautics Inc Available at23 May 2012 (Accessed: 21 July 2022); 22(2):361–374. http://doi.org/10.2514/1.18239.
- Sumner J, Potter A, Simms NJ, et al. Hot corrosion resistance of gas turbine materials in combusted syngas environments. 2015;32:177–187. Available at. DOI:10.1179/0960340914Z.00000000098.
- Potter A, Sumner J, Simms N. The effects of water vapour on the hot corrosion of gas turbine blade materials at 700 °C. 2022. (Accessed: 9 March 2023). Available at Mater High Temp. 39(3):231–238. 10.1080/09603409.2022.2056299.