
 ?Mathematical formulae have been encoded as MathML and are displayed in this HTML version using MathJax in order to improve their display. Uncheck the box to turn MathJax off. This feature requires Javascript. Click on a formula to zoom.
ABSTRACT
Gas turbine materials often feature precipitates containing refractory metals to enhance their mechanical strength. This can make them susceptible to alloy-induced acidic fluxing whereby refractory elements increase the acidity of salt deposits. It is not clear to what degree degradation around alloy precipitates is caused by alloy-induced hot corrosion mechanisms, or the inability to develop a protective scale where precipitates are located. The effect of alloy-induced hot corrosion was isolated from the disruption of the protective-scale formation by adding particles of molybdenum to the 80/20 (Na/K)2SO4 deposit for a ‘deposit re-coat’ style hot corrosion test. The resulting morphologies were compared to samples exposed without the addition of molybdenum. Morphology changes were investigated using scanning electron microscopy with energy-dispersive X-ray mapping. Results show a mix of sulphidation and pitting. The effects of molybdenum additions appear more severe for MarM 509 compared to PWA 1483.
Introduction
Gas turbine components in the hot gas pathway, such as blades and vanes, are expected to perform reliably at elevated temperatures and pressures under high mechanical loads in environments inducive to chemical attack. Future developments are likely to push these parameters to become more extreme to seek improved efficiencies and exploit alternative fuels [Citation1]. This necessitates the use of superalloys. One feature commonly found in superalloys to improve their yield strength is the inclusion of refractory metal carbide phases within the alloy microstructure [Citation2]. Some studies have observed that these phases are rapidly oxidised when located at the gas-phase interface and, therefore, that these phases may be detrimental to the material’s environmental resistance [Citation3,Citation4]. In addition, for alloys containing such carbide phases, following exposure in an environment conducive to type II hot corrosion, corrosion pits appear to commonly form around the precipitates [Citation4,Citation5].
It has been postulated that there are two possible methods by which these carbide phases are detrimental to the material’s environmental resistance [Citation5]. The first of these is that the presence of the carbide phase results in a localised area devoid of the elements that can form a protective scale. Hot corrosion kinetics involve an incubation period that corresponds to the breaking down of the protective scale, followed by a propagation stage characterised by rapid material loss [Citation6]. It is therefore reasonable to believe that the disruption of the protective scale local to the carbide precipitate would accelerate the onset of propagation around the precipitate. In addition to this, the phase boundary between the oxidised precipitate and bulk alloy matrix may provide a route for the inwards ingress of deleterious species deeper into the alloy. Examples of these morphologies are shown in .
Figure 1. (a) MarM 509 exposed at 700 °C in air for 100 hours with no deposit. (b) MarM 509 exposed at 700 °C for 100 hours in 8.5 vol.% O2, 10.5 vol.% CO2, 5 vol.% H2O and 90 ppm SOx with 80/20 Na2SO4/K2SO4 at 1.5 µg/cm2/h [Citation4].
![Figure 1. (a) MarM 509 exposed at 700 °C in air for 100 hours with no deposit. (b) MarM 509 exposed at 700 °C for 100 hours in 8.5 vol.% O2, 10.5 vol.% CO2, 5 vol.% H2O and 90 ppm SOx with 80/20 Na2SO4/K2SO4 at 1.5 µg/cm2/h [Citation4].](/cms/asset/35170df1-5ec7-4246-a2a6-d9ced3e6e646/ymht_a_2219877_f0001_c.jpg)
The second method by which the refractory metal carbide phase may affect the environmental resistance of the alloy is through alloy-induced acidic fluxing [Citation3]. This is a hot corrosion mechanism in which refractory metal precipitates or solute species react with a molten salt deposit to make the melt more acidic. The reactions by which this can occur are given in EquationEquation 1(1)
(1) and Equation2
(2)
(2) [Citation7].
It is not clear to what degree the alloy-induced hot corrosion mechanism affects the localised degradation of the alloy around precipitates, or how much of the damage is caused by the inability to develop a protective chromia scale. This paper investigates the alloy-induced hot corrosion mechanism to confirm if localised damage is or is not solely the consequence of a disrupted chromia scale. To achieve this, corrosion tests conducive to type II hot corrosion were carried out with molybdenum powder added to the deposit to increase the acidity and simulate the impact of a Mo-rich deposit locally. Reaction kinetics and changes in morphology were then compared to corrosion tests with the same parameters but without additions of molybdenum [Citation8].
Methodology
Deposit recoat hot corrosion tests were performed in a vertically orientated tube furnace outfitted with an alumina lined corrosion vessel. Samples were held within alumina crucibles positioned on an alumina carousel in the furnace hot zone of 700°C (±5°C). The test gas of 300 ppm SO2 in air was piped through the furnace into the bottom where it was emitted to pass back up past the samples before exhausting from the furnace’s top. This gas pathway allowed time for the SO2 /SO3 equilibrium to establish. A schematic of the experimental set up is given in .
Figure 2. Test furnace apparatus [Citation8].
![Figure 2. Test furnace apparatus [Citation8].](/cms/asset/74efeb94-7633-4ca3-8a2f-f0b4c31da060/ymht_a_2219877_f0002_c.jpg)
Deposits were applied every 50 h to the samples. This was carried out in two stages using a pneumatically powered spray gun. The first stage consisted of applying an 80% Na2SO4 20% K2SO4 aqueous solution at a flux of 1.5 µg/cm2/h. The second stage applied Mo particles of 2–5 µm diameter suspended in isopropanol also at a flux of 1.5 µg/cm2/h. Samples were heated to just over 100°C for the application of both deposits to allow the rapid evaporation of the medium carrying either deposit. The data obtained were compared with previous work that used the same materials, test parameters and techniques [Citation8].
The reactions given in EquationEquations 1(1)
(1) and Equation2
(2)
(2) have a ratio of 1:1 MoO3 to Na2SO4. The relative atomic mass of these compounds is approximately equal (144 and 142 respectively), while the relative atomic mass of Mo is 96. By using the same flux weight of salt deposit and Mo deposit, there should be an excess of Mo available for acidic fluxing reactions.
The nickel-based PWA 1483 and cobalt-based MarM 509 superalloys were selected for this experimental work. shows the nominal compositions of the superalloys. These alloys both form a protective chromia scale and contain refractory metal carbide phases, thought to be MC type based on the literature of similar alloys [Citation9,Citation10], within their alloy matrix. ImageJ software was used with back scattered electron images (BSE) to determine the area percentage of the alloy made up of primary refractory metal carbide phases based on the brightness of such phases compared to the rest of the alloy matrix. These were 0.9% for PWA 1483, and 6.2% for MarM 509. MarM 509 featured a secondary carbide phase, thought to be M23C6 type [Citation10], rich in chromium that was excluded from this calculation based on its darker shade on the BSE images.
Table 1. Nominal alloy elemental compositions wt.% (at.%) [Citation11].
Samples for exposure were cylindrical with a chamfer at the top and bottom to prevent accelerated local corrosion due to edge effects. The sample height and diameter were both approximately 10 mm. Exact sample dimensions were measured pre-test using a digital micrometre with a resolution of ±1 µm. Samples were mounted in a mixture of low shrinkage resin and glass beads with a diameter of 0.04 to 0.07 mm post-test. Cross sections were prepared to a 1 µm polished finish. Oil-based lubricants were used during post-test preparation to avoid dissolving soluble species on the sample surface. The coordinates of remaining metal were determined using an optical microscope with a calibrated x, y stage. These data were compared to the pre-test metrology to determine metal loss values, with the data presented as cumulative probability curves [Citation8]. Changes in sample morphology were assessed using a scanning electron microscope (SEM) equipped with an energy-dispersive X-ray (EDX) detector.
Results and discussion
Cumulative probability curves for change in good metal are presented in . Both PWA 1483 and MarM 509 exhibit negligible change in good metal after 50 h of exposure indicating that, at this time, they have remained in the incubation stage of hot corrosion. After 100 h of exposure approximately 55% of PWA 1483 and 15% MarM 509 show a greater degree of change in good metal. These proportions are similar after 200 h of exposure but with a greater degree of metal loss (up to 10 µm) where corrosion is occurring. After 500 h, the whole of PWA 1483 has entered into propagation while only 80% of MarM 509 has done so over the same period. While a similar change in good metal (approximately 103 µm) is observed for both alloys at their lowest levels of probability (representing the deepest pits), the distribution of damage is more localised for MarM 509 while PWA 1483 has a more even distribution.
Figure 3. Cumulative probability of change in good metal plots for PWA 1483 (top) and MarM 509 (bottom). Exposure carried out at 700 °C in an air atmosphere with 300 ppm SO2. The deposit flux was 1.5 µg/cm2/h of 80/20 (Na/K)2SO4 modified with additions of 1.5 µg/cm2/h of Mo.
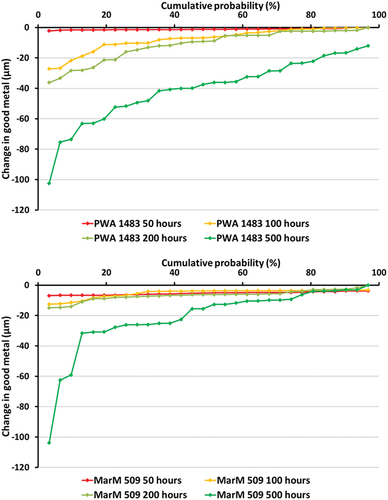
The Cr content of the alloys (12.2 wt.% for PWA 1483 and 23.5 wt.% for MarM 509) undoubtedly played a role in the corrosion kinetics observed through the alloy’s ability to form a protecting chromia scale. This may be balanced against the greater primary carbide precipitate fraction of MarM 509 compared to PWA 1483 (6.2% and 0.9% respectively). Furthermore, other factors such as grain size may affect the alloy’s ability to form a protective chromia scale. These multiple factors acting together make it difficult to comment each individual factor when comparing the two alloys.
Median and 4% probability of good metal loss were used to compare the current exposures using the Mo modified deposit with previous work [Citation8] using the same test parameters but an unmodified deposit. These data are presented in . Median values give an average indication of corrosion damage, whereas the 4% probability data indicate the severity of corrosion pits.
Figure 4. Median (top) and 4% (bottom) probability of metal loss exceedance plots. Exposure carried out at 700 °C in an air atmosphere with 300 ppm SO2. The deposit flux was 1.5 µg/cm2/h of 80/20 (Na/K)2SO4 either modified with 1.5 µg/cm2/h of molybdenum or unmodified [Citation8].
![Figure 4. Median (top) and 4% (bottom) probability of metal loss exceedance plots. Exposure carried out at 700 °C in an air atmosphere with 300 ppm SO2. The deposit flux was 1.5 µg/cm2/h of 80/20 (Na/K)2SO4 either modified with 1.5 µg/cm2/h of molybdenum or unmodified [Citation8].](/cms/asset/edbfae9c-8fee-46e2-be2f-2e09963d930d/ymht_a_2219877_f0004_c.jpg)
Little difference between the Mo modified and unmodified deposits can be seen at the median value for all tested exposure times. However, differences are seen at the 4% probability of good metal loss. The greatest difference between the Mo modified and unmodified deposits is seen after 500 h of exposure at the 4% probability. These were an extra 22 µm for PWA 1483 and 61 µm for MarM 509.
From these findings, it can be inferred that refractory metal precipitates do affect hot corrosion kinetics beyond the disruption of the surface scale. These increases in damage are, however, restricted to corrosion pits and not evenly distributed. This likely occurs through the alloy-induced acidic fluxing mechanism described by Goebel et al. [Citation3]. It is difficult to quantify the effects of the refractory metals since other factors such as the abundance of the protective scale forming element and the size and distribution of the refractory element phases also factor in. It could be expected that the effects of alloy-induced acidic fluxing should be localised around the responsible refractory elements. However, during 500 h of exposure, samples were sprayed with Mo particles on 10 separate occasions; over this time the additional Mo should be reasonably evenly distributed. A likely explanation is that the greater corrosion pits are occurring where the sprayed molybdenum contacts a refractory metal carbide phase on the sample surface. Either of these possibilities may be sufficient to move the acidity of the melt far enough to dissolve the protective scale and allow rapid degradation.
shows backscattered electron (BSE) SEM micrographs of PWA 1483 (left) and MarM 509 (right) after exposure with the Mo modified deposit. Both representative and extreme ‘feature’ levels of damage are captured. For both materials, after 50 h of exposure, the image representative of the majority of the samples exhibits negligible damage which does not signify a change from incubation to propagation in the hot corrosion degradation sequence. Corrosion features are consistent with type II corrosion pits discussed in the hot corrosion literature [Citation7,Citation12] and are observed to have formed around alloy precipitates located at the surface. Here, internal damage can be observed adjacent to the remains of the alloy precipitates, extending up to 10 µm into the alloy.
Figure 5. BSE images for PWA 1483 (left) and MarM 509 (right) showing areas both representative of the majority of the sample and also extreme corrosion features.
For PWA 1483, the corrosion features formed after exposure times between 100 and 500 h show two distinct types of morphology. One type (100 h; ‘feature’ image) does not exhibit internal damage within the metal, and the corrosion product inner layer is a relatively consistent shade, indicating little compositional change. The other type (shown for 200 and 500 h; ‘feature’ images) does feature internal damage within the metal, and the corrosion product has a more mottled shade. Three possible explanations for the differences in morphology are: different corrosion mechanisms occurring; different stages of the same mechanism; or a combination of both.
For MarM 509, corrosion features encompass precipitate phases at all tested exposure times. Internal damage (shown to be sulphidation in based on the point analysis and the morphology in the literature for similar exposures [Citation12–14]) can be seen in all the features, often located adjacent to precipitate phases.
shows a BSE image with EDX point analysis elemental quantification and maps. These show a mixed mode corrosion feature on PWA 1483 after 500 h of exposure. The outer-most layer of corrosion product is primarily composed of Ni- and Co-rich oxides; this layer is approximately 30 µm thick at the centre point of the feature. Beneath this Ni- and Co-rich oxide layer and central to the feature, a relatively small area of Al-rich oxide can be observed, which shows up darker than the adjacent Ni and Co oxides. The Al-rich oxide area is thicker towards the centre of the pit feature (8 µm) than at the edges of the pit (1–2 µm). An inner layer rich in Cr oxides, 60 µm thick at the centre point of the pit feature, is situated below the Al oxide layer. Within this layer, the oxidised remains of primary carbide phases rich in Ta can be observed. This kind of layering of corrosion product is a consequence of elements from the alloy dissolving in the melt and subsequently precipitating at the gas-phase interface and is typical of type II hot corrosion.
Figure 6. BSE image with point analysis and EDX element map of a corrosion feature on PWA 1483 after 500 hours of exposure at 700 °C in an air atmosphere with 300 ppm SO2. The deposit flux was 1.5 µg/cm2/h each of 80/20 (Na/K)2SO4 and Mo..
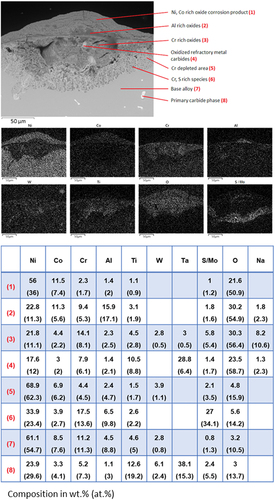
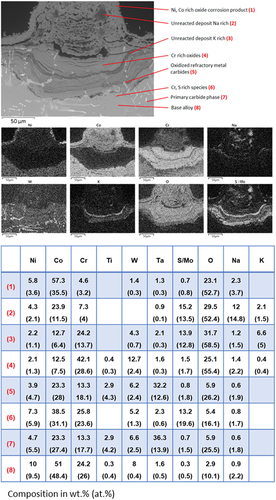
Figure 7. BSE image with point analysis and EDX element map of a corrosion feature on MarM 509 after 500 hours of exposure at 700 °C in an air atmosphere with 300 ppm SO2. The deposit flux was 1.5 µg/cm2/h each of 80/20 (Na/K)2SO4 and Mo..
At the interface of the remaining good metal and the corrosion product, there exists a layer composed of a Cr-rich sulphide species and Cr depleted metal. The depth of penetration of S-rich precipitates into the alloy in this region varies between 20 and 40 µm. Where a carbide precipitate extends through this region of internal damage, deeper into the alloy (left side of the pit), so too does the penetration of S in the alloy, extending a further 20 µm. The formation of sulphide species within the alloy adjacent to the surface is often associated with type I hot corrosion, which typically occurs approximately 200°C hotter than this exposure (i.e. approximately 900°C).
shows a backscattered electron image with EDX point analysis elemental quantification and maps of a broad corrosion pit feature on MarM 509 after 500 h of exposure. Although the oxidised remains of carbide precipitates are visible in the pit’s corrosion product, it does not appear that this pit feature has formed around such a precipitate.
The corrosion product is comprised of multiple phases arranged in layers. The outer most layer is relatively thin (approximately 10 to 15 µm) and rich in both Ni and Co. Beneath this layer is a thicker (up to 100 µm) Co-rich layer that exists towards the centre of the pit. Within this Co-rich layer, there are regions rich in Na and S which are likely to be unreacted Na2SO4 deposit. While Mo and S have a peak overlap in EDX, making their separation complex, this region appears with a relatively dark shade in the BSE image, indicating a lighter element, and is therefore unlikely to contain Mo, which is heavier than S and so would appear brighter.
Situated below the Co-rich layers are two Cr-rich layers bisected by a thin layer (10 µm) rich in K and S (likely unreacted K2SO4 from the deposit). K and S are also shown in the element map to be present in the lower Cr-rich layer. The corrosion product adjacent to the metal surface is rich in either S or Mo. As this layer shows up brighter than the S containing species, it is likely unspent Mo originating from the deposit.
The metal at the surface of the alloy adjacent to the corrosion front features internal damage, up to 15 µm of depth into the alloy, with an irregular distribution. EDX element mapping shows that the metal in this region is lean in Cr.
Although the corrosion feature shown in has evidence of mixed mode corrosion, the depth of the pit and the thickness of the oxide corrosion product layers indicate the hot corrosion mechanism may have been dominated by acidic fluxing prior to the end of the test. This type of feature does not appear on MarM 509 samples exposed in the same conditions without Mo in the deposit [Citation8]; it is therefore likely that the chemistry of the melt has been altered by the Mo to become more acidic.
The observed morphologies (shown in ) can be compared with those of a previous study of the same materials using the same corrosion parameters but without Mo additions to the deposit [Citation8]. Both sets of data show similar morphology; a mixed mode of corrosion involving pitting and sulphidation, and with corrosion features often but not exclusively forming around carbide precipitates. The difference between the tests lies in the most extreme areas of corrosion attack as reflected in the dimensional metrology (). There was no evidence of Mo left within the corrosion features of either PWA 1483 or MarM 509 after 500 h of exposure. In addition to this, observing unreacted salt within the corrosion product indicates that molybdate species may initially drive the corrosion reaction. In the meantime, the SO3 from the deposit may be free to cause the internal sulphidation observed in .
Conclusions
The effects of refractory metals on type II hot corrosion were investigated. Tests were carried out at 700°C in an atmosphere of 300 ppm SO2 in air and an 80% Na2SO4 20% K2SO4 deposit with a flux of 1.5 µg/cm2/h modified with Mo additions, also at 1.5 µg/cm2/h.
Corrosion rates were greater when compared to previous work involving the same parameters with an unmodified deposit [Citation8]. This was attributed to enhanced acidic fluxing as described in the literature [Citation3]. Further work should be carried out to quantify the effect of acidic fluxing compared to the effect of precipitates disrupting the protective oxide scale.
Additions of Mo did not evenly increase corrosion damage over the sample, but rather exacerbated the damage at the most affected areas. This effect was more severe for MarM 509 compared to PWA 1483 possibly due to the increased fraction of carbide precipitates in the former alloy.
Mixed mode hot corrosion features (features typical of both type I and II hot corrosion) were observed on both MarM 509 and PWA 1483. Internal sulphidation may be a result of the refractory element initially driving the corrosion reaction to be more aggressive.
Disclosure statement
No potential conflict of interest was reported by the author(s).
References
- Oskarsson H. Material challenges in industrial gas turbines. J Iron And Steel Res Int. 2007;14(5):11–14.
- Pollock TM, Tin S. Nickel-based superalloys for advanced turbine engines: chemistry, microstructure, and properties. J Propul Power. 2006;22(2):361–374.
- Goebel JA, Pettit FS, Goward GW. Mechanisms for the hot corrosion of ni-base alloys. Metall Trans. 1973;4(1):261–278.
- Potter A, Sumner J, Simms NJ. The role of superalloy precipitates on the early stages of oxidation and type II hot corrosion. Mater High Temp. 2018;3409(1–3):236–242.
- Potter A, Sumner J, Simms NJ, et al., “Hot corrosion in the next generation of industrial gas turbines,” Eurocorr 2014; 8-12/9/2014; Piza, 2014.
- Pettit F. Hot corrosion of metals and alloys. Oxid Met. 2011;76(1–2):1–21.
- Birks N, Meier GH, Pettit FS. Introduction to the high-temperature oxidation of metals, Vol. 2. Cambridge: Cambridge University Press; 2006. 10.1017/CBO9781139163903
- Potter A, Sumner J, Simms NJ. The effects of water vapour on the hot corrosion of gas turbine blade materials at 700 °C. Mater High Temp. 2022;39(3):231–238.
- Turazi A, de Oliveira CAS, Bohórquez CEN, et al. Study of GTD-111 superalloy microstructural evolution during high-temperature aging and after rejuvenation treatments. Metallogr Microstruct Anal. 2015;4(1):3–12.
- Biss V. Phase analysis of standard and molybdenum-modified mar-m509 superalloys. J Test Eval. 1977;5(3):217–223.
- Donachie MJ, Donachie SJ. Superalloys: a technical guide, Vol. 2. Materials Park, OH: ASM International; 2002. 10.31399/asm.tb.stg2.9781627082679
- Pan P, Li T, Wang Y, et al. Effect of temperature on hot corrosion of nickel-based alloys for 700 °C A-USC power plants. Corros Sci. 2022;203:110350.
- Bordenet B. “High Temperature Corrosion in Gas Turbines: Thermodynamic Modelling and Experimental Results,” PhD thesis, Rheinisch-Westfälische Institute of Technology; 2004.
- Gleeson B, Pettit FS, Meier GH. Reinterpretation of type ii hot corrosion of co-base. Oxid Met. 2018;90(5):527–553.