
 ?Mathematical formulae have been encoded as MathML and are displayed in this HTML version using MathJax in order to improve their display. Uncheck the box to turn MathJax off. This feature requires Javascript. Click on a formula to zoom.
ABSTRACT
This paper describes a numerical analysis to predict the deformation and time to rupture of the small punch creep test for 316 L(N) austenitic steel. The constitutive model incorporates elasto-plastic nonlinear kinematic hardening and creep with primary, secondary and tertiary creep calibrated to the RCC-MRx code data. The computations are assessed by comparing with experimental data for a 500 µm thick sample clamped with a diameter of 5 mm loaded with a force 300,400 and 500N at 700°C. The model predicts the experimental observations quite well with respect to minimum deflection rate and time to rupture and its location using a local critical strain criterion. A very important feature is that the deformation and total effective strain distribution at rupture are almost identical for all loads as function of the time divided by the time to rupture.
Introduction
In the small punch test, a small is disk placed in a die with a circular hole and loaded by an indenter. The load and deformation are used to deduct material properties, e.g [Citation1–5]. In the tensile test, loading is displacement controlled whereas in the creep test is load controlled. The most common dimension of a small punch test piece is a diameter of 8 mm and a thickness of 500 μm and a receiving hole with 4 mm diameter, but even smaller dimensions can be used. A standard for the small punch test has recently been published [Citation6] and is now included in the RCC-MRx design code [Citation7] to assess material properties. The two main advantages of the small punch test are that it requires very small material volumes and the test is relatively simple to conduct. Although the load and the disk deflection are the only parameters that are directly measured, the small punch test has been used to determine basic material parameters such as yield and ultimate strength and creep strength by aid of simplified models and calibration with experiments [Citation1,Citation2,Citation5,Citation6]. The small punch test may be easy to conduct, but the modelling is quite challenging, in particular for creep, as the tests contain a number of complicating and interacting features [Citation3–5,Citation8–13]:
deformations are generally large and involve significant plastic deformation;
the stress and strain fields vary significantly across the disk and also with time;
across the disk, forward-creep and stress relaxation occur simultaneously;
the friction between the indenter and the sample has a significant influence on the deformation and time to rupture but the corresponding friction coefficient is very difficult to determine.
The small punch test is primarily used for qualitative material assessment but does not provide sufficient data to determine material properties such as complete tensile curves or creep curves reliably. A major limitation for the simulation of the small punch tests of a specific material is that creep data usually only cover a limited stress range whereas the small punch test pieces are subjected to a very large stress range. Thus, the creep model must cover the full stress and strain range, but it must also handle relaxation. A visco-plastic model can predict the deformation but to actually predict the rupture a material based criterion is also needed.
In this paper, we will present the material calibration and finite element approach, for the small punch creep test for the austenitic steel 316 L(N). The visco-plastic properties are derived from uniaxial design data that are extrapolated to cover the full stress-strain range [Citation11,Citation14]; friction effects are addressed by Coulomb friction as presented in [Citation11]. In this paper, special attention is given to a rupture criterion.
Experimental results
summarises key results for three tests at 700°C with applied load 300N, 400N and 500N respectively. The main setup for the test conducted on the 316 L(N) steel with dimensions: punch ball—2.5 mm; receiving hole 4 mm with a 0.2 mm chamfer; test piece diameter 8 mm and thickness 500 μm. The deflection at the start of creep, u0, is large compared to the thickness, indicating large plastic deformation. It is also noteworthy that the ratio between the time to reach the minimum deflection rate and time to rupture is consistently slightly above 0.5, and that the deflection is close to 1.5 mm when the minimum deflection rate is attained. This is consistent with observations reported in the literature e.g [Citation2,Citation3,Citation8]. The ruptured test piece has a hemispherical fracture surface with a diameter of typically 1–1.5 mm, which is also consistent with observations reported in the literature [Citation9,Citation15].
Table 1. Summary of small punch creep test data for 316 L(N) (u0 initial deflection; tr; time to minimum deflection rate; umin, utr/2 deflection and
,
deflection rate at
and
).
Model description
Visco-plastic constitutive model
The deformation of the disk in the small punch creep test generally includes significant initial plastic deformation followed by creep deformation, and locally also relaxation. A number of simplified assumptions are adopted for the analysis [Citation14]. The first one is that that the strain and strain rate can be split into a time-independent elastoplastic part, which consists of an elastic and plastic part, and a time-dependent creep part:
We do not have material data for the specific material batch so instead we calibrate the constitutive model to material data in RCC-MRx [Citation7] for 316 L(N). It should be stressed that since we deal with large deformations we refer to true stress and strains in the constitutive models. The plastic hardening is described by an analytical expression introduced by us,
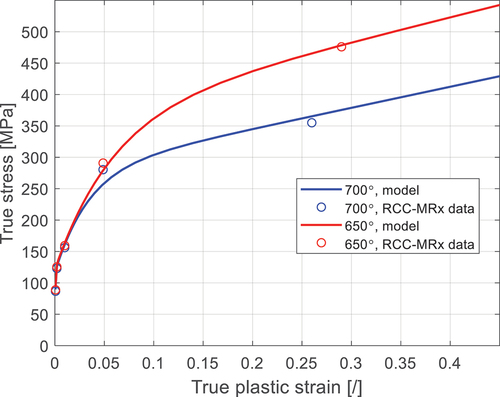
R0 defines onset of plastic deformation; H is a linear hardening term, and (Q1,b1) and (Q2,b2) describe the nonlinear hardening. shows the RCC-MRx design data and the material curve with the following material parameters for 700°C: E = 142.3 GPa, = 0.3, R0 = 89.7MPa, H = 336.4MPa, Q1 = 158.2MPa, b1 = 30.6, Q2 = 30.8MPa, b1 = 2545.
Figure 1. RCC-MRx mean true stress versus true plastic strain at 700°C and 650°C with extension beyond yield strength.
Given the very large variation in the stress and strain during the test, a phenomenological creep model was adopted, which is a function of the local stress and accumulated strain and which allows for primary, secondary and tertiary creep,
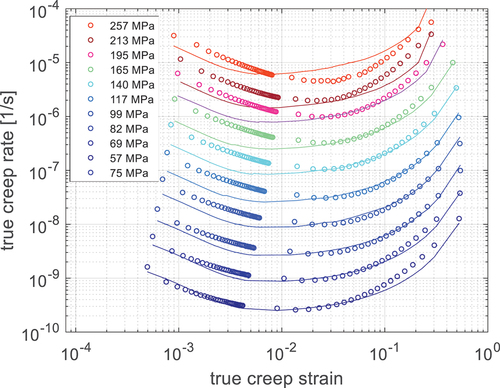
The terms K1, c1 and K2 and c2 describe primary and tertiary creep effects respectively. The K-parameters relate to the amplitude and the c-parameters to the creep strain for which the hardening/softening is active (c1 > c2 since primary hardening occurs at lower creep strains than tertiary softening). RCC-MRx provides equations for primary and secondary creep and time to rupture. The Logistic Creep Strain Prediction (LCSP) was used to derive a complete creep curve from the creep equations for primary and secondary creep whereas the tertiary creep part was derived from the time to minimum creep rate and the time to rupture [Citation14]. The resulting parameters were: K0 = 1210MPa, K1 = 592MPa, K2 = 122MPa, c1 = 650MPa, c2 = 13MPa and n = 6.43. shows the creep rates versus strain for different levels on the nominal stress for the Processed Design Data (symbols) and model (lines). The primary creep effect is a material effect whereas the tertiary effect is almost completely due to the increasing true stress as the creep deformation accumulates. Additional details about the model can be found in [Citation11,Citation14].
Figure 2. Processed RCC-MRx true creep rate vs. true creep strain at 700°C for different nominal stress levels (processed design data symbols and lines for the EquationEquation (3)(3)
(3) calibrated model).
Finite element implementation
The small punch sample is modelled as a two-dimensional axi-symmetric body using the finite element code ABAQUS [Citation16] with the dimensions from the experiment (receiving hole, RdL = 2 mm, upper hole, RdU = 2.5 mm, indenter radius, Rp = 1.25 mm, sample thickness h0 = 500 µm), . The spherical indenter and the upper and lower dies are modelled as non-deformable boundary lines. The indenter transmits the applied force, and since it is rigid, it imposes a perfectly spherical contact zone. The tensile and creep models described above are implemented using the Z-mat code [Citation17], which is integrated with ABAQUS. Note that the creep model (EquationEquation 3(3)
(3) ) is calibrated to the ‘forward’ creep deformation but also used for relaxation. Coulomb friction is imposed in the contact zone. It is well established that friction has a large impact on the deformation [Citation8,Citation10,Citation11,Citation13,Citation18]. The value of the friction coefficient, µ, depends primarily on the surface roughness of the disc and the ball and is not known, so different values will be adopted in the analysis to quantify the effect and to provide an estimate of the actual value in the experiments.
Figure 3. Schematic illustration of the implemented finite element model.
Creep rupture criterion
The model above will simulate the evolution of the deformation and associated stress and strain fields. The monotonically increasing deformation and increasing true peak stress will eventually result in visco-plastic collapse. This has sometimes been adopted as the rupture criterion, e.g [Citation9,Citation11], but is not a very physical criterion since the local strains become extremely large and require that the material is extremely ductile. A more physics-based approach is to use damage models, which has been done with mixed success [Citation12,Citation13,Citation18]. But in practice, this approach raises many questions: what is the mechanism? how is it translated into a mechanistic model? how should it be implemented and in particular how should the model parameters be calibrated? In this paper we will instead explore a simple local strain criterion. In recent unpublished uniaxial 316 L(N) creep in-house tests the creep ductility was typically 0.7. Can we use the uniaxial ductility to predict rupture for the small punch test? There are two fundamental differences between small punch and uniaxial creep: i) multi-axial versus uni-axial stress field and ii) the cross section strain is constant whereas in the small punch case in varies across the sample thickness. Creep ductility is affected by the stress tri-axiality: a negative stress ratio increases creep ductility and the lowest value is typically observed with a stress axiality of 1. If the uniaxial ductility, , is known, then the multiaxial ductility,
, is expressed as,
where the Multiaxiality Creep Ductility Factor (MDF) and the effective scalar strain,, are used
At high stresses, the ductility is controlled by plastic hole growth [Citation19]. A number of models have been proposed to derive MDFs [Citation20–25], most of them are based on void nucleation and growth representing high stress creep. summarises the most common ones. Note that the MDF in all cases depends on the ratio between the hydrostatic stress and the von Mises stress () and the Spindler approach [Citation24] models also uses the maximum principal stress
, and Wen and Cocks& Ashby also include Norton factor, n. The simple expressions have the advantage that MDFs can be computed by a simple post processing analysis of the finite element solution.
Table 2. Summary multi-axiality creep ductilty factors (MDF).
Results
Evolution of deformation and stress & strain fields
The finite element computations were carried out for applied loads 300, 400 and 500N and different friction coefficients ranging from 0 to 0.6. The applied load was increased to its maximum value in one second, and then kept constant. In each case the simulation progressed until plastic collapse occurred, defined by numerical convergence problems when the deflection rate became extremely high.
shows the computed deflection rates at the central lower surface (r = 0) versus time for six selected cases and the three experimental values. The deflection rates are normalised with the corresponding minimum deflection rate () and the time with time to plastic collapse (
) for computed values, and time to rupture (
) for the experimental ones. An important observation is that all computed cases fall on top each other and the three experimental ones also fall on top of each other; but there is a slight deviation between the computed and experimental curves. As mentioned above rupture is expected to occur prior to plastic collapse,
, which could explain the deviation between computed and experimental curves. To test this, a factor 0.9 was applied to the experimental time factor in ; it can be seen that the computed and experimental curves then fall on top of each other up to 0.8
, after which the experimental curve accelerates more and rupture is attained at 90% of the time for plastic collapse. It is likely that the higher deflection rate in the final phase is caused by the onset and growth of creep damage. This ‘Master Curve’ behaviour for the normalised deflection rate time history is very promising feature as it suggests that scaling can be applied. For instance, the minimum creep rate is attained typically at half the rupture time as also observed in tests. Although the normalised deflection rate/time curves are almost identical there are of course significant differences in absolute numbers. This is obvious for the applied loads since plastic creep and creep rates grow exponentially with the stress; but also the friction coefficient has a very large effect and it was shown in [Citation11] that the time to plastic collapse increases linearly with the friction coefficient and is five time larger for µ = 0.6 compared to µ = 0. The friction coefficient is very difficult to measure but can be inferred from comparing model predictions and experimental results. This is, however, not straightforward as discussed later.
Figure 4. Computed (lines) and experimental (symbols) normalised deflection vs. time (time to plastic collapse t/tpc (computation and time to rupture), t/tr, (experimental in ) a) experimental: t/tr b) experimental normalised time 0.9t/tr.
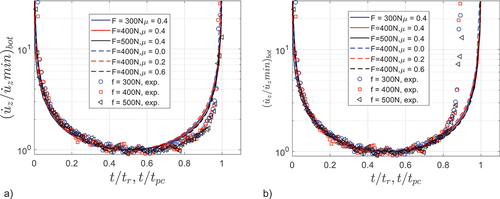
Figure 5. Evolution of the computed deformation and von Mises stresses for the case F = 400N, µ= 0.3. t = 0, 9min, 10h, 59h, 117h, 176h, 236h) t/tpc = (0,6.3e-4, 4.2e-2, 0.25, 0.5, 0.75,1), where tpc = 236h.
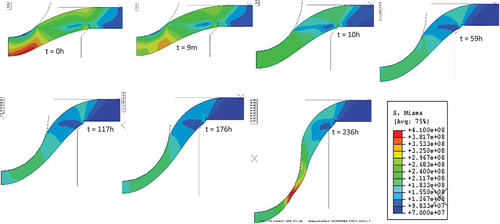
shows the computed deformation and the von Mises stress distribution at different times for the case F = 400N and µ = 0.3 and depicts the von Mises stress radial distribution at different times along the lower surface where the highest stress occurs. The very high initial stress along the lower surface under the spherical indenter relaxes almost immediately and then redistributes and a seemingly steady-state stress state follows from to
. When the plastic collapse is approached, the stress localises. In absence of friction the maximum stress occurs in the centre of the disk and then moves radially towards the edge of the contact zone between disk and indenter with increasing friction coefficient [Citation11]. In we see that at the initial stage the deflection rate decreases significantly, which is typical for primary creep. This is partially due to the primary creep in the creep model, seen in , but the stress relaxation and redistribution have actually a larger contribution to the apparent primary deflection rate effect [Citation11].
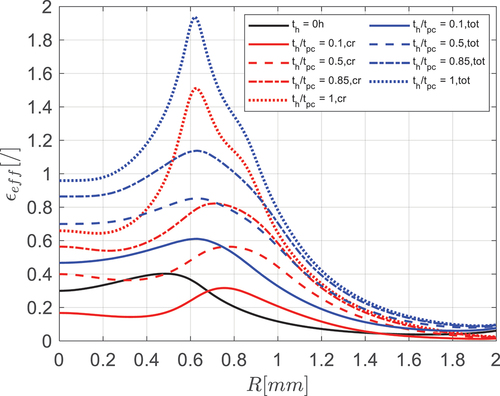
shows the radial distribution of the initial plastic strain (black line) along the lower surface plotted together with the creep strain at different times (red curves) and corresponding total strain (blue curves); t = 0 corresponds to the end of loading ramp and start of constant load. The simulations show that the initial plastic strain is virtually unchanged until plastic collapse when it increases again in the localised stress region. It should also be noted that the initial plastic strain in this case is 0.4, which is very high and that the total strain is 1.15 at .
Figure 6. Evolution of von Mises stress versus radial distance for different times for the case F = 400N, µ = 0.3.
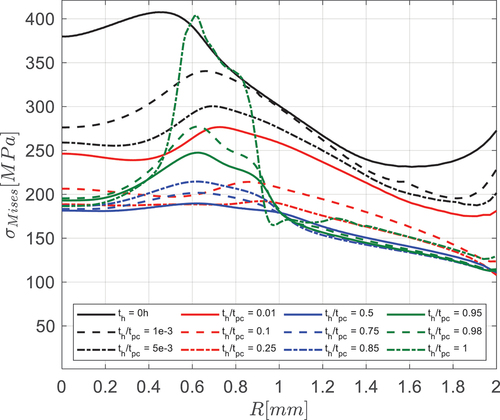
Figure 7. Evolution of effective stress versus radial distance for different times for the case F = 400N, µ = 0.3. (black: plastic strain), (red: creep strain), (blue :elastic+ plastic+creep strain).
Assessment of multi-axial ductility criteria
Figure 8. Computed for the case F = 300N and µ = 0.3.
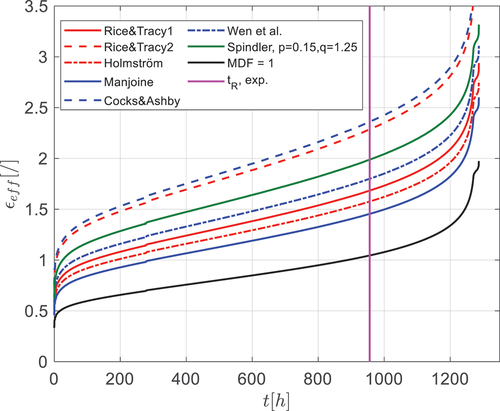
Figure 9. Computed values for for F = 300, 400 and 500N for the case, µ = 0.3.
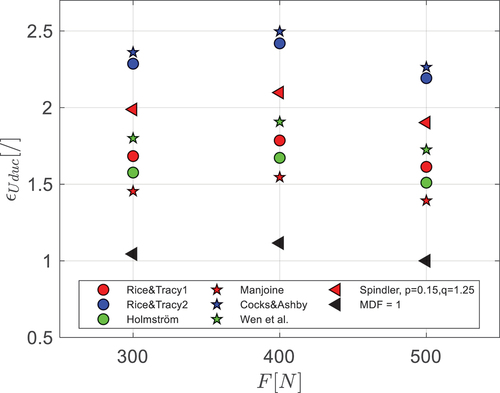
shows the distribution of when F = 300N and µ = 0.3 for each of the MDF cases and for MDF = 1. The uniaxial ductility
for each case is inferred from the intersection with the vertical line
= 956 h. The values range from 1 for MDF = 1 to 2.4 for Cocks & Ashby. It was mentioned above that the uniaxial ductility in uniaxial creep tests are 0.7, which is much lower than these values. The MDFs reported in literature are mainly from controlled bi-axial tests and exhibit significant scatter, for instance MDF for austenitic steels with perfect bi-axiality (
) give a range between 1 and 0.4 [Citation24], which corresponds to 1 and 2.5 in
Figure 10. Computed ratio between computed and experimental time to rupture assuming a local critical strain criterion based on µ = 0.3. a) total strain b) creep strain.
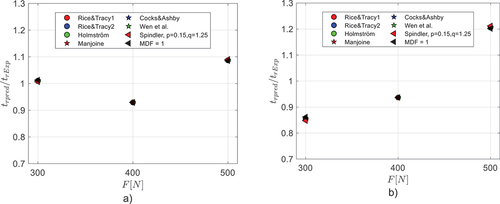
shows the resulting values of for the force 300, 400 and 500N for all MDFs. If the strain criterion holds true then
should be the same for the three loads. In reality, there may be significant scatter in experimental rupture times. For each MDF-case, the ductility values are very similar for the three loads, which supports the conjecture that rupture can be predicted by a local strain criterion. shows the ratio between the computed time to rupture using the mean value of the local rupture strain (
and the experimental values (
). depicts the corresponding predictions when using the creep strain. The difference between the three loads for case with total strain predictions is less than
10%, whereas for the creep strain there is a difference 30% and an increasing trend for
with increasing force. Thus, the total strain appears to be a much better criterion. Note that predictions are virtually identical for the different MDFs, which is a direct consequence of using the experimental values and MDFs being independent of the applied force. The results above are for µ = 0.3; a value µ = 0.4 gives somewhat lower values for
but the predictions for time to rupture are almost identical. Note that µ = 0.2 cannot be used since in this case the computed plastic collapse occurs before the measured time to rupture.
Assessment of friction coefficient
To assess the friction coefficient it is necessary to compare computed and measured deflection and deflection rates. The computed time to plastic collapse increases linearly with the friction coefficient [Citation11] and from this we can assume that the friction should be between 0.2–0.4. lists key parameters: the initial deflection, , time to rupture,
, time to reach minimum deflection rate,
, and associated deflection rate
and deflection,
, for experimental and computed values for F = 300,400 and 500N and µ = 0.2, 0.3 and 0.4. Three values are provided for the computed time to rupture, based on: total strain/creep strain/plastic collapse. lists the deflection and deflection rates at
. show the deflection and deflection rates respectively. In both cases there are three plots with different periods covering the time to rupture for the three loads respectively. The times to rupture using the total strain criterion with MDF = 1 and the ‘Holmström criterion’ are also indicated in the plots.
Figure 11. Experimental and computed deflection versus time for F = 300, 400 and 500N, µ = 0.2, 0.3, 0.4.
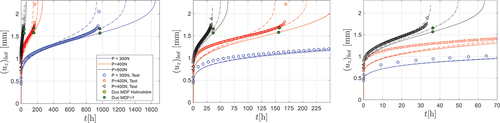
Figure 12. experimental and computed deflection rates versus time for F = 300, 400 and 500N, µ = 0.2, 0.3, 0.4.
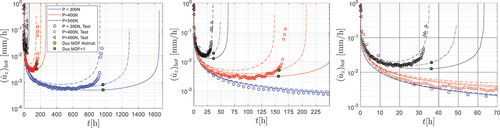
Table 3. Comparison experimental and computed values: time to rupture, based on local creep strain, local total strain, plastic collapse, , minimum deflection rate,
, and associated deflection,
.
Table 4. Comparison experimental and deflection and deflection rate at [0.5, 0.8, 0.85, 0.9].
It is important to capture the initial deflection as it affects the total deflection and true stress during the entire test. The computed initial deflection is slightly higher than the measured value. It is, however, virtually independent of the friction coefficient. The small deviation probably reflects a small difference between the RCC-MRx design data and this specific heat.
As already discussed above, the predicted time to rupture is quite accurately predicted using the total strain criterion for µ = 0.3 and 0.4 and by time to plastic collapse for µ = 0.2.
As seen in , the deflection rate is quite flat, which in combination with the noise in the deflection measurement makes it difficult to determine the time for minimum deflection rate in the tests. In the simulations, time to minimum creep rate increases whereas minimum deflection rate decreases with increasing µ. The overall best agreement is achieved for µ = 0.3.
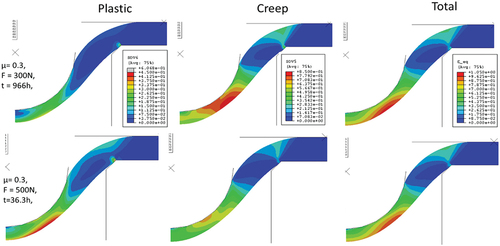
Figure 13. Computed deformation and strain distributions at time for rupture with total strain criterion (plastic, creep and total) at F = 300N (uppe)r and F = 400N (lower) for the case µ = 0.3. Note that the colour range differ between plastic, creep and total strain.
It can be noted from that the initial hardening is underestimated in the simulations. The ‘primary deflection rate effect’ is due to actual material hardening but also stress relaxation and redistribution. Both these effects are coupled to the primary creep properties. One obvious source for the deviation is the difference between the RCC-MRx design data and actual properties of the specific batch. Limitations in the creep model and calibration procedure could also be the reason. The deflection rate is a better measure that the deflection itself to assess the friction effect and there is actually excellent agreement between the computed and measured deflection rates for µ = 0.3 and 0.4 up to 80% of the time to rupture. The final stage in the experiments with accelerated deflection rate indicates damage induced softening and final rupture triggered by fracture. The final tertiary stage is affected by the true stress effect, material softening and strain localisation but also by the friction coefficient. The creep model, defined by EquationEquation (3)(3)
(3) , includes tertiary softening, but there is no specific tertiary creep strain data in RCC-MRx and the tertiary part of the creep model is calibrated only from minimum creep rate and time to rupture. compares computed and measured deflection and deflection rates at
. Again the overall best agreement is attained for µ = 0.3.
shows the computed deformation and plastic, creep and total strain at the time for predicted rupture using the total strain criterion for µ = 0.3 and F = 300N and 500N respectively. The higher load results of course in significantly higher plastic strain but the deformation and total strain distribution at the local critical strain are virtually identical. Thus, the lower plastic strain is compensated by the increased creep strain so independent of the load level it accommodates to the same total strain field at the rupture strain. This would also explain the Master Curve behaviour for the deflection rate seen in . The same behaviour is also seen for µ = 0.4.
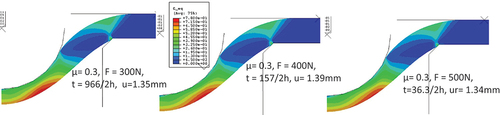
The very rapid stress relaxation and redistribution was illustrated in . The plastic strain is essentially unchanged and the strain accommodation occurs in the early stage. illustrates this for the three loads at half time to rupture. The stress and strain distributions depend on the friction coefficient. When there is no friction the highest stress and strain occur in the centre of the disc and with increasing friction coefficient the location with the peak values move radially [Citation14]. The location of the rupture is typically 0.6 mm in agreement with the simulations.
Figure 14. Computed deformation with total strain distributions at the computed half the time to rupture (t=tr/2) for F = 300, 400 and 500N. And µ = 0.3.
Concluding remarks
The deformation in the small punch test is characterised by large deformation including both plastic and creep deformation with simultaneous forward creep, stress relaxation and redistribution. A significant challenge is that the large variations in stresses across the sample infer a large range of creep rates for which specific creep data rarely exist. This was addressed in this paper by calibrating tensile and creep properties to generic material data from the design code RCC-MRx. The friction between the indenter and the disk has also a very large impact on the creep deformation, but unfortunately the friction coefficient is not known and almost impossible to determine separately. In this case we assessed the friction by conducting analyses with different friction coefficients and determine optimal value by the fitting the measured and computed deflection rate. A third challenge is the rupture criterion. In this paper we used a local critical strain that predicted the time to rupture quite well for the three loads with significant difference in time to rupture. We believe that the reason why the local strain worked quite well is that the final damage stage, which accelerates the creep rate, only occurs in the final stage. A very important feature of the small punch creep test is that the deformation progresses in a self-similar way which means that deflection rate, total strain and deformation are almost identical for different applied loads and friction coefficients when normalised with time to rupture. This allows scaling of the problem so that time to rupture can be predicted from computed or measured deflection rates well before rupture. The local rupture criterion worked quite well in this case but more data are needed to confirm its general applicability, both more data for the specific material, as well as for other material that have less creep ductility, such as ferritic-martensitic steels.
Disclosure statement
No potential conflict of interest was reported by the author(s).
References
- Dobeš F, Milička K. Application of creep small punch testing in assessment of creep lifetime. Mater Sci Eng. 2009;4:440–443. A510-511. doi: 10.1016/j.msea.2008.04.087.
- Holmström S, Li Y, Dymacek P, et al. Creep strength and minimum strain rate estimation from small punch creep tests. Mater Sci Eng A. 2018;731:161–172. doi: 10.1016/j.msea.2018.06.005
- Hyde TH, Stoyanov M, Sun W, et al. On the interpretation of results from small punch creep tests. J Strain Anal Eng Des. 2010;45(3):141–164. doi: 10.1243/03093247JSA592
- Kim JH, Ro U, Lee H, et al. A direct assessment of creep life based on small punch creep test. Theor Appl Fract Mech. 2019;104:102346. doi: 10.1016/j.tafmec.2019.102346
- Arunkumar S. Small punch creep test: an overview. Met Mater Int. 2020;27(7):1897–1914. doi: 10.1007/s12540-020-00783-w
- DIN EN 10371:2021. Metallic Materials. Small punch test method; English version. Berlin, Germany: German Institute for Standardization; 2021.
- RCC-MRx. Design and construction rules for mechanical components of Nuclear installations: high temperature, Research and fusion Reactors; afcen RCC-MRx code 2022. Edition ed. Courbevoie, France: Afcen; 2022.
- Dymáček P, Milička K. Creep small-punch testing and its numerical simulations. Mater Sci Eng. 2009;510-511, 444–449. doi: 10.1016/j.msea.2008.06.053
- Ganesh Kumar J, Laha K. Small punch creep deformation and rupture behaviour of 316L(N) stainless steel. Mater Sci Eng A. 2015;641:315–322. doi: 10.1016/j.msea.2015.06.053
- Rouse JP, Cortellino F, Sun W, et al. Small punch creep testing: review on modelling and data interpretation. Mater Sci Technol. 2013;29(11):1328–1345. doi: 10.1179/1743284713Y.0000000278
- Nilsson K-F, Baraldi D, Holmström S, et al. A numerical and experimental assessment of the small punch creep test for 316L(N) stainless steels. Metals. 2021;11(10):1609. doi: 10.3390/met11050609
- Yang S, Zheng Y, Ling X. Evaluation of multiaxial creep and damage evolution for small punch creep test considering critical-strain criterion. Eng Fail Anal. 2018;91:99–107. doi: 10.1016/j.engfailanal.2018.04.023
- Cortellino F, Rouse JP, Cacciapuoti B, et al. Experimental and numerical analysis of initial Plasticity in P91 steel small punch creep samples. Exp Mech. 2017;57(8):1193–1212. doi: 10.1007/s11340-017-0296-9
- Baraldi D, Holmström S, Nilsson K-F, et al. 316L(N) creep modeling with phenomenological approach and artificial intelligence based methods. Metals. 2021;11(5):698. doi: 10.3390/met11050698
- Wang L-Y, Song Z-M, Luo HM, et al. 3D X-ray tomography characterization of creep cavities in small-punch tested 316 stainless steels. Mater Sci Eng A. 2018;724:69–74. doi: 10.1016/j.msea.2018.03.048
- Abaqus Software. Available online: https://www.3ds.com/products-services/simulia/products/abaqus/
- Zmat Material Model Library Software. Available online: http://www.zset-software.com/products/z-mat/
- Wu W; Xiaozhe J; Hao L; Wie S. Determination of creep damage properties from small punch creep tests considering pre-straining effect using an inverse approach. Mech Mater. 2019;139:103171. doi: 10.1016/j.mechmat.2019.103171
- Hales R. The role of cavity Hales, R. The role of cavity growth mechanisms in determining creep-rupture under multiaxial stresses. Fatigue Fract Eng Mat Struct. 1994;17(5):579–591. doi: 10.1111/j.1460-2695.1994.tb00257.x
- Rice JR, Tracey DM. On ductile enlargement of voids in triaxial stress fields. J Mech Phys Solids. 1969;17(3):201–217. doi: 10.1016/0022-5096(69)90033-7
- Cocks ACF, Ashby MF. Intergranular fracture during power-law creep under multiaxial stresses. Met Sci. 1980;14(8–9):395–402. doi: 10.1179/030634580790441187
- Manjoine MJ. Creep-rupture behaviour of weldments Weld. J February. 1982;61:50–57s.
- Holmström S, Laukkanen A, Calonius K. Finding critical damage locations by Λ-filtering in finite-element modelling of a girth weld. Mater Sci Eng A. 2009;224–228. doi: 10.1016/j.msea.2008.04.107
- Spindler MW. The multiaxial creep ductility of austenitic stainless steels. Fatigue Fract Eng Mat Struct. 2004;27(4):273–281. doi: 10.1111/j.1460-2695.2004.00732.x
- Wen J-F, Tu S-H, Xuan F-Z, et al. Effects of stress level and stress state on creep ductility: evaluation of different models. J Math Sci Technol. 2016;32(8):695–704. doi: 10.1016/j.jmst.2016.02.014