
 ?Mathematical formulae have been encoded as MathML and are displayed in this HTML version using MathJax in order to improve their display. Uncheck the box to turn MathJax off. This feature requires Javascript. Click on a formula to zoom.
ABSTRACT
Regarding the application of the Monkman-Grant relationship to creep strength enhanced ferritic steels such as modified 9Cr-1Mo and 12Cr steels, there have been many reports showing that results tend to be an overestimation of the creep life in the long-term region. To address this issue, an author conducted a study to improve the estimation accuracy in the long-term region by the Monkman Grant relationship. Analysing the published creep test data for modified 9Cr-1Mo steel, the author found that the product of the minimum creep strain rate and rupture time (ƐMG) is not constant but depends on the loading conditions, which are test temperature and stress. Then, the author proposed an extended Monkman-Grant relationship considering the dependence of ƐMG on the loading conditions. When this model was applied to the data for modified 9Cr-1Mo and 12Cr steels, the creep life was predicted with good accuracy from the short-term to long-term regions.
Introduction
Modified 9Cr-1Mo steel is commonly used in 600°C class high efficiency thermal power plants. However, in Japan, creep life has been re-evaluated three times since 2005, and each time the allowable tensile stress and creep life evaluation formula have been revised downward [Citation1–8].
The main reason why the creep life has been reviewed multiple times is that there is no long-term creep test data corresponding to the actual operating time, so the creep life characteristics of the time range were estimated by extrapolation. Here, according to conventional knowledge, it is thought that the creep life could be estimated appropriately by extrapolation up to three times the maximum creep test time. It can be said that this notion does not apply in the case of the high chromium steels such as modified 9Cr-1Mo steel. From the viewpoint of ensuring reliability, it is desirable to evaluate the creep life of high-chromium steel by interpolation within the range of experimental data without extrapolation.
Therefore, it can be said that it is extremely important to conduct a long-term creep test and obtain experimental data corresponding to the actual operating time in evaluating the creep life of high-chromium steel. However, it is actually very difficult in terms of time and cost to acquire such long-term data.
One of the approaches to solve this problem is to apply a method of estimating the creep life of the test piece by performing a long-term creep test and analysing the creep strain data that can be measured during the test. The Monkman-Grant rule [Citation9,Citation10], the θ method [Citation11], and the Ω method [Citation12] have been proposed as formulas for estimating life by analysing creep strain data. Here, since the θ method and the Ω method require strain data in the tertiary creep stage to estimate the creep life, it is necessary to carry out the creep test until the latter half of the life. On the other hand, Monkman-Grant rule is a method that uses the minimum creep strain rate, and creep life can be estimated at a relatively early stage of life. Therefore, while the estimation accuracy obtained using the Monkman-Grant rule may not be as good as the accuracy obtained using the θ method or the Ω method, it can be said that the Monkman-Grant rule, which is expressed by EquationEquation (1)(1)
(1) , is most suitable for the purpose of estimating the long-term creep life by the shortest possible creep test.
Here, is the minimum creep strain rate,
is time to rupture, and C, the product of the minimum creep strain rate and time to rupture, is a material constant that is independent of temperature and stress. Since this feature is very useful from a practical point of view, many examples of the Monkman-Grant rule’s application to high-temperature materials have been reported [Citation13–17].
However, it has been reported that applying the Monkman-Grant rule to high-chromium steel can estimate the creep life with reasonable accuracy in the short-time range, but the life is estimated to be unsafe in the long-term range [Citation18,Citation19]. Then, in order to overcome the problem of the Monkman-Grand rule in the long-time region, modified Monkman-Grant rule has been recently proposed to estimate the creep life based on the time to reach the minimum creep strain rate instead of the minimum creep strain rate [Citation20,Citation21] and it has been reported that the creep life of the high-chromium steel in the long-term region can be estimated with high accuracy. This is great progress, whereas it is difficult to determine from an ongoing long-term test if the minimum creep rate has been reached or not due to negligible change of creep strain rate over long periods. In particular, when the strain rate is extremely low, it is difficult to judge whether creep deformation or fluctuation occurs. On the other hand, it seems that minimum creep strain rate can approximately be measured even when the strain rate is extremely low.
In this paper, research was conducted with the aim of developing a method that can appropriately estimate the long-term creep life of modified 9Cr-1Mo steel based on the minimum creep strain rate.
Creep data analysis
Data to be assessed
Creep data sheet No.43A [Citation22] for modified 9Cr-1Mo steel published by the National Institute for Materials Science (NIMS) was used in this study. The data sheet contains the creep test data for seven heats (MGA, MGB, MGC, MgA, MgB, MgC, and MGQ) obtained in the long-term region. Among them, the creep test data obtained at temperatures of 550, 600, and 650 °C, which are relatively close to the temperatures under actual service conditions, were subjected to analysis in this work. Among the data for the above-mentioned seven heats, those that had been obtained under test conditions not including the measurement of the minimum creep strain rate were excluded from the assessment data because the analysis in this study was based on the minimum creep strain rate, where creep deformation data of the steel were provided by NIMS.
show the relationship between stress and time to rupture (hereinafter referred to as ‘creep life’) and the relationship between minimum creep strain rate and stress, respectively, which are plotted using the creep test data for the seven heats. The creep life and strain rate vary significantly between the heats even at the same temperature and stress level. Also, the creep life sharply decreases as the time approaches 100,000 h. On the other hand, the slope of the minimum creep strain rate with respect to the stress starts to change around 3 × 10⁻⁵ %/h. To check a trend of creep strength depending on a heat of the material, I have indicated the heat with the lowest strength at 650°C in the long-term region with a solid symbol in , as an example. At least in these data, the heat with low strength in the long-term region appears already to have low strength in the short-term region. For reference, the heat with the lowest strength is also indicated in . The lowest strength heat appears to exhibit higher minimum creep strain rates than heat with high to low stress conditions.
Figure 1. Relationship between stress and creep life in NIMS data [Citation22].
![Figure 1. Relationship between stress and creep life in NIMS data [Citation22].](/cms/asset/2506e201-3b91-4980-835d-ab7e4065860f/ymht_a_2305498_f0001_c.jpg)
Figure 2. Relationship between minimum strain rate and stress in NIMS data [Citation22].
![Figure 2. Relationship between minimum strain rate and stress in NIMS data [Citation22].](/cms/asset/0e1c4e7b-8e6a-4e14-90fd-b616d6b19be3/ymht_a_2305498_f0002_c.jpg)
Assessment of applicability of existing prediction models
Regression analysis using the power law for the relationship between minimum creep strain rate and creep life, a typical alternative to the Monkman – Grant rule, was applied to the assessment data. The overall trend of the data is correctly reproduced as shown in . However, as shown in , the results tend towards un-conservative predictions in the region closer to actual service conditions (at 600 °C and exceeding 50,000 h).
Figure 3. Regression analysis of data by power law.
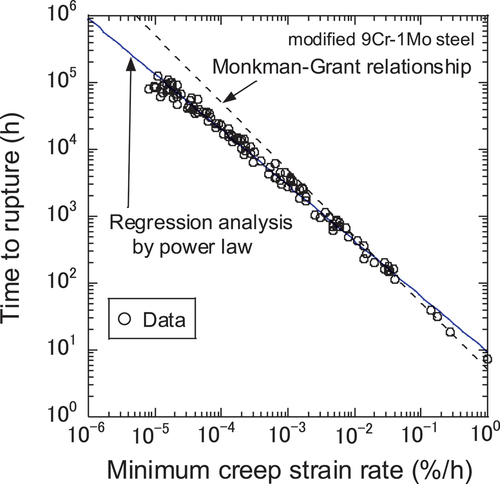
Figure 4. Comparison of creep life of data and estimated results at 600 °C.
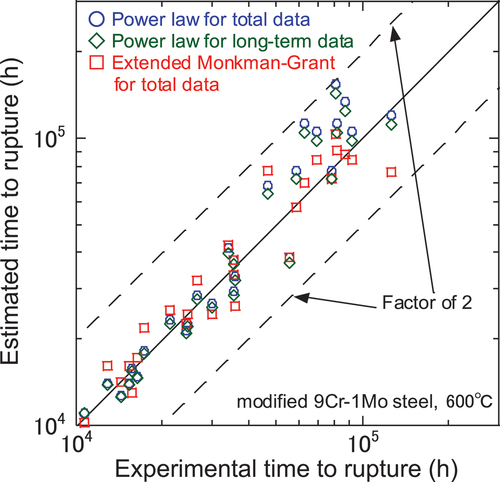
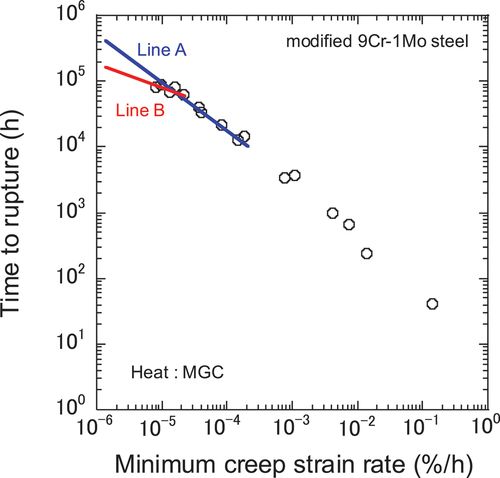
This may be because of the difference between the mechanism dominating the creep life in the short-term region and that in the long-term region. Therefore, the author performed the regression only on the data in the long-term region with a stress range lower than half of 0.2% offset yield stress, which is the threshold value used in region-splitting analysis [Citation1,Citation2]. shows the regression results. The accuracy of creep life prediction in the long-term region is greater than that for the regression performed as a whole; however, the results at 600 °C and exceeding 50,000 h still tend towards un-conservative predictions as shown in . Although the accuracy of long-term creep life prediction using the existing data can be increased by using only the data in the long-term region, such a method raises the fundamental issue of how to extrapolate the regression line to the region where no data are available. shows the relationship between the minimum creep strain rate and creep life of a heat (MGC) of modified 9Cr-1Mo steel. Both regression lines A and B are highly applicable to the existing data; however, it is impossible to determine which of the two regression lines is valid in the extrapolation region because no data are available.
Figure 5. Regression analysis of long-term data by power law.
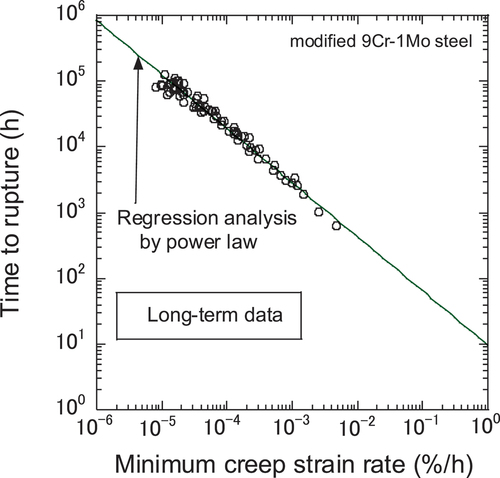
Figure 6. Relationship between minimum strain rate and time to rupture of NIMS heat MGC.
Data analysis
The author analysed the creep data from various aspects with the aim of improving the accuracy of creep life prediction in the long-term region. The results are summarised below.
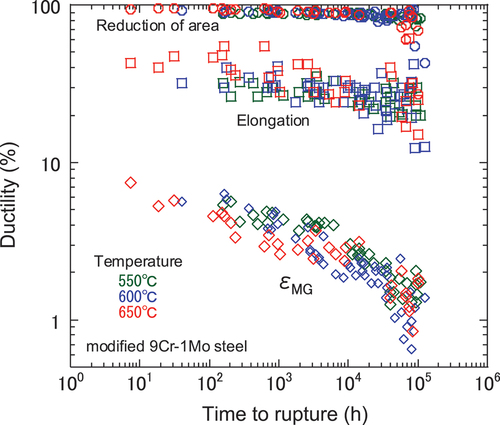
Relationship between creep ductility and creep life
shows the relationships between creep life and creep elongation, reduction of area, and ƐMG. Here, ƐMG is the product of the minimum creep strain rate and creep life, which is considered to be constant in the Monkman–Grant relationship and is denoted as C in EquationEq. (1)(1)
(1) . The creep elongation tends to decrease in the long-term region; however, the upper limit values remain almost the same as that in the short-term region even when the creep life reaches 100,000 h. Some data show that the reduction of area tends to decrease when the creep life exceeds 60,000 h; however, many other data suggest that the reduction of area is similar to those in the short-term region even when the creep life reaches ~ 100,000 h. ƐMG tends to decrease in the long-term region, sharply decreasing when the creep life reaches ~ 60,000 h, which is different from basic idea of Monkman Grant relationship.
Figure 7. Relationship between ductility and time to rupture.
Relationship between creep ductility and minimum creep strain rate
shows the relationships between minimum creep strain rate and creep elongation, reduction of area, and ƐMG. The creep elongation tends to decrease as the minimum creep strain rate decreases; however, the upper limit values remain almost the same even when the minimum creep strain rate varies by six orders of magnitude. Some data show that the reduction of area tends to decrease when the minimum creep strain rate is ~ 10−4 %/h or lower; however, many other data suggest that the reduction of area in the region with a higher minimum creep strain rate is almost the same as those in the region with a lower minimum creep strain rate. ƐMG tends to decrease as the minimum creep strain rate decreases, sharply decreasing when the minimum creep strain rate reaches ~ 2 × 10⁻⁵ %/h. The relationship may be expressed by the following equations,
Figure 8. Relationship between ductility and minimum strain rate.
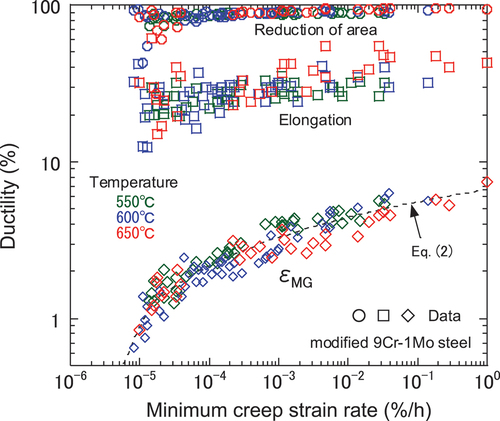
here, the strain and strain rate are expressed as % and %/h, respectively. The dashed line in is drawn by the above equations while it is unclear whether this relationship holds true even in strain rate region smaller than the data lower limit of 8 × 10⁻⁶ %/h.
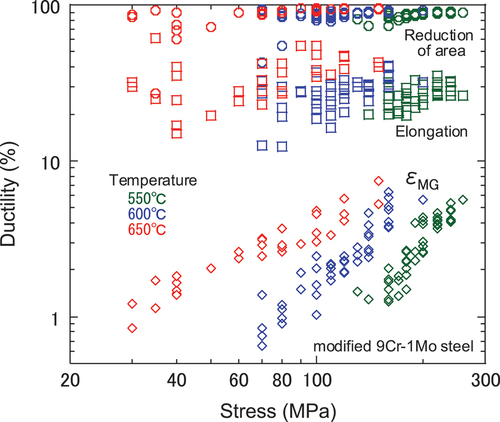
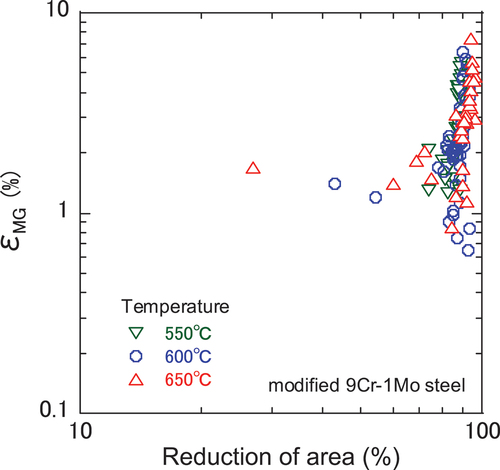
Relationship between creep ductility and stress
shows the relationships between stress and creep elongation, reduction of area, and ƐMG. The creep elongation tends to decrease as the stress decreases for a certain heat at a certain temperature; however, the opposite tendency is observed for the same heat at different temperatures. The reduction of area tends to decrease as the stress decreases for some heats; however, it remains almost the same for other heats even at a lower stress level. Overall, no clear relationship is observed between reduction of area and stress. ƐMG generally depends on the temperature and stress, although the values are widely dispersed. ƐMG decreases as the stress decreases at the same temperature. Also, ƐMG decreases as the temperature decreases at the same stress level. It is considered that the product of the minimum creep strain rate and time to rupture is constant independent of the temperature or stress in the Monkman – Grant rule. However, shows that ƐMG is not constant. The change in ƐMG with the temperature and stress seems to be the reason why the Monkman – Grant rule is not applicable to modified 9Cr-1Mo steel in the long-term region.
Figure 9. Relationship between ductility and stress.
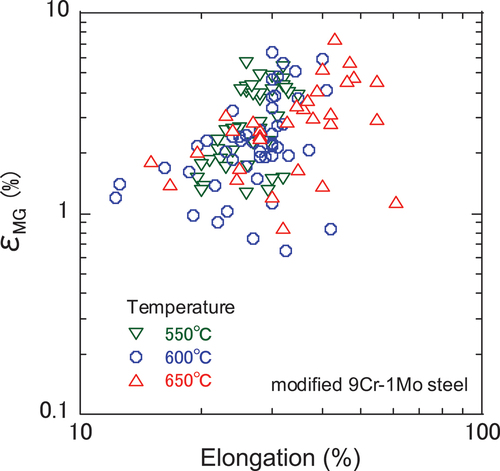
shows the relationship between ƐMG and creep elongation. It is generally assumed that ƐMG tends to decrease as the creep elongation decreases. However, such a relationship is not observed in . No clear corresponding relationship is observed between ƐMG and creep elongation because, as explained above, ƐMG decreases as the time to rupture increases but the creep elongation can increase in the long-term region according to some data. This may be because ƐMG represents the strain required for rupture, which is caused by the component of the minimum creep strain rate during the entire creep life. On the other hand, the creep elongation mostly occurs in the accelerated creep period, and it also includes localised deformation (necking) in the gauge section that occurs in the accelerated creep period. Namely, the meaning of deformation represented by ƐMG is different from that represented by creep elongation. ƐMG indicates the mean amount of deformation during the entire creep life, whereas the creep elongation is affected by the non-uniform deformation that occurs during the accelerated creep period.
Figure 10. Relationship between εMG and elongation.
shows the relationship between ƐMG and reduction of area. It is generally assumed that ƐMG tends to decrease as the creep elongation decreases. However, such a relationship is not observed in . The reason why no relationship is observed between ƐMG and reduction of area is the same as that in the case of ƐMG and creep elongation. The vertical and horizontal axes in are logarithmic; however, no corresponding relationship is observed between ƐMG and reduction of area even if the horizontal axis is linear.
Figure 11. Relationship between εMG and reduction of area.
Proposal of Monkman – Grant relationship considering dependence of creep ductility on loading conditions
Assessment of dependence of creep ductility on loading conditions
From the results in the previous section, the product of the minimum creep strain rate and time to rupture life is not constant and depends on the loading conditions (temperature and stress). The author therefore formulated ƐMG as a power law of stress using functions of temperature as the coefficients and exponents, as shown in . Above mentioned ƐMG is denoted as , and the following is the equation determined by regression of the experimental data.
Figure 12. Modelling of dependence of εMG on temperature and stress.
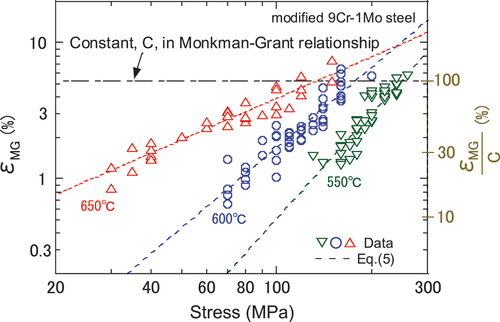
Here, T is the temperature in Celsius (oC) and σ is the stress (MPa). While the product of the minimum creep strain rate and time to rupture assumed in the Monkman – Grant rule, EquationEquation (1)(1)
(1) , is constant regardless of temperature and stress,
obtained by EquationEquation (5)
(5)
(5) decreases as the temperature decreases at the same stress level. Also, ƐMG decreases as the stress decreases at the same temperature. The label on the vertical axis on the right side of indicates the value obtained by dividing each ƐMG by the constant C for modified 9Cr-1Mo steel [Citation23] in EquationEquation (1)
(1)
(1) . In the data for each temperature, when the stress is relatively high, ƐMG and the constant C are approximately the same values, but when the stress is relatively low, ƐMG is about 10 to 20% of the constant C. This means that it is not considered reasonable to set the product of the minimum creep strain rate and rupture time to a constant value in EquationEquation (1)
(1)
(1) .
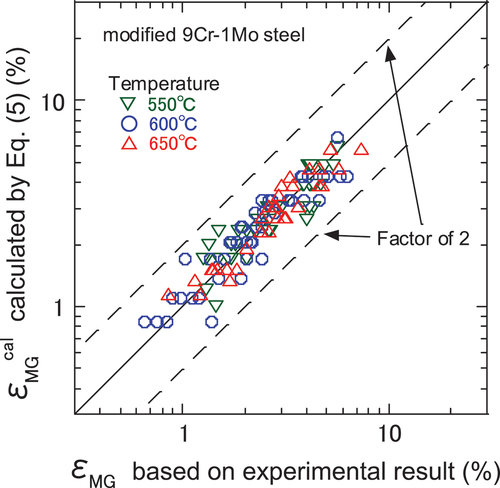
shows a comparison of ƐMG on the basis of experimental data and calculated by EquationEquation (5)(5)
(5) . Regarding all data from 550 to 650 °C evaluated in this study, it is found that the experimental and calculated values of ƐMG agree within the range corresponding to a factor of two. In this paper, the creep life prediction model using
calculated by EquationEquation (5)
(5)
(5) and the minimum creep strain rate is called the extended Monkman – Grant relationship, which is expressed by following eqaution.
Figure 13. Comparison of experimental εMG and calculated εMG.
Interpretations of characteristics of long-term creep life
The followings are some interpretations of the characteristics of long-term creep life based on the extended Monkman – Grant relationship.
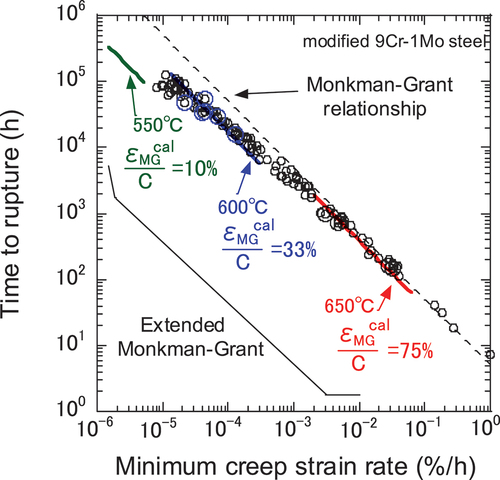
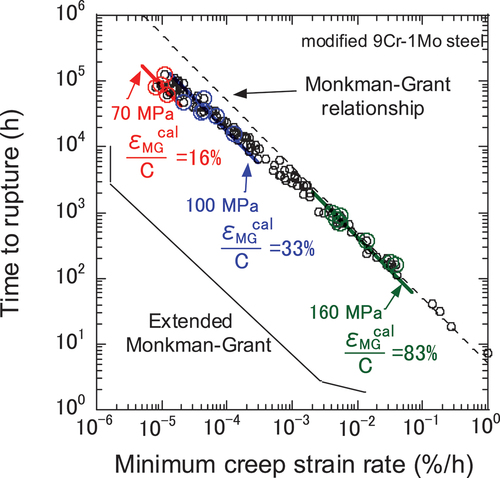
First, let us consider the case where the stress is constant and the temperature varies. For example, when the stress is 100 MPa, ƐMG is 3.9% at 650 °C, 1.7% at 600 °C, and 0.5% at 550 °C from EquationEquation (5)(5)
(5) . Compared with the constant C obtained using the Monkman – Grant rule for modified 9Cr-1Mo steel (5.2%) [Citation23], ƐMG obtained by EquationEquation (5)
(5)
(5) is approximately 75% of the above value at 650 °C, 33% of the above value at 600 °C, and 10% of the above value at 550 °C. ƐMG becomes much smaller than the value indicated by the creep life prediction line obtained using the Monkman – Grant rule with decreasing temperature. Also, ƐMG is more likely to be plotted in the long-term region as the temperature decreases at the same stress level. As a result, the difference between the extended Monkman – Grant relationship and the Monkman – Grant rule becomes more distinct in the long-term region as shown in . The solid lines in represent the differences between the heats for the minimum creep strain rate at the same temperature and stress level.
Figure 14. Schematic of assessment by extended monkman-grant relationship: stress 100 MPa.
Next, let us consider the case where the temperature is constant and the stress varies. For example, when the temperature is 600 °C, ƐMG is 4.3% at 160 MPa, 1.7% at 100 MPa, and 0.8% at 70 MPa from EquationEquation (5)(5)
(5) . Compared with the constant C using the Monkman – Grant rule (5.2%) [Citation23], ƐMG obtained by EquationEquation (5)
(5)
(5) is approximately 83% of the above value at 160 MPa, 33% of the above value at 100 MPa, and 16% of the above value at 70 MPa. ƐMG becomes much smaller than the creep life prediction line obtained using the Monkman – Grant rule as the stress decreases. Also, ƐMG is more likely to be plotted in the long-term region as the stress decreases at the same temperature. As a result, the difference between the extended Monkman – Grant relationship and the Monkman – Grant rule becomes more distinct in the long-term region as shown in .
Figure 15. Schematic of assessment by extended monkman-grant relationship: temperature 600 ℃.
Results of creep life prediction
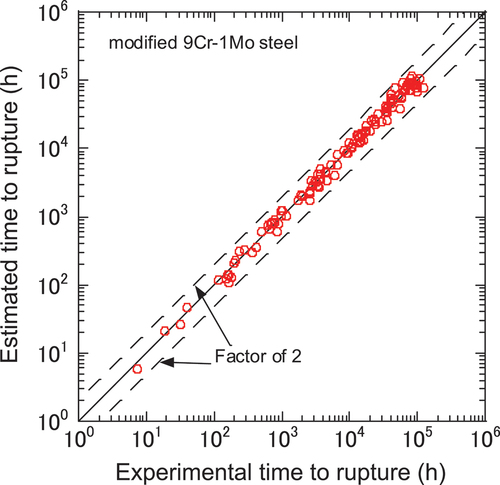
shows the results of creep life prediction performed by applying the extended Monkman – Grant relationship to the data for the seven heats of modified 9Cr-1Mo steel. All data are plotted within a range corresponding to a factor of two from the short-term to long-term regions. The prediction accuracy is high. As explained in the previous section, the results in long-term region by the power law tend towards un-conservative predictions (). No such tendency is observed in the results of creep life prediction using the extended Monkman – Grant relationship. It can thus be concluded that the accuracy of long-term creep life prediction for modified 9Cr-1Mo steel using the extended Monkman – Grant relationship is superior to that using the Monkman – Grant rule or the power law.
Figure 16. Comparison of creep life of data and estimated results by extended monkman-grant relationship.
Assessment of validity
In this section, the extended Monkman – Grant relationship is applied to Grade 122 steel (hereinafter referred to as ‘12Cr steel’) to assess the validity of this prediction model in the long-term region. It is well known that the accurate prediction of the long-term creep life of 12Cr steel is more difficult than that of modified 9Cr-1Mo steel [Citation1,Citation5].
Data to be assessed
Creep data sheet No.51B [Citation24] for 12Cr steel published by NIMS was used in this study. This data sheet contains the creep test data for three heats. Similarly to the analysis on modified 9Cr-1Mo steel, the creep test data obtained at temperatures of 550, 600, and 650 °C were subjected to the analysis.
shows a comparison of the relationship between stress and creep life for 12Cr and modified 9Cr-1Mo steels. The bending of the data curve in the long-term region is more significant for 12Cr steel.
Figure 17. Comparison of 12Cr [Citation24] and mod.9Cr-1Mo [Citation22] steels regarding relationship between stress and creep life.
![Figure 17. Comparison of 12Cr [Citation24] and mod.9Cr-1Mo [Citation22] steels regarding relationship between stress and creep life.](/cms/asset/65e73af7-2e49-4020-b7e3-49417fed754e/ymht_a_2305498_f0017_c.jpg)
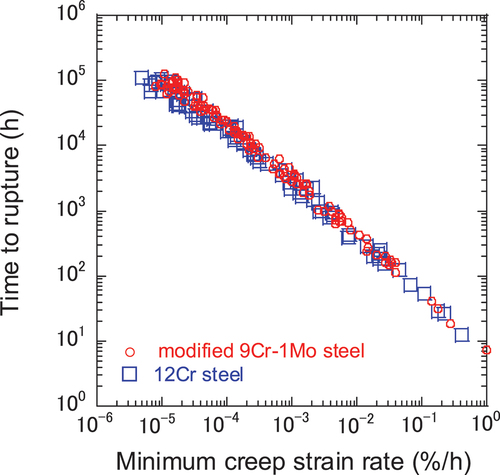
shows a comparison of the relationship between minimum creep strain rate and creep life for 12Cr and modified 9Cr-1Mo steels. The relationships are almost the same up to ~ 10,000 h. After that, the data for 12Cr steel tend to be plotted slightly lower than those for modified 9Cr-1Mo steel.
Figure 18. Comparison of 12Cr and mod.9Cr-1Mo steels regarding relationship between minimum creep strain rate and creep life.
Application of extended Monkman – grant relationship
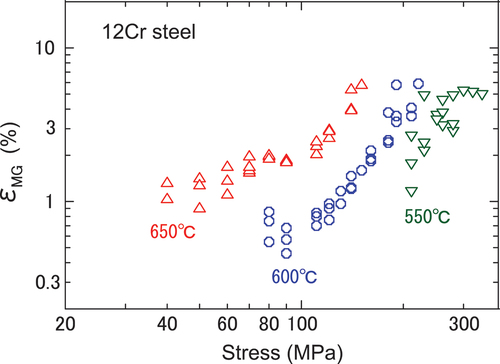
shows the relationships between ƐMG and temperature and stress for 12Cr steel. ƐMG depends on the temperature and stress, decreasing as the stress decreases at the same temperature and decreasing as the temperature decreases at the same stress level. Similarly to the analysis of modified 9Cr-1Mo steel, the author formulated ƐMG as a function of temperature and stress by EquationEquation (7)(7)
(7) to derive the extended Monkman – Grant relationship for 12Cr steel.
Figure 19. Dependence of εMG on temperature and stress in 12Cr steel.
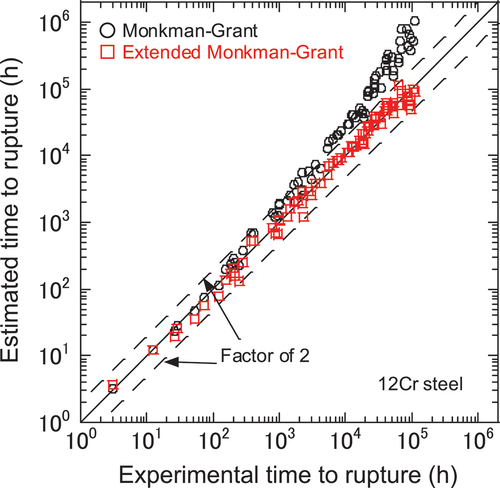
shows the results of creep life prediction for 12Cr steel obtained using the extended Monkman – Grant relationship along with the results obtained using the Monkman – Grant rule. While the prediction results obtained using the Monkman – Grant rule are valid in the short-term region, those in the long-term region tend towards un-conservative predictions. The predicted creep life is over 10 times longer than the measured creep life in some cases. On the other hand, all the prediction results obtained using the extended Monkman – Grant relationship are plotted within the range corresponding to a factor of two from the short-term to long-term regions. Also, the results do not tend towards un-conservative predictions even in the long-term region.
Figure 20. Comparison of creep life of 12Cr steel data and estimated results by conventional and extended monkman-grant relationship.
From the above results, it seems that the creep life of 12Cr steel can be predicted with good accuracy using the extended Monkman – Grant relationship. The results suggest that the extended Monkman – Grant relationship can also be applied to materials for which the creep life curve sharply drops in the long-term region.
Utilization of results
The author has conducted a series of creep tests under a wide range of load conditions using modified 9Cr-1Mo steel, systematically varying the chemical composition and heat treatment conditions, in a joint research project with related institutions [Citation25]. In this project, in addition to rupture data in the long-term region, the minimum creep strain rates of the materials under load conditions equivalent to service conditions of actual plants are also being obtained.
By combining these data with the results of this study, creep lives of the materials can be estimated for long-term ranges where it is difficult to obtain rupture data. Although they are not rupture data and are not used in regression analysis for setting allowable stress, it is suggested that they may be useful information when considering the validity of allowable stress and creep life evaluation formulas. In particular, they are expected to be useful for extremely long-term creep evaluations, such as 250,000 h creep strength evaluations where we have to rely on the extrapolation of regression curves because there are no rupture data in this time period. This is the background of this study. As mentioned in Introduction, in Japan, the allowable stress and creep life evaluation formulas of modified 9Cr-1Mo steel have been revised every time new long-term data were acquired [Citation1–8], and it is considered that the reason for this is the lack of long-term data.
Conclusions
The findings of this study are summarised below.
By analysing the published creep test data for modified 9Cr-1Mo steel, the author found that the product of the minimum creep strain rate and rupture time (ƐMG) is not constant but depends on the loading conditions (temperature and stress).
The author proposed an extended Monkman – Grant relationship considering the dependence of ƐMG on the loading conditions. When this model was applied to the data for modified 9Cr-1Mo and 12Cr steels, the creep life was predicted with good accuracy from the short-term to long-term regions.
Disclosure statement
No potential conflict of interest was reported by the author(s).
References
- Kimura K. Assessment of long-term creep strength and review of allowable stress of high Cr ferritic creep resistant steels. Proc. PVP2005; Denver, USA; 2005. PVP2005–71039.
- Kimura K. Creep strength assessment and review of allowable tensile stress of creep strength enhanced ferritic steels in Japan. Proc. PVP2006-ICPVT-11; Vancouver, Canada; 2006. PVP2006-ICPVT-11–93294.
- Tabuchi M, Takahashi Y. Evaluation of creep strength reduction factors for welded joints of modified 9Cr-1Mo steel (P91). Proc. PVP2006-ICPVT-11; Vancouver, Canada; 2006. PVP2006-ICPVT-11–93350.
- Takahashi Y, Tabuchi M. Evaluation of creep strength reduction factors for welded joints of HCM12A (P122). Proc. PVP2006-ICPVT-11; Vancouver, Canada; 2006. PVP2006-ICPVT-11–93488.
- Kimura K, Takahashi Y. Evaluation of long-term creep strength of ASME grades 91, 92 and 122 type steels. Proc. PVP2012; Toronto, Canada; 2012. PVP2012–78323.
- Yaguchi M, Matsumura T, Hoshino K. Evaluation of long-term creep strength of welded joints of ASME grades 91, 92 and 122 type steels. Proc. PVP2012; Toronto, Canada; 2012. PVP2012–78393.
- Kimura K, Yaguchi M Re-evaluation of long-term creep strength of base metal of ASME grade 91 type steel. ASME Pressure Vessels and Piping Conference; Vancouver, Canada. 2016. p. PVP2016–63355.
- Yaguchi M, Nakamura K, Nakahashi S. Re-evaluation of long-term creep strength of welded joint of ASME grade 91 type steel. ASME Pressure Vessels and Piping Conference; Vancouver, Canada. 2016. p. PVP2016–63316.
- Monkman FC, Grant NJ, An empirical relationship between rupture life and minimum creep rate in creep-rupture test. Proc. ASTM; 1956. p.593–620, Vol. 56.
- Doves F, Milicka K. The relation between minimum creep rate and time to fracture. Metal Sci. 1976;10(11):382–384. doi: 10.1080/03063453.1976.11683560
- Evans RW, Wilshire B. Creep of metals and alloys. Boca Raton, USA: Institute of Metals; 1985. p. 197.
- Prager M. Development of the MPC omega method for life assessment in the creep range. J Pressure Vessel Technol. 1995;117(2):95–103. doi: 10.1115/1.2842111
- Povolo F. Comments on the monkman-grant and the modified monkman-grant relationships. J Mater Sci. 1985;20(6):2005–2010. doi: 10.1007/BF01112283
- Sundararajan G. The monkman-grant relationship. Mater Sci Eng A. 1989;112:205–214. doi: 10.1016/0921-5093(89)90360-2
- Evans M. Further analysis of the Monkman–grant relationship for 2·25Cr–1Mo steel using creep data from the national research institute for metals. Mater Sci Technol. 1999;15(1):91–100. doi: 10.1179/026708399773003367
- Kvapilova M, Dvorak J, Kral P, et al. Applications of the monkman-grant relationship for ultrafine-grained metallic materials. Key Eng Mater. 2013;577:137–140. doi: 10.4028/www.scientific.net/KEM.577-578.137
- Osman AH, Tamin MN. Modified Monkman–grant relationship for austenitic stainless steel foils. J Nucl Mater. 2013;433(1–3):74–79. doi: 10.1016/j.jnucmat.2012.08.048
- Shrestha T, Basirat M, Charit I, et al. Creep Rupture Behavior of Grade 91 Steel. Mater Sci Eng A. 2013;565:382–391. doi: 10.1016/j.msea.2012.12.031
- Choudhary BK. Tertiary creep behavior of 9Cr-1Mo ferritic steel. Mater Sci Eng A. 2013;585:1–9. doi: 10.1016/j.msea.2013.07.026
- Abe F Creep deformation parameters and creep life of Gr.91 pressure vessels and piping conference, PVP2013–97319, 2013.
- Abe F. Creep deformation and microstructure parameters determining creep life of Gr.91 and some high-cr martensitic steels. 4th International ECCC Conference; Düsseldorf, Germany. 2017.
- NIMS, Creep Data Sheet, No.43A, 2014.
- Abe F. Creep behavior, deformation mechanisms and creep life of mod. 9Cr-1Mo steel. Metall Mater Trans A. 2015;46(12):5610–5625. doi: 10.1007/s11661-015-3144-5
- NIMS, Creep Data Sheet, No.51B, 2020.
- Yaguchi M, Hamaguchi T, Miki K, et al. Effects of chemical composition and heat treatment on creep property of grade 91 steel base metal and welded joint. Mater High Temp. 2022;39(6):689–701. doi: 10.1080/09603409.2022.2136127