
 ?Mathematical formulae have been encoded as MathML and are displayed in this HTML version using MathJax in order to improve their display. Uncheck the box to turn MathJax off. This feature requires Javascript. Click on a formula to zoom.
ABSTRACT
In this paper, a new high-temperature methodology for determining the ‘effective’ corrosion rates of internal pressure-tested cladding tubes, based on the reduced creep failure times under exposure, is presented. The methodology has been developed to estimate the combined damage accumulation of corrosion and creep and to establish temperature limits for the use of 1515Ti claddings in high-temperature Lead-Bismuth-Eutectic (LBE). The results are compared to static corrosion rates determined from earlier test campaigns in stagnant LBE. All tests are conducted on 24% cold worked 1515Ti cladding tubes that are the SCK CEN reference material for the MYRRHA design efforts. The virgin material creep model that is the basis for the corrosion rate estimation, has been fitted on an extended creep failure database and a life-fraction rule is applied to accommodate for the life reduction caused by the sought ‘constant’ effective corrosion rate.
Introduction
This work demonstrates a new method of determining the ‘effective’ corrosion rate of 24% cold worked (24%CW) 1515Ti cladding tubes (DIN 1.4970 austenitic steel) under exposure in high-temperature lead-bismuth eutectic (LBE) coolant. 1515Ti was excessively creep tested during the 1970–80s as it was intended as a primary cladding material for the fast reactor SNR-300 (German-Belgian-Dutch prototype fast breeder reactor) [Citation1]. The material has again become of great interest in the significant creep range as small modular reactors are currently in the spotlight for advanced nuclear power and heat generation [Citation2].
The here presented method of utilising creep for the estimation of high-temperature corrosion rates is based on using the reduced creep failure times recorded for internal pressure cladding samples under exposure to deduce the material loss of the tested sample. The method is verified in this work by corrosion–creep testing in the temperature range of 650–800°C in the High Pressure Corrosion–Creep (HPCC) test facility at SCK CEN. The high-temperature material tensile strengths and creep properties that are the base of the here used life-fraction methodology have been determined during a number of projects, the EERA JPNM pilot project TASTE [Citation3], the European project Patricia [Citation4] and SCK CEN internal development projects. The creep data used for the thermal creep properties comprise historical data compiled and assessed earlier at SCK CEN [Citation5]. The specific material properties and models used in this work are based on results covering the cold work range of 16–24%, specifically in the claddings produced for the MYRRHA research projects.
Material and experimental details
The chemical composition of 1515Ti steel (1.4970), in particular the 24% cold worked steel cladding tubes, used in this work is given in together with cladding dimensional control (quality) parameters [Citation6].
Table 1. Chemical compositions (wt%) of the alleima (prev. Sandvik) ‘reference’ materials, 20% cold drawn bar and 24% cold worked cladding tube (with dimensional control parameters).
The data used for fitting the creep model (in air) have been extended to temperatures beyond the range of the historical database (up to 750°C) [Citation5] by adding ‘synthetic’ data at the very high temperature range using the creep rupture model published in the recent CEA PhD [Citation7], increasing the available prediction range up to ~950°C [Citation8].
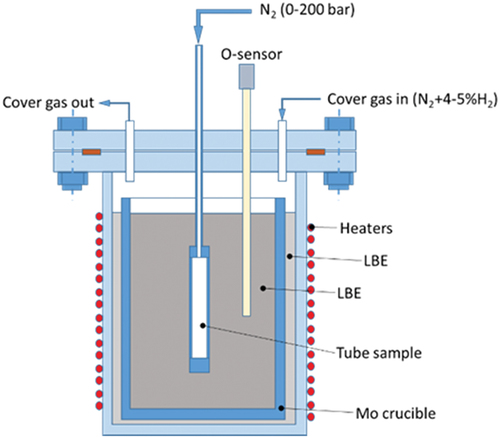
HPCC test facility at SCK CEN comprises a low-oxygen atmosphere vessel (stainless-steel autoclave) with feedthroughs in the lid for gas inlet/outlet, thermocouples and oxygen sensors (Bi/Bi2O3 electrochemical). The inner molybdenum crucible is filled with liquid Pb-Bi eutectic and the samples are immersed, as shown in . The here presented test conditions are in the temperature range of 650–800°C and a pressure range of 30–200 bar selected to reach acceptable durations of failure. The Pb-Bi oxygen levels provide dominantly dissolution corrosion mode (low oxygen content). The low level of oxygen concentration is provided by purging of N2 +4–5% H2 cover gas mixture over the surface of liquid metal.
Figure 1. Corrosion and creep test set-up for internal pressure testing in LBE.
Methodology for determining corrosion rates utilising known creep properties
The methodology of extracting effective corrosion rates from time to failure of internally pressurised cladding tubes exposed to LBE is as follows:
Calculate a predicted time to rupture (tu) for each data reading of the test as a function of the current temperature Ti and pressure pi (see EquationEquations 2
(2)
At each time step during exposure, the measured internal pressure induces a hoop stress R0i that depends on the reaming cladding tube outer radius (Du-
For each time step, the corresponding consumed Life Fraction LFcreep [Citation10] is calculated as given in EquationEquation 4.
The LFcreep at the moment of burst is then made to converge towards a value of unity, LFcreep-(at burst) = 1 by iteratively changing the effective corrosion rate
The sought effective corrosion rate value of each test is attained when LFcreep = 1 at the time of burst.
It is to be noted that when comparing measured and predicted corrosion depths c, as given in EquationEquation 5
The here applied Wilshire creep model (WE) uses the tensile strength at test temperature, Rm(T) for normalisation of the creep stress as given in EquationEquation 2.(2)
(2) The applicability of the methodology for estimating the effective corrosion rates is considered to be the same as the range covered by the creep model.
Testing and assessment results
The HPCC test matrix performed is shown in . It is to be noted that some the initial tests did not have the full data acquisition capabilities in place yet and were conducted as sighting tests with variations in pressure and temperature control. For these tests only, the ‘final’ failure time (under pressure) was recorded and only the nominal pressure conditions are known, i.e. the nominal target test temperature, initial set pressure and the time to failure. These tests naturally have larger uncertainties in the estimated effective corrosion depths and corrosion rates due to the difficulty in correcting the calculated corrosion depths with the true time under significant corrosion. However, the estimated effective corrosion rates do comply rather well with the measured ones as will be shown later. The tests indicated in the table as having equal ‘creeping time’ (under pressure) and corrosion time are the ones with a larger uncertainty in the actual conditions.
Table 2. Test conditions for the HPCC tests. Note that the test greyed with a ratio corroding time/creeping time = 1 ratio were sighting tests not fully instrumented.
The ‘corrosion time’ in this work was defined as the time the sample has been at a temperature ≥0.98·Ttest(K). The uncertainties related to pre-corrosion of the initial wall thickness before applying the pressure and the corrosion acquired after the failure are more pronounced at higher temperatures and at high pressures.
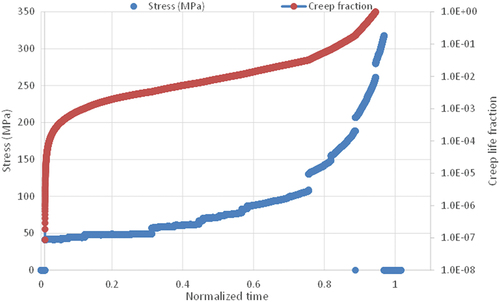
In , the HPCC test for sample TB-259 conducted at 750°C/60 bar is shown. It can be seen that there are some fluctuations in the pressure during the test duration. If these fluctuations are moderate, it will not affect the estimation of corrosion rate since the creep model and life fraction rule applied use the actual raw data pressure for stress as described in the methodology section. The resulting calculated life fraction (LF) and increasing stress is plotted .
Figure 2. HPCC test with internal pressure for sample TB-259 at 750°C/60 bars. The pressure is given in red (right y-axis) and the temperature in blue (left y-axis).
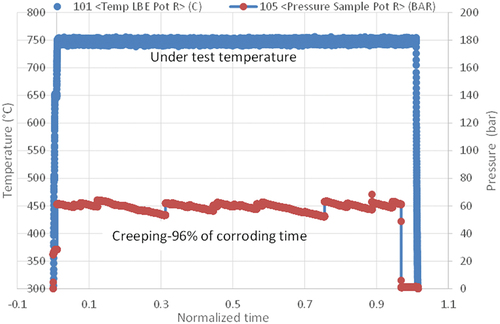
Figure 3. Creep life fraction (red, right logarithmic y-axis) and hoop stress development (blue, left y-axis) as a function of time for the TB-259 sample tested in LBE at 750°C/60 bars. The LF = 1 is iteratively solved by optimising the effective corrosion rate. The duration of creep failure of an equivalent test in air has an estimated failure time of approximately 10 000 hours (~1.1 years).
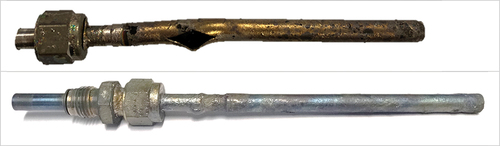
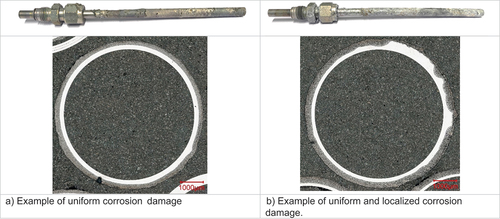
Examples of failed samples and differences in ‘failure modes’, e.g. ripped tube from the high-pressure test and small local leaking failures from low-pressure tests, are shown in .
Figure 4. Difference in failure behaviour between high-pressure test (burst like) and low-pressure test (slow leaking) for samples TB-262 (155,5 bar, above) and TB-252 (60 bar, below).
After testing, the failed samples were sectioned, and prepared transversal metallographic cross-sections were studied with respect to corrosion appearance and depth by optical and scanning electron microscopies.
The samples cross sections (see ) show corrosion ferrite layers depleted in Ni, Mn and Cr, and penetrated by Bi and Pb as is typical when dissolution corrosion takes place [Citation11] in LBE with low concentration of dissolved oxygen. It can also be seen in that the test samples show quite uniform corrosion. In some cases, a larger local differences in the corrosion depth are also observed, as it is shown in . In a structural integrity sense, especially for cases like the one shown in , the effective calculated corrosion rate (one value) is a better indicator of the impact of the corrosive exposure than the distributions acquired from the destructive post-test measurements.
Figure 5. Examples of cross sections of low-pressure HPCC test conducted under similar conditions but showing mixed corrosion behaviour.
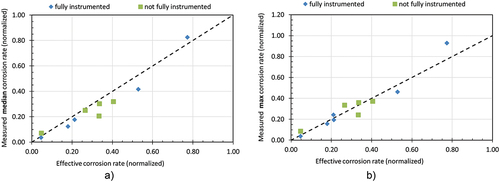
The measurement of the corrosion depth was conducted by optical microscopy on seven cross sections from each sample and regular measurements in 24 locations (every 15° over the full circumference of the sample). If the visually observed maximum corrosion depth was not situated in the automated measurement pattern, it was recorded and added as an additional data point. The median and maximum measured corrosion rates were extracted from the measured corrosion depth distributions of each sample. When the measured corrosion depth (median or max in μm) is divided by the corrosion exposure time ttot (in hours), the acquired corrosion rates can be compared to the calculated effective corrosion rates. The creep tests evaluated effective calculated corrosion rate were expected to lie above the measured median rates and close to the max rates.
The assessment results are given in , and the predicted versus measured corrosion rates are plotted in . The results show that the ‘effective’ HPCC determined rates are generally somewhat higher than established from the measured median corrosion depths, and close to the maximum ones. Note also that the effective and measured rate estimates for the not fully instrumented tests are situated closely to the 1:1 line.
Table 3. HP-CC ‘effective’ corrosion rate and prediction uncertainty in comparison measured median and max corrosion rates.
Figure 6. Predicted effective corrosion rate against measured corrosion rates, a) median rate and b) maximum rate, for fully instrumented and sighting tests (not fully instrumented).
Since creep strain (and damage) will be generated in the locations of stress concentrations, it is not surprising to find that the HPCC results also indicate this through the good correlation between effective corrosion rates and the measured maximum corrosion rates. However, it is essential to remember that the corrosion depths measured by microscopy close to the failure location might not necessarily be fully representative of the distribution of corrosion damage at the actual failure location, adding some uncertainty in the x-axis direction of . In this work, these uncertainties were not studied further, and the measured values from the nearby samples were considered to be representative for the failure locations. Also, as the deterministically calculated effective corrosion rates depend on the creep model prediction, uncertainties in creep failure time naturally impact the estimation of the effective corrosion rates. To get an idea of the effective corrosion rate prediction sensitivity, based on the creep model, calculations were conducted by applying a time factor (TF = 0.5 and TF = 2) on the time to failure in the master equation. A factor of 2 (in time) is an approximate scatter factor expected for a single heat assessment of creep rupture [Citation12]. The results are presented for the fully instrumented HPCC tests ( as the prediction range. It is to be noted that if the cladding has a reduced creep strength (TF = 0.5), the effective corrosion rate decreases, and if the cladding has a higher creep strength (TF = 2), the effective corrosion rate increases.
As can be seen above, only the test at very high pressure (TB-262, 156 MPa), with creep as the dominant damage mechanism, the rate of the predicted material loss is naturally impacted most by imposing the double or half creep failure time (in air). This high-pressure test has a further uncertainty due to the test itself since rather long periods of corrosion exposure (approximately 25% of the total exposure at temperature) were present before the pressure was applied and after burst. In this case, the estimated effective corrosion rate would be approximately 42% lower if the time to cladding failure in air at this temperature is halved. Reversely, the effective corrosion rate is increased by 27% if the creep life is doubled. For the other tests, in the range of 30–80 MPa, corrosion is the dominant failure mechanism and creep becomes relevant late in the test, i.e. when the cladding thickness has been severely reduced. As a consequence, the prediction of effective corrosion rates by this method has low uncertainties (~±2% in the tests) when the test parameters allow for larger corrosion depths and long exposure times.
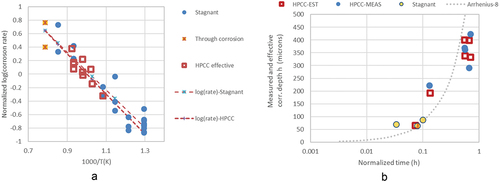
Using the measured maximum corrosion depth and the experimentally determined effective corrosion rates, a ‘general’ Arrhenius type corrosion model was defined, here, by simple linear fitting of logarithmic corrosion rate and the inverse test/exposure temperature. The predicted ‘effective corrosion rates are shown in together with rates calculated from post-test measurements and stagnant corrosion exposures (in dissolution conditions). Note that the data representing HPCC tests seemingly have lower scatter than for the stagnant tests, and they are located in a duration and temperature range less populated by stagnant tests. Note also that the here presented plot does not take into account the effect of the oxygen level that is a key parameter for acquiring a protective oxides reducing the corrosion rates in LBE.
Figure 7. a) Measured and predicted ‘effective’ corrosion rates as a function temperature for stagnant corrosion tests and HPCC results. The HPCC-EST are the estimated rates from the tests; ‘through corrosion’ points are stagnant tests where the full cladding thickness has locally been spent, thus adding uncertainty to the rate calculation. The ‘measured’ points are the measured corrosion depths divided by the exposure times at temperature and b) the Arrhenius model prediction of the 800°C test data with both stagnant and HPCC tests plotted.
Discussion
The new HPCC test facility and the here presented effective corrosion rate model enable estimation of the effectiveness of corrosion protection measures regarding the test material, e.g. different cladding surface treatments or changes in the corrosive media. They can also be used for studying the impact of oxygen level in LBE or comparing LBE corrosion to other coolants such as liquid lead.
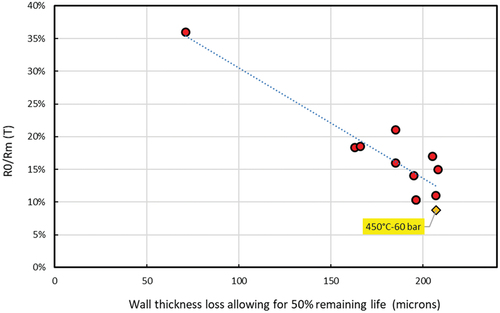
In , calculated ‘allowable’ corrosion depths in LBE are presented as extracted test by test. Here, the ‘allowable’ limit for material loss has been defined as material loss where 50% of the combined corrosion and creep life remains. A simulated case with an extreme extrapolation range towards a low temperature exposure of 450°C at 60 bar internal pressure is also presented.
Figure 8. Estimation of limit corrosion depths with 50% reaming life for combined corrosion and creep based on the HPCC tests (red circles). The highlighted data point (orange diamond) is a life fraction rule simulation using the general Arrhenius corrosion rate model at 450 °C/60 bar as a long term service condition assumption. The high-pressure test is the point with the lowest allowable material loss.
It is to be emphasised that the current methodology does not take into account the impact of oxygen levels in the LBE and the results are only applicable to dissolution conditions.
The test program is still being expanded with tests to find optimal test parameters for long-term tests and better extrapolation to relevant MYRRHA in-service temperatures. To further improve the estimates of effective corrosion rates, additional testing of claddings in air is to be conducted and the creep model updated. The main effort should be placed in testing at high pressures (stress) and at the limits of the current creep model temperature range, e.g. above 750°C and below 550°C. Some of these test conditions are expected to be performed during the PATRICIA project.
Conclusions
The well-characterised parent material creep and tensile strength properties for the 1515Ti cladding tube enable the estimation of effective corrosion rate through application of the life fraction rule, using actual test pressure, temperature and failure time data for the HPCC test. The main conclusions derived from the HPCC testing and corrosion rate assessment are as follows:
The creep rupture life of internally pressurised cladding tubes are shortened by the in situ LBE corrosion at the high imposed test temperatures enabling tests with ‘acceptable’ test durations.
The corrosion rates of claddings, corrosiveness of specific coolants or effectiveness of cladding protective measures can be estimated from HPCC test results applying the here presented methodology.
The highest uncertainties of the method are confronted at high pressures (and temperatures) with short creep failure times.
The methodology enables the determination of ‘allowable’ material loss levels for specific exposure conditions.
Acknowledgments
This project has received funding from the Euratom research and training programme 2019-2020 under grant agreement no. 945077.
Disclosure statement
No potential conflict of interest was reported by the author(s).
Additional information
Funding
References
- Bergmann HJ, Zusammenstellung von Bestrahlungskriechdaten der Werkstoffe 1.4970 KV; 1.4970 KV, A und 1.4981 KV (Materialdatenreferenzliste). Interatom - Belgonucléaire, Report Nr.: ITB 403.31113_4, 1983
- Hussein E. Emerging small modular nuclear power reactors: a critical review. Phy Open. 2020;5(100038):100038–100326. doi: 10.1016/j.physo.2020.100038
- Holmström S. Determination of high temperature material properties of 15-15Ti steel by small specimen techniques, EUR 28746 EN. Luxembourg: Publications Office of the European Union; 2017. ISBN 978-92-79-72278-3. doi:10.2760/259065.
- Partitioning and transmuter research initiative in a collaborative innovation action (PATRICIA), https://patricia-h2020.eu/
- Cautaerts N, Delville R, Dietz W, et al. Thermal creep properties of Ti-stabilized DIN 1.4970 (15-15Ti) austenitic stainless steel pressurized cladding tubes. J Nucl Mater. 2017;493:154–167. doi:10.1016/j.jnucmat.2017.06.013
- Delville R, Specifications DIN 1.4970 24% CW cladding tubes TASTE project, RESTRICTED CONTRACT REPORT SCK•CEN-R-5686, 2014.
- Freire LM. Evolutions microstructurales et comportement en fluage à haute température d’un acier inoxydable austénitique. PhD Thesis, Ecole doctorale n°432, Evolution microstructurales et comportement en fluage a haute temperature d’un acier inoxydable austenitique. de l’Université de recherche Paris Sciences et Lettres, PSL Research University; 2018.
- Holmström S, Delville R, Terentyev D, Thermal creep properties of virgin and irradiated cladding tubes made of Ti-stabilized DIN 1.4970 (15-15Ti) austenitic stainless steel6th International conference on Creep and Fracture, ECCC Conference, Edinburgh, UK, Submitted to the Special issue of Journal of Materials at High Temperature.
- Wilshire B, Scharning PJ, Hurst R. A new approach to creep data assessment. Materials Science And Engineering: A, Volumes 510–511. 2009;3–6. ISSN 0921-5093.doi: 10.1016/j.msea.2008.04.125.
- EN 13445-3:2014+A4. 2018, Unfired pressure vessels – design
- Tsisar V, Schroer C, Wedemeyer O, et al. Corrosion behavior of austenitic steels 1.4970, 316L and 1.4571 in flowing LBE at 450 and 550°C with 10−7mass% dissolved oxygen. J Nucl Mater. 2014;454(1–3):332–342. doi: 10.1016/j.jnucmat.2014.08.024
- Holdsworth, S.R., ed. ECCC Recommendations Volumes 5 Part 1a, ‘Generic recommendations and guidance for the assessment of full size creep rupture datasets’, Issue 6, Italy: publ. Centro Sviluppo Materiali; 2014.