Abstract
Lack of internal space is a problem in UK homes, and is often linked to a lack of space standards for housing in the UK. Although previous studies have examined new-build housing, this paper uses a new method to study 16 000 dwellings in the English Housing Survey (EHS) 2010 to examine existing housing and compare them with a modern space standard in an attempt to quantify the extent and magnitude of the problem. Dwellings in the survey were compared against a slightly modified version of the London Housing Design Guide 2010 internal space standard. It was found that between 21% and 55% of dwellings failed to meet the standard; and that flats and small terraced houses were most commonly below the standard. Dwellings were also frequently found to be under-occupied in comparison with the number of bedrooms. This research hypothesized that this was a result of the lack of space. To illustrate the use of this new analysis method, a recent change to the Housing Benefit system (colloquially known as the ‘Bedroom Tax’) has been considered. Households receiving Housing Benefit were more likely to be undersized, suggesting that the policy to withdraw housing benefits from these households may be misguided.
Introduction
Internal space within homes is an important and controversial issue in the UK (DCLG, Citation2013a). The UK has the smallest homes by floor area in Europe (Gallent, Madeddu, & Mace, Citation2010), as shown in . The reasons for this are complex, but are related to the removal of space standards in the 1980s, the high value of land, and the low number of homes built by public authorities and housing associations (Barker, Citation2004a). In the UK there is an imbalance between the distribution of the population, which is mostly one- and two-person households, and the distribution of homes, which are mostly three- or more bedroom houses (Nathaniel Lichfield & Partners, Citation2010; DCLG, Citation2012).
Table 1 Comparison of selected European dwelling sizes
The benefits of additional space are wide ranging. As well as simply allowing people to have a comfortable standard of living, additional space can also reduce stress by permitting segregation of different household activities, and ameliorate the feelings of claustrophobia experienced in small dwellings (Carmona, Gallent, & Sarka, Citation2010). Previous research has shown that between one-quarter and one-third of people are dissatisfied with the amount of space in their homes (Winston, Citation2013). The majority of homes in the UK are not fully occupied (Collinson, Citation2013; Nathaniel Lichfield & Partners, Citation2010), and yet residents are dissatisfied with the amount of space, with lack of storage space, insufficient space for furniture and lack of space in which to socialize often cited as a particular problems (CABE, Citation2009; Drury, Citation2009; Roberts-Hughes, Citation2011).
Lack of internal space is particularly relevant in the context of the UK's aims to retrofit the existing housing stock for greater energy efficiency (HM Government, Citation2013), and the UK's current housing shortage (Keddie & Tonkiss, Citation2010; Murie, Citation2012; Power, Citation2010; Reynolds, Citation2005). Internal space is relevant because some older (pre-1945) houses have more internal space than new-build houses (ONS, Citation2009). This may make them attractive for retrofitting, as when brought to modern standards they may be more attractive to residents than newer homes. An additional consideration is that very large homes may be able to be subdivided into flats to meet the changing demographics of the UK.
The benefits and harms of increased housing density is a highly researched area (Boyko & Cooper, Citation2011; Burton, Citation2000a; Churchman, Citation1999; Urban Land Institute, Citation2005). Increased density is often argued to reduce land use and travel distances, promoting more sustainable cities (Burton, Citation2000b). There are, however, concerns that increased density can result in overcrowding. Higher densities do not necessarily equate to smaller internal spaces if an appropriate typology of housing is used (Rogers, Brown, Burdett, Burton, & Cherry, Citation2005). It is therefore essential to identify space needs (Chan, Citation1999; Stokols, Carolina, & Hill, Citation1972) so that appropriate housing can be provided.
In the UK domestic property market, it is common to price and compare houses on the basis of the number of bedrooms rather than the floor space (Roberts-Hughes, Citation2011). For example, major UK property search websites such as Right Move and Zoopla do not list the floor space of the properties for sale. This is a result of the Office Fair Trading decision in 2009 (OFT, Citation2009). This results in a lack of understanding the space requirement by residents. The UK government recently consulted on some aspects of Building Standards including space standards (DCLG, Citation2014), in particular, whether space labelling and/or space standards should be introduced in the UK. The majority were in favour of space labelling (88%) and space standards (80%).
Although there is an emerging body of evidence that a lack of space is a problem in UK homes, there is not yet a quantitative measure of the scale or extent of the problem. This paper presents a new method to analyse the existing English housing stock against an internal space standard. It then uses this method to consider the effect of a recent change to the Housing Benefit system colloquially known as the ‘Bedroom Tax’. This example will show how the new method can both measure a pre-existing problem and be used to inform the debate about a new housing policy.
Background
Harm from insufficient internal space
The amount of space in a home influences how residents live. For example, how and where people prepare and eat food, what furniture and activities can accommodated, how much privacy people have, and whether necessary changes to the environment can be made if the residents circumstances change (Roberts-Hughes, Citation2011).
Beyond regular concerns a range of more serious problems are associated with having insufficient internal space in homes, although causal link are often unclear (HATC, Citation2006) or are difficult to detach from confounding factors. In extreme cases, overcrowded homes can cause physical illnesses such as asthma, and mental illnesses such as depression (Reynolds, Citation2005). The Building Research Establishment (BRE) estimated that overcrowding costs the National Health Service England (NHS) over £600 million per year (Davidson, Roys, Nicol, Ormandy, & Ambrose, Citation2010).
While overcrowding is the most extreme form of lack of space, less extreme cases can cause anxiety or stress, or impact on children's social and emotional development (Carmona et al., Citation2010; HATC, Citation2006; Reynolds, Citation2005). Lack of privacy resulting from lack of space can degrade family relationships, and prevent residents from entertaining guests and engaging in social activities in the home (Reynolds, Citation2005). People have a strong emotional reaction to spaces (Gallent et al., Citation2010), and people's perception of their homes can affect their quality of life.
Appropriate amount of internal floor space
To address the problems discussed above some countries have chosen to define a minimum gross internal area that a dwelling can have. The calculation of the appropriate amount of internal space for a dwelling is complex. Both objective perspectives, such as sufficient circulation space, and subjective perspectives, such as feelings of claustrophobia, need to be considered. While many standards consider the number of people in the household or number of bedrooms, other more complex needs are sometimes considered, such a disabled access (Lifetime Homes, Citation2010), number of floors (GLA, Citation2010), and separate bedrooms for children of different gender (Reynolds, Citation2005). It has been found that people's perception of internal space is only loosely correlated to the actual amount of internal space (Oseland & Donald, Citation1993; Oseland & Raw, Citation1991) and that perceptions and needs are dependent on age and gender (Gür, Citation2013). It is also likely that an acceptable amount of space is related to cultural norms, and changes over time. There is limited academic research on the appropriate size of housing. However, a study in Beijing found using a hedonic approach that the most popular house sizes were between 50–60 and 80–190 m2 (Gao & Asami, Citation2011). Gordon, Travers, and Whitehead (Citation2007) found that migrants to London had different space expectations, but over time came into line with the established population. It is not the intention of this paper to discuss the appropriateness of different standards, as it will focus only on the UK context. Many space standards, including Parker Morris (Morris, Citation1961), are based on detailed research into housing usage. How spaces within houses are defined can have a significant impact on assessment of internal space (Drury, Citation2009). For example, the distinction between a single and double bedroom, or a bedroom and a study, is not definitive. Therefore occupancy and occupant behaviour will be a factor in appropriateness of internal space. It must be acknowledged, however, that converting an understanding of how different people use their homes into a single number will never fully reflect the complex needs of real people. This paper does not consider the effects of ceiling heights, which also influence people's perception of and satisfaction with internal spaces (Stamps, Citation2010).
Internal space standards in the UK from a comparative perspective
Although there are many possible factors that could contribute to a shortage of space in UK housing, the current lack of regulation is often cited as a reason that larger homes are not built (Barker, Citation2004b; DCLG, Citation2014; Roberts-Hughes, Citation2011). In 1961, the Parker Morris Committee established an internal space and storage space standard that was compulsory for all council housing from 1969 until 1980 (HM Government, Citation1980). The UK currently has no statutory internal space standards, although in 2011 the Greater London Authority (GLA) adopted a standard described as Parker Morris +10% for all new-build houses in London (GLA, Citation2010), which will henceforth be referred to as the GLA standard. shows that the GLA standard is not an exact correlation for the Parker Morris and in many cases is more than 10% larger. Other organizations, such as the Homes and Communities Agency and Lifetime Homes, have also developed their own space standards (CABE, Citation2009; Lifetime Homes, Citation2010; HCA, Citation2014).
Table 2 Comparison of the Greater London Authority (GLA), Parker Morris space standards
While each standard is different, they all have similar values (CABE, Citation2010; Sheridan & Karn, Citation1994). shows some details of the GLA standard and the Parker Morris standard. Each standard uses a slightly different calculation method, e.g. the Parker Morris standard is based on building type rather than number of stories. In each case, the closest possible matching value has been used. The values for the Parker Morris standard have been converted into metric (metres) from the original imperial units (feet). Different countries and cities have adopted different standards. Some examples from the literature include Ireland and Italy, which have standards similar to those of London (CABE, Citation2010; Gallent et al., Citation2010; Roberts-Hughes, Citation2011), Japan and Germany, which have higher standards, while Hong Kong, Singapore and Taiwan have no standards (Chan, So, Tang, & Wong, Citation2008; Liu, Wu, & Lee, Citation1999; Roberts-Hughes, Citation2011).
The GLA standard is slightly more generous than the Parker Morris standard, but other organizations in the UK have set similar or higher standards (CABE, Citation2010). The GLA standard was chosen for the following reasons:
as a UK standard it should reflect UK cultural attitudes to space
the standard was recently developed and reflects modern space needs
the standard has similar values to other standards in use in the UK
the standard is based on variables that can be found in the English Housing Survey (EHS)
Method of assessing the existing housing stock
To assess the suitability of internal space in current English homes, housing data from the English Housing Survey (EHS) 2010 were used, which is a continuous national survey performed by the Department for Communities and Local Government (DCLG) and the Office for National Statistics (ONS) (DCLG, Citation2013b). Headline reports and summary statistics are published by the DCLG each year, while the full anonymised dataset is published by the UK Data Service. The survey contains detailed information from a survey of 16 047 houses from across England (DCLG, Citation2012). It was compared against the internal space standards in the London Housing Design Guide (GLA, Citation2010), which is referred to in this paper as the GLA standard.
The GLA provides a reference table of the gross internal area (GIA), which is suitable for designing a house. However, this is cumbersome to use when assessing the large number of houses in the EHS. This is because the GLA standard is not based on a specific equation. To address the problem an equation was sought by this research that matched the GLA standard as closely as possible. Using the equation instead of the reference table has two advantages. Firstly, it can be rapidly calculated for thousands of houses in the EHS. Secondly, it can be calculated for combinations of stories, bedrooms and people not specifically listed in the GLA standard with a value which is ‘in the spirit’ of the GLA standard. This is essential for an assessment of existing homes, as only a minority (19%) of houses in the EHS exactly match the example configurations given in the GLA standard. The disadvantage of this method is that the formula is disconnected from real buildings and cannot take consideration of extenuating factors such as good design.
The GLA standard is based on three variables, as shown in : the number of stories in the house (N Stories), the number of bedrooms (N Bedrooms) and the number of people (N People). To find values which best matched the GLA standard Equation (1) was produced using a least square method. This method compares the difference between the GLA standard and Equation (1) for each house configuration. The differences between the areas calculated by Equation (1) and stated in the GLA standard for each house configuration are added together produce an overall measure of quality of fit, where zero indicates a perfect fit. A numerical solver was used to minimize this value by iteration, resulting in the coefficients shown below. The calculated values and the difference from the GLA standard are listed in .
Table 3 Greater London Authority (GLA) internal space standard and equations approximating to the standard
Equation (1) = the GLA internal space standard (±2.5 m2) (Morgan & Cruickshank, Citation2013):The average difference between the true space standard and the equation is 2.2% with a maximum difference of 3.7% for a specific house configuration. This equates to a maximum difference of 2.5 m2. This suggests that Equation (1) is a good approximation of the GLA standard. Using this calculation method 14.3% of houses in the EHS failed to meet the GLA standard. This means that the houses have less internal space than is considered acceptable for the number of residents and the configuration of the dwelling. Equation (1) does not distinguish between over-occupation and undersized rooms.
Equation (1), while being a good match for the GLA standard, produces some unusual results with less typical houses. Each additional bedroom only increases the GIA by 4 m2, which is too small for a bedroom. This means that in houses with a large number of bedrooms but few people, the calculated standard is much lower than would be expected. For example, a five-bedroom house with only two people is calculated as requiring 74 m2, yet the average five-bedroom house in the EHS is 206 m2. Furthermore, the GLA standard suggests that four-bedroom houses should be between 100 and 113 m2.
This discrepancy occurs because the GLA standard assumes a high occupancy rate of between 1.3 and 2.0 people per bedroom, with an average of 1.6 people per bedroom. This is a reasonable assumption in a minimum standard, but highlights an important distinction between when the house is too small/large or is under/over-occupied. The former is a permanent deficiency of the building, while the latter is a transient characteristic of the current occupiers.
In the EHS almost all (98.7%) houses have fewer than two people per bedroom, with only 1.3% of houses overcrowded (more than two people per bedroom). A significant majority (77.2%) have one person or less per bedroom, suggesting that they may be under-occupied. Houses with more than two people per bedroom made up 8% of below-standard homes, but less than 1% of above-standard homes. Under-occupation is related to tenure type with 72% of under-occupied homes in the EHS privately owned.
As the GLA standard is in part based on the number of residents, a change in occupancy results in a change in the assessment of the suitability of the internal space. This makes it difficult to distinguish between houses that are intrinsically too small and those that are over-occupied. To distinguish between these two causes of a lack of space, a new equation was developed, assuming occupancy ratios of 1.6 people per bedroom.
Equation (2) = modified GLA standard:Equation (2) is a modified version of Equation (1) and was developed using the same method. As Equation (2) is not dependent on the number of people, the coefficients were recalculated to match the GLA standard more closely. Equation (2) does not match the GLA standard as well as Equation (1), with an average difference of 5.4 m2 and a maximum difference of 12.4 m2. This is because for each number of bedrooms there are multiple internal space values in the GLA standard. Using Equation (2), the example five-bedroom house discussed above has a minimum internal space of 125 m2. This is significantly higher than that calculated for Equation (1), but still below the national average for a five-bedroom house.
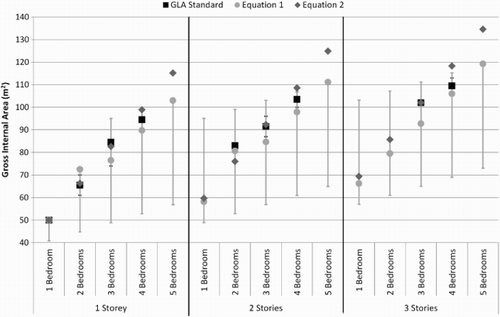
shows that the configurations used in the GLA standard are uncommon in the English housing stock. All the different combinations only account for 19% of houses in the EHS. The most common combinations in the EHS were one-storey, one-bedroom, one-person homes (23%); one-storey, two-bedroom, one- or two-person households (15%), and two-storey, three-bedroom, one- to three-people households(19%). shows for different combinations of stories and bedrooms, the amount of GIA specified by the GLA standard, Equation (1) and Equation (2). For the GLA standard and Equation (1), error bars show the variation in space depending on the number of people; Equation (2) has no error bars as it is person independent. It is clear from that as the number of bedrooms increases Equation (1) deviates from the GLA standard, and that the differences between the number of people has more of an effect on Equation (1) than the differences in house configuration. As the number of people and the number of bedrooms are correlated in the GLA standard, and the actual occupation rates of the housing stock do not reflect the GLA standard, this paper uses Equation (2) for most of the assessment, but also highlights notable differences when using Equation (1).
The EHS is composed of multiple tables covering different aspects of the dwelling. Records in different tables can be connected by a common ID code for each house in the survey. summaries the tables and variables used to calculate the space standard and classify the dwellings in this paper.
Table 4 Variables of the English Housing Survey (EHS) 2010 used in this research
To measure the internal floor space, the area of any garages and balconies was removed from the total floor space. The EHS does not directly state how many stories are in each dwelling, but does state the number of stories in the building. Therefore, the number of stories in the dwelling was assumed to equal that of the building unless the dwellings were flats, which, in the absence of other evidence, were assumed always to be one storey.
Analysis and results
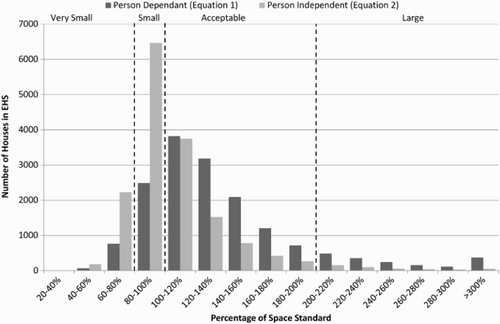
shows the distribution of dwellings in relation to the GLA internal space standard, using the two different equations, where 100% indicates a dwelling meeting the standard. Descriptive titles of very small, small, acceptable, and large have been added to describe dwellings that are < 80%, 80–100%, 100–200% and > 200% respectively of the calculated standard. These boundaries were chosen to highlight the high proportion of dwellings that are just below the standard.
Using Equation (1) the median value is 125% of the standard and 20.7% of dwellings fail to meet the GLA standard, while the majority of dwellings are slightly above the standard. Of the dwellings below the standard, the majority are between 80% and 100% of the standard, with only 5.2% of dwellings below 80% of the standard. A total of 10.7% of dwellings have more than twice the space specified by the GLA standard.
Using Equation (2), 55.4% of dwellings are below the standard. The median value is 106% and only 2.7% of houses have more than twice the standard. The significant difference in the distribution of dwellings between the Equation (1) and Equation (2) cannot be explained by the small differences in the calculation method. Instead, it suggests that occupancy rates are a significant factor in English housing. Dwellings with low occupancy rates, which have a disproportionally low standard when using Equation (1), are being reclassified to a lower category under Equation (2). This reclassification of dwellings, with low occupancy rates, under Equation (2) is intended to identify the physical differences in the dwellings rather than just the differences in current occupation.
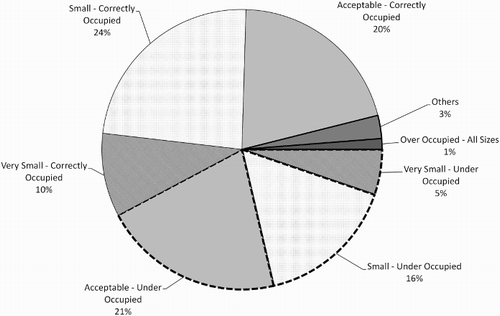
shows the dwellings in the EHS divided into eight categories based on their occupancy rate and internal space standard calculated by Equation (2). Dwellings were categorized based on their occupation rate (people per bedroom) as under-occupied (< 1 ppb), correctly occupied (1–2 ppb), or over-occupied (> 2 ppb). Dwellings were categorized based on their size relative to the Equation (2) standard as very small, small, acceptable, or large.
A total of 21% of dwellings are under-occupied and small or very small, which suggests that residents may be compensating for a lack of space by under-occupying the house, e.g. using a spare bedroom as a study or storage space.
A total of 34% of households are small or very small, but have a ‘correct’ occupancy rate. These occupants are likely to be dissatisfied with the amount of space in their homes and this proportion agrees with previous research that found one-third of households were dissatisfied with the amount of space in their home (Winston, Citation2013). The similarity of these two figures suggests that Equation (2) may be reflecting resident's perceptions. A small number of over-occupied dwellings of all sizes exist; these dwellings are likely to have a serious shortage of space with as many as five people per bedroom. While the low proportion suggests that overcrowding is not a widespread problem, in England for those involved the consequences are profound (Reynolds, Citation2005). A total of 41% of households are classified as acceptably sized (between 100% and 200% of the standard), of which half are under-occupied. Acceptably sized, under-occupied dwellings are mostly (80%) single persons or couples with no children in their households. This may be due to a shortage of one- and two-bedroom dwellings in England (National Housing Federation, Citation2013). These households may have chosen to live in a home with extra bedrooms either because of future aspirations (e.g. a young couple starting a family) or previous family commitments (e.g. an older couple whose children have recently moved out) or because they can afford to have the extra space (CABE, Citation2009). The EHS does not contain sufficient data to identify bedrooms that are unoccupied, but have a use, and so are not considered ‘spare bedrooms’ by the residents. The EHS includes ‘all rooms intended to be used as a bedroom even if they are currently not being used as a bedroom’ but excludes ‘living rooms or dining rooms currently being used for sleeping’.
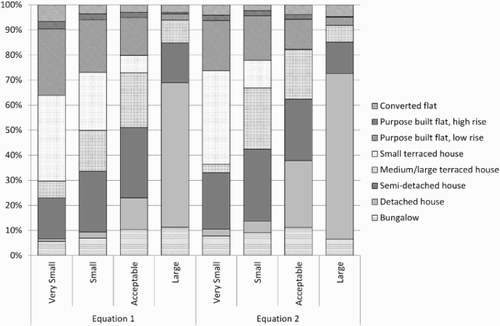
The EHS allows an examination of the kinds of houses, which meet or fail to meet the standard. shows the eight house types as classified in the EHS. The distribution of houses is shown using Equation (1) on the left and by Equation (2) on the right. Using both methods, flats are over-represented in substandard house categories. Flats make up 21% of the dwellings in the EHS but between 23% and 29% of substandard dwellings. All the aptly named small terraced houses were substandard using Equation (2), but only 53% were substandard using Equation (1), suggesting occupancy is most significant in small terraced houses. Detached homes are most likely to be above the standard with 85–95% of them above the standard, depending on the equation used. While the general trend is the same for both equations, slight differences in the distribution occur. It is worth noting that the very small and large categories have significantly fewer dwellings, and the confidence in the exact distributions should be accordingly lower.
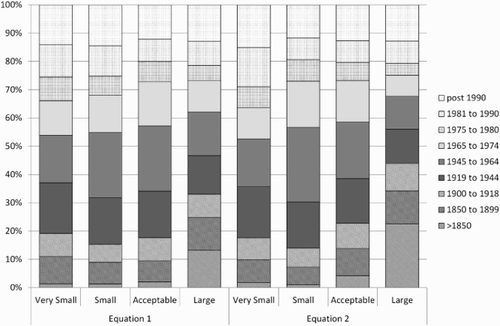
The EHS shows fewer significant relationships between the age of the buildings and the compliance with the space standard (). New dwellings are slightly more likely to be below the standard, while older dwellings are more likely to be above the standard. Housing built between 1919 and 1974 is most likely to be below standard. The GLA standard is slightly higher than the Parker Morris standard, and 47% of dwellings built between 1945 and 1974 are only just below the GLA standard, suggesting that they were compliant with the standards of the time; 41% of 1945–74 dwellings are above the standard. Pre-1900 dwellings are more likely to be well above the standard. This may reflect that much of the poor Victorian housing was demolished in the slum clearances of the 1960s (Yelling, Citation2013), leaving only the larger dwellings.
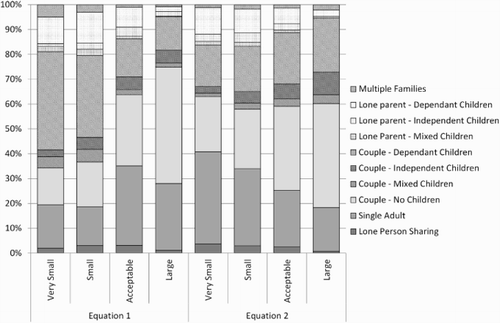
When comparing dwellings by household composition, Equations (1) and (2) show different trends due to the effect of occupation (). Households with a low occupation are evenly distributed under Equation (2) but tend to be in substandard housing in Equation (1). This is because one- and two-person houses are usually under-occupied (except for single-bedroom properties), and so Equation (1) produces a distorted assessment. Equation (2) correctly highlights that single people are more likely to live in small dwellings; this may be due to the limitations of what a single person can afford. Conversely, couples without children, or children who have moved out, are more likely to have larger homes in the EHS.
Households with children tend to have higher occupation rates, and therefore are more commonly substandard in Equation (1), but more evenly distributed using Equation (2) as it is not distorted by occupation rate. Lone-parent households are most likely to be in substandard homes, reflecting the combined problems of reduced earnings and increased costs of being a lone parent (Lewis, Citation2009).
Consequences of a lack of understanding of internal space – the ‘Bedroom Tax’
As part of the Welfare Reform Act 2012, from April 2013 the UK government changed the rules for those receiving Housing Benefit (HMSO, Citation2012). Housing Benefit is paid to people on low incomes. In the UK the benefit can contribute all or part of the rent of a socially of privately rented property. The new rule suggests that if a claimant has a spare bedroom, their benefit would be cut by 14%, and by 25% for two or more spare bedrooms (HMSO, Citation2012). This change has been colloquially referred to as the ‘Bedroom Tax’ and has been widely criticized (BBC, Citation2013; Hull Daily Mail, Citation2013; Peterkin, Citation2013; STV News, Citation2013; Toynbee, Citation2013). Certain groups such as the elderly and disabled are exempt from these rules, but in general one bedroom is permitted for (ISOS, Citation2013; Shelter, Citation2013):
each couple
each person aged over 16
two children aged under 10
two children aged 10–16 of the same sex
an overnight carer.
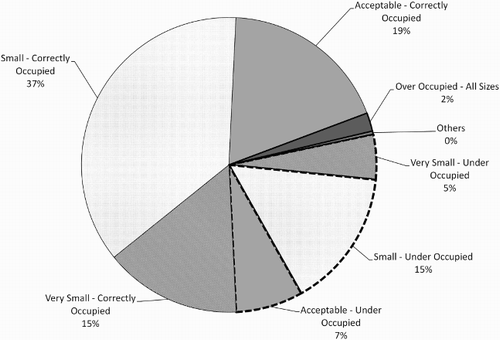
was produced using the same method as , but is limited to the 3746 dwellings in the EHS receiving Housing Benefit. shows that there is a significant difference in the distribution of space among those receiving Housing Benefit and the general population. Under-occupation is significantly less common in households receiving Housing Benefit, and only 7% of households are both under-occupied and acceptably sized.
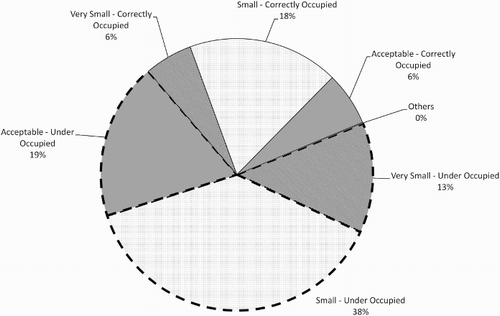
shows only the households that would be considered to have a spare bedroom under the new Housing Benefit rules. Households with a disabled person or a person aged over 65 have been excluded. In the EHS, 613 of the 3746 (16%) households receiving Housing Benefit have at least one ‘spare bedroom’. Nationwide 19% working age socially renting households in receipt of Housing Benefit are expected to be affected (National Housing Federation, Citation2014).
Three-quarters of the households that would lose some of their benefit due to having a ‘spare bedroom’ are small or very small. The majority of households losing some Housing Benefit (70%) are under-occupied. However, the majority of under-occupied dwellings are small or very small, which suggests that in many cases the ‘spare bedroom’ may be making up for a general lack of space in the house. If this is the case, increasing the occupancy of the house may result in some of the problems described above. Even among correctly occupied households, the majority of dwellings are small or very small. Dwellings classified as correctly occupied can also be subject to the ‘Bedroom Tax’, e.g. a two-bedroom house with a couple has an occupancy rate of one person per bedroom, but has a ‘spare bedroom’ under the government's definition. Due to the rules of the Bedroom Tax, over-occupied households are not affected by the changes. Indeed, 297 (8%) houses receiving Housing Benefit in the EHS had fewer bedrooms than the ‘Bedroom Tax’ rules would allow. The Housing Benefit rules make no provision for these households to receive additional benefits.
shows that only 19% (acceptable space – under-occupied) of households losing some of their Housing Benefit could be considered to have more space than they need. The ‘Bedroom Tax’ may cause the most harm to the 24% of households loosing benefits that are correctly occupied, by the GLA standard, but are undersized, and so could be considered over-occupied in practice. As well as targeting households with insufficient space, the ‘Bedroom Tax’ fails to capture the small number of large properties receiving Housing Benefit, usually because they are occupied by elderly people who are exempted from the ‘Bedroom Tax’.
Conclusions
Previous literature has identified the harm of insufficient space and overcrowding in homes. There has also been evidence that dwellings in England are significantly smaller than dwellings in Continental Europe. This paper has used the established London Housing Design Guide and data from the EHS 2010 to assess existing housing and found that between 21% and 55% of housing does not meet the space standard, depending on the calculation method used.
The range in estimation comes from whether the current occupants of the dwelling are considered. Excluding the current occupants allows an assessment of the building, whereas including the occupants allows an assessment of overcrowding or under-occupation. Therefore, the findings of this paper could be summarized as 55% of houses in England are too small, but due to low occupation rates (people per bedroom) only 21% of households have a shortage of internal space.
This high proportion of small houses is mediated by low occupation rates, suggesting that the proportion of households that have a problem concerning lack of space is closer to 34%, which correlates to previous findings regarding people's satisfaction with the space in their homes. Overcrowded dwellings were found to be rare (approximately 1% of households), but their occupants are likely to suffer from the lack of space most acutely.
The results discussed above are sensitive to how the minimum standard is defined. The standard used in this paper is not empirically derived, and a range of alternative space standards from other European countries could have been used. The choice of the London Housing Design Guide was made as it was felt that is would reflect the UK context. If a slightly lower standard had been used, the overall proportion of substandard housing would be significantly lower, e.g. 40% of housing was less than 20% below the standard. Nevertheless, the vast majority (79%) of English homes are near or below the minimum acceptable size, as defined by the London Housing Design Guide.
Building type was found to be a significant determinant of size, with flats and small terraced houses being most commonly undersized, while households with children were most likely to be overcrowded. Detached houses are the least likely to be below the standard.
Households receiving Housing Benefit, and in particular those who have lost part of their benefit due to having a ‘spare bedroom’, were selected for additional analysis. Under-occupation was found to be less common in dwellings receiving Housing Benefit, and that 72% of these dwellings were undersized (with an area less than the GLA standard). Of the dwellings receiving Housing Benefit that were under-occupied (less than one person per bedroom), 89% were undersized. Of the households losing some of their Housing Benefit, 75% were undersized, and only 19% of households loosing Housing Benefit could be considered to have more space than they need.
This casts doubt over the current UK governments policy to reduce Housing Benefit for households with a spare bedroom, as the calculation method used by the government makes no consideration of the internal space. This research suggest that there is a possibility of this policy causing physical or mental harm to a significant number of households receiving Housing Benefit. Many of the households affected by the changes in the benefit system will be unable to move, due to a shortage of available homes, and that local authorities are not obliged to rehouse their tenants if they are affected by the ‘Bedroom Tax’ (National Housing Federation, Citation2013).
There is little evidence that there is any significant number of Housing Benefit claimants living in oversized homes. Even if the homes have a spare bedroom, they are likely to lack the necessary floor space to accommodate more inhabitants. If the UK government does wish to identify oversized homes, the relationship between the number of inhabitants and the number of bedrooms has been shown to be a poor metric to use.
Recommendations
The following recommendations are made for policy-makers:
Require the internal area of homes to be clearly stated by estate agents when renting or buying a home.
All local governments to set minimum space standards in the way the GLA has done, reflecting the conclusions of the Housing Standards Review.
Consider the floor area per person rather than the number of bedrooms when assessing whether a benefit claimant has a larger home than they require.
Identify the small number of cases where people are living with a chronic lack of space due either to overcrowding or to small homes and rehouse these people.
Support work to identify the costs of poor housing incurred by the NHS and to wider civil society.
This paper set out to quantify the scale and extent of the shortage of space in English housing. It has shown that the vast majority of homes are at or below acceptable space standards. This physical shortcoming has been mitigated by residents having low occupation rates, which are necessary and should not be regarded as a wasteful use of space. Nevertheless one-fifth of households still lack a suitable amount of space within their homes.
Acknowledgements
The authors would like to thank Dr Iveta Todorova-Pirgova and Dr Petar Pirgova for their assistance with this paper.
Funding
This research was conducted as part of a doctoral thesis funded by a DTA – Doctoral Training Account awarded to Malcolm Morgan [number RG 59268] from the Engineering and Physical Sciences Research Council (EPSRC).
References
- Barker, K. (2004a). Review of review housing supply. London: HMSO. Retrieved from http://webarchive.nationalarchives.gov.uk/+/http://www.hm-treasury.gov.uk/consultations_and_legislation/barker/consult_barker_index.cfm
- Barker, K. (2004b). Barker review of housing supply (pp. 11–159). London: HMSO. Retrieved from http://www.andywightman.com/docs/barker_housing_final.pdf
- BBC. (2013). Conservatives protest to UN over “Bedroom Tax” report. BBC News. Retrieved September 11, 2013, from http://www.bbc.co.uk/news/uk-politics-24046094
- Boyko, C. T., & Cooper, R. (2011). Clarifying and re-conceptualising density. Progress in Planning, 76(1), 1–61. doi:10.1016/j.progress.2011.07.001.
- Burton, E. (2000a). The compact city: Just or just compact? a preliminary analysis. Urban Studies, 37(11), 1969–2006. doi:10.1080/00420980050162184.
- Burton, E. (2000b). The potential of the compact city for promoting social equity. In K. Williams, E. Burton, & M. Jenks (Eds.), Achieving sustainable urban form ( First., pp. 19–30). London: E & FN Spon.
- CABE. (2009). Space in new homes: What residents think introduction. Policy (p. 10). London. Retrieved from http://webarchive.nationalarchives.gov.uk/20110118095356/http:/www.cabe.org.uk/files/space-in-new-homes.pdf
- CABE. (2010). Mapping space standards for the home – Graph of Gross Internal Area – GIA (m 2) Date: August 2010. English (p. 1). London. Retrieved from http://webarchive.nationalarchives.gov.uk/20110118095356/http://www.cabe.org.uk/files/mapping-space-standards-for-the-home.pdf
- Carmona, M., Gallent, N., & Sarka, R. (2010). Space standards: the benefits. London: HMSO. Retrieved from http://webarchive.nationalarchives.gov.uk/20110118095356/http:/www.cabe.org.uk/files/space-standards-the-benefits.pdf
- Chan. (1999). Density, crowding, and factors intervening in their relationship: Evidence from a hyper- dense metropolis. Social Indicators Research, 48(1), 103–124.
- Chan, E., So, H., Tang, B., & Wong, W. (2008). Private space, shared space and private housing prices in Hong Kong: An exploratory study. Habitat International, 32(3), 336–348. doi:10.1016/j.habitatint.2007.11.004.
- Churchman, A. (1999). Disentangling the concept of density. Journal of Planning Literature, 13(4), 389–411. doi:10.1177/08854129922092478.
- Collinson, P. (2013, April 18). Half of privately owned homes are “under-occupied.” The Guardian. London. Retrieved from http://www.theguardian.com/money/2013/apr/18/half-privately-owned-homes-under-occupied
- Davidson, M., Roys, M., Nicol, S., Ormandy, D., & Ambrose, P. (2010). The real cost of poor housing (First.). BRE. Retrieved from http://www.brebookshop.com/details.jsp?id=325401
- DCLG. (2012). English Housing Survey HOMES 2010 (p. 150). London. Retrieved from https://www.gov.uk/government/uploads/system/uploads/attachment_data/file/6748/2173483.pdf
- DCLG. (2013a). English housing survey. London: HMSO. Retrieved September 06, 2013, from https://www.gov.uk/government/organisations/department-for-communities-and-local-government/series/english-housing-survey
- DCLG. (2013b). Housing standards review (p. 88). London. Retrieved from https://www.gov.uk/government/uploads/system/uploads/attachment_data/file/230250/1-_Housing_Standards_Review_-_Consultation_Document.pdf
- DCLG. (2014). Housing standards review summary of responses (p. 109). London: HMSO. Retrieved from https://www.gov.uk/government/uploads/system/uploads/attachment_data/file/289144/140225_final_hsr_summary_of_responses.pdf
- Drury, A. (2009). Resident satisfaction with space in the home (p. 28). London: HMSO. Retrieved from http://webarchive.nationalarchives.gov.uk/20110118095356/http:/www.cabe.org.uk/files/space-in-new-homes-residents.pdf
- Drury, A. (2012). London housing standards 2009/10. London: GLA. Retrieved From http://www.hatc.co.uk/wp-content/uploads/London-Housing-Standards-2009-report-2012.pdf
- DWP. (2012). Housing Benefit: Under occupation of social housing (pp. 1–21). London: HMSO. Retrieved from https://www.gov.uk/government/uploads/system/uploads/attachment_data/file/214329/social-sector-housing-under-occupation-wr2011-ia.pdf
- Evans, A. W., & Hartwich, O. M. (2005). Unaffordable housing: Fables and myths (First., p. 41). London: Policy Exchange.
- Gallent, N. (2013). Re-connecting “people and planning”: Parish plans and the English localism agenda. Town Planning Review, 84(3), 371–396. doi:10.3828/tpr.2013.20.
- Gallent, N., Madeddu, M., & Mace, A. (2010). Internal housing space standards in Italy and England. Progress in Planning, 74(1), 1–52. doi:10.1016/j.progress.2010.04.001.
- Gao, X., & Asami, Y. (2011). Preferential size of housing in Beijing. Habitat International, 35(2), 206–213. doi:10.1016/j.habitatint.2010.09.002.
- GLA. (2010). London housing design guide. Retrieved from http://www.london.gov.uk/who-runs-london/mayor/publications/housing/london-housing-design-guide
- Gordon, I., Travers, T., & Whitehead, C. (2007). The impact of recent immigration on the London economy. London: City of London Corporation. Retrieved from https://www.cityoflondon.gov.uk/business/economic-research-and-information/research-publications/Documents/2007-2000/TheImpactofRecentImmigrationontheLondonEconomy.pdf
- Gür, Ş. Ö. (2013). How children describe their houses: Present vs. ideal. Child Indicators Research (Vol. 6, pp. 493–525). doi:10.1007/s12187–013-9179-5.
- HATC. (2006). Housing space standards (pp. 1–188). London: Greater London Authority. Retrieved from http://www.london.gov.uk/sites/default/files/archives/uploads-space-standards.pdf
- HCA. (2014). Level 1 space standard. London. Retrieved from http://www.homesandcommunities.co.uk/sites/default/files/our-work/level_1_space_standard_hca_addendum.pdf
- HM Government. (2013). Helping households to cut their energy bills. Retrieved October 30, 2013, from https://www.gov.uk/government/policies/helping-households-to-cut-their-energy-bills
- HM Government. (1980). Local government, planning and land act 1980. London: Statute Law Database. Retrieved from http://www.legislation.gov.uk/ukpga/1980/65/contents
- HMSO. Welfare Reform Act 2012 c.5. (2012). London. Retrieved from http://www.legislation.gov.uk/ukpga/2012/5/contents
- Hull Daily Mail. (2013, February). Bedroom tax: Ed Miliband attacks David Cameron over Hull's 5,000. Hull Daily Mail. Hull. Retrieved from http://www.hulldailymail.co.uk/Bedroom-tax-Ed-Miliband-attacks-David-Cameron/story-18100035-detail/story.html#axzz2LHKLKw5W
- ISOS. (2013). Under Occupation Information and Under Occupation Calculator. Retrieved October 30, 2013, from http://www.isoshousing.co.uk/welfare/underoc.htm
- Keddie, J., & Tonkiss, F. (2010). The market and the plan: Housing, urban renewal and socio-economic change in London. City, Culture and Society, 1(2), 57–67. doi:10.1016/j.ccs.2010.08.004.
- Lewis, J. (2009). Lone parent families: Politics and economics. Journal of Social Policy, 18(04), 595–600. doi:10.1017/S0047279400001872.
- Lifetime Homes. (2010). Lifttime homes standard. Retrieved September 05, 2013, from http://www.lifetimehomes.org.uk/pages/7-circulation-space.html
- Liu, E., Wu, J., & Lee, J. (1999). Housing standards of private dwellings (p. 63). Hong Kong: Legislative Council Secretariat. Retrieved from http://www.legco.gov.hk/yr98-99/english/sec/library/989rp10.pdf
- Morgan, M., & Cruickshank, H. (2013). Assessing the sustainability of housing in English towns. Proceedings of the People and Planet Conference.
- Morris, P. (1961). Homes for today & tomorrow (Third., p. 92). London: Ministry of Housing and Local Government.
- Murie, A. (2012). The next blueprint for housing policy in England. Housing Studies, 27(7), 1031–1047. doi:10.1080/02673037.2012.723405.
- Nathaniel Lichfield & Partners. (2010). The relationship between household size and dwelling size in future housing provision (p. 100). London.
- National Housing Federation. (2013). The Bedroom Tax in Merseyside (pp. 1–12). Merseyside: National Housing Federation. Retrieved from http://www.housing.org.uk/publications/browse/the-bedroom-tax-in-merseyside
- National Housing Federation. (2014). Impact of welfare reforms on housing associations. Merseyside: National Housing Federation. Retrieved from http://www.housing.org.uk/publications/browse/impact-of-welfare-reforms-on-housing-associations/p8
- OFT. (2009). Home buying and selling. Retrieved from http://webarchive.nationalarchives.gov.uk/20140402142426/http:/www.oft.gov.uk/OFTwork/markets-work/buyingandselling
- ONS. (2009). English housing survey housing stock summary statistics tables, 2009. Newport: Office for National Statistics. Retrieved from www.gov.uk/government/uploads/system/uploads/attachment_data/file/6734/1937429.xls
- Oseland, & Donald. (1993). The evaluation of space in homes: A facet study. Journal of Environmental Psychology, 13(3), 251–261. doi:10.1016/S0272-4944(05)80177-X.
- Oseland, N. A., & Raw, G. J. (1991). Room size and adequacy of space in small homes. Building and Environment, 26(4), 341–347. doi:10.1016/0360-1323(91)90060-O.
- Peterkin, T. (2013, March 31). Bedroom tax: Thousands protest across Scotland. The Scotsman. Edinburgh. Retrieved from http://www.scotsman.com/news/bedroom-tax-thousands-protest-across-scotland-1-2868663
- Power, A. (2010). Housing and sustainability: Demolition or refurbishment? Proceedings of the ICE – Urban Design and Planning, 163(4), 205–216. doi:10.1680/udap.2010.163.4.205.
- Reynolds, L. (2005). Full house: How overcrowded housing affects families (p. 52). Retrieved from http://england.shelter.org.uk/professional_resources/policy_and_practice/policy_library/policy_library_folder/full_house_how_overcrowded_housing_affects_families
- Roberts-Hughes, R. (2011). The case for space: The size of England's new homes. London. Retrieved from http://www.architecture.com/Files/RIBAHoldings/PolicyAndInternationalRelations/HomeWise/CaseforSpace.pdf
- Rogers, R., Brown, C., Burdett, R., Burton, T., & Cherry, A. (2005). Towards a strong urban renaissance the urban renaissance six years on. London: Urban Task Force. Retrieved from www.urbantaskforce.org
- Sheridan, L., & Karn, V. (1994). New homes in the 1990s A study of design, amenity in housing association and private sector production. York: Joseph Rowntree Foundation.
- Shelter. (2013). Bedroom tax from April 2013. Retrieved September 11, 2013, from http://england.shelter.org.uk/get_advice/housing_benefit_and_local_housing_allowance/changes_to_local_housing_allowance/bedroom_tax_from_april_2013
- Stamps, A. E. (2010). Effects of area, height, elongation, and color on perceived spaciousness. Environment and Behavior, 43(2), 252–273. doi:10.1177/0013916509354696.
- Stokols, D., Carolina, N., & Hill, C. (1972). On the distinction between density and crowding: Some implications for future research. Psychological Review, 79(3), 275–277.
- STV News. (2013). Fears over housing shortage as “Bedroom Tax” comes into force. Retrieved October 30, 2013, from http://news.stv.tv/politics/219714-fears-over-housing-shortage-as-bedroom-tax-comes-into-force/
- Toynbee, P. (2013, February). How to turn a housing crisis into a homeless catastrophe. The Guardian. London. Retrieved from http://www.theguardian.com/commentisfree/2013/feb/18/housing-crisis-bedroom-tax-failure-to-build
- Urban Land Institute. (2005). Higher-density development: Myth and Fact. Sierra. Washington, DC: Urban Land Institute. Retrieved from http://www.nmhc.org/files/ContentFiles/Brochures/MythandFactFINAL.pdf
- Winston, N. (2013). Sustainable communities? A comparative perspective on urban housing in the European Union. European Planning Studies, (August), 1–23. doi:10.1080/09654313.2013.788612.
- Yelling, J. (2013). The incidence of slum clearance in England and Wales, 1955–85. Urban History, 27(02), 234–254. Retrieved from http://journals.cambridge.org/download.php?file=%2F13800_1C35E3F66F1466C1B891928CB7CDEC99_journals__UHY_UHY27_02_S0963926800000249a.pdf&cover=Y&code=c2df7f291640804e79829c68c457666d

