
Abstract
Current practices show that the goals of energy saving and CO2 reductions for creating an energy-neutral building stock can only be reached by strict and supportive governmental policies. In Europe the Energy Performance of Buildings Directive (EPBD) and the Energy Efficiency Directive (EED) are driving forces for member states to develop and strengthen energy performance regulations both for new buildings (via building approval procedures) and the existing building stock (via energy performance certificates or labels). The effectiveness of these current governance instruments and their impact on actual CO2 reductions are found to be inadequate for ensuring actual (not hypothecated) energy performance is achieved. To realize the very ambitious energy-saving goals a radical rethink of regulatory systems and instruments is necessary. Building performance and the behaviour of the occupants is not well understood by policy-makers. Alternative forms of governance are needed that have more impact on the actual outcomes. Supportive governance to stimulate near-zero renovations in combination with performance guarantees is a promising approach. Furthermore, engagement with occupant practices and behaviours is needed. To ensure accurate outcomes-based governance, a better understanding of building performance and behaviours of occupants must be incorporated.
Introduction
Climate change mitigation is the most important driver for the ambitions to reduce the use of fossil fuels. There are also other reasons for implementing energy-efficiency policies in the European Union and its member states. These include the wish to diminish the dependency on fuel imports, the increasing costs and the fact that fuel resources are limited, as well as the impacts on public health. The European building sector is responsible for about 40% of the total primary energy consumption. To reduce this share, the European Commission has introduced the Energy Performance of Buildings Directive (EPBD) (2010/31/EC) and more recently the Energy Efficiency Directive (EED – 2012/27/EU). These frameworks require member states to develop energy performance regulations for new buildings, a system of energy performance certificates (EPCs) for all existing buildings and policy programmes that support actions to reach specific goals, e.g. building only ‘nearly zero-energy buildings’ (NZEB) by 2020 and realizing an almost carbon-neutral building stock by 2050.
Formulating ambitions and sharpening regulations are relatively easy to do. Technical solutions are currently available to realize the NZEB standard in building projects and an increasing number of NZEB projects are being built. However, substantial evidence exists that mainstream building projects do not realize the expected energy performance in practice – this is the building performance gap. What is perhaps even more important in this respect is that the focus predominantly should be on the existing building stock. About 75% of the buildings that will comprise the European housing stock in 2050 have already been built today. Therefore, it is important to have an insight into whether or not the EPCs provide reliable information (Hamilton et al., Citation2013).
Many researchers have found evidence of the performance gap (and the underpinning reasons for it). This paper briefly elaborates on this subject in next section. This is followed by reference to the results of research by Guerra Santin, Itard, and Visscher (Citation2009) and Guerra Santin and Itard (Citation2010) focusing on the situation in newly built houses. The fourth section presents the findings of Majcen, Itard, and Visscher (Citation2013a, Citation2013b, Citation2015) who studied in detail the relation between the energy labels (EPCs) and the actual energy use in dwellings. The fifth section discusses these findings in order to answer the main question: What could be adequate policies and regulatory tools to control the actual energy use in houses? The conclusions are presented in the final section.
Performance gap
In Europe as much as 40% of all final energy use is used in the built environment. A total of 75% of this amount is for residential buildings (BPIE, Citation2011), therefore dwellings offer a large energy-saving potential. In the last few decades many European countries have introduced various energy-saving requirements in their national building codes. Before the 1970s there were few if any energy regulations for buildings, but after the first oil crises in the mid-1970s the demands on minimum U-values for walls were introduced into building regulations. In 1995 the Netherlands replaced the more prescriptive forms of regulations with energy performance requirements. In principle, energy performance regulations should create more latitude for finding and implementing innovative solutions to reduce the total amount of energy use of the building. Since the introduction of the EPBD in 2003 all European Union member states are required to establish and implement a form of energy performance regulations.
Building regulations are meant to prescribe a minimum accepted quality level for a building according to societal values and needs. However, the qualities (orientation, design, specification, built quality, maintenance, etc.) of a building can only partially influence energy use. The other significant influence is determined by the behaviour of the occupant. The design and materialization of a building can give better conditions for comfortable temperatures so these aspects are subject of the regulations (along with the lighting in the communal areas and use of lifts in multi-occupancy residential buildings). All other forms of energy use in dwellings (e.g. plug loads – refrigerators, washing machines, computers and cooking appliances) are not controlled by building regulations but covered by other legislation. In general, for older buildings the energy demand for space heating and cooling is dominant. In newer buildings with a very high level of insulation, the energy demand for appliances becomes dominant.
Regulations focus on the design and in the best cases there is even some control on the performance of a building at the end of the construction process. However, after the building is occupied there is currently little if any control over the energy use. The energy calculation methods used or referred to in regulations are based on models and parameters of the performance of construction types and materials, and on the expected or modelled heating behaviour of the inhabitants. It is clear that all these models and assumptions do not accurately portray the actual energy use. This can be called the performance gap. The performance gap occurs for several different reasons: the built artefact does not match the design (substitutions and poor built quality), the mechanical services are not commissioned correctly, the inhabitants do not understand how to operate the building, the inhabitants’ behaviour and practices are not as expected, or the building does not fit the inhabitants’ needs and capabilities.
Over the past 20 years numerous studies have compared the actual energy use with the expected or modelled energy use (Bordass, Cohen, Standeven, & Leaman, Citation2001; Bordass, Leaman, & Ruyssevelt, Citation2001; Branco, Lachal, Gallinelli, & Weber, Citation2004; Cayre, Allibe, Laurent, & Osso, Citation2011; Sorrell, Dimitropoulos, & Sommerville, Citation2009; Gram-Hanssen, Citation2010; Raslan & Davies, Citation2012; Hamilton et al., Citation2013). The general pattern that follows from these studies is that for dwellings with a good (theoretical) energy performance the actual energy use in general is higher than modelled. For the dwellings with a bad (theoretical) performance, the actual energy use is lower. There are various explanations for these findings. For the presumed good performance buildings it is a combination of underperformance of the building due to design and construction faults and changed behaviour of the occupants. This is partly the rebound effect (Berkhout, Muskens, & Velthuijsen, Citation2000; Galvin, Citation2015): if the conditions improve and the inhabitants think that the building is more energy efficient, they become less careful in their energy use behaviour (e.g. they use higher temperature settings, wear thinner clothing and operate the heating for longer periods). For the ‘bad’ performing buildings there is also evidence that the quality of the building could be underestimated. The U-values of solid walls in England were underestimated. Solid walls had been assumed to have a U-value of 2.1 W/m2K, however recent research has shown a value in the range of 1.6 W/m2K (Li et al., Citation2015). Rasooli, Itard, and Ferreira (Citation2016) found similar results in a study in the Netherlands. In addition to this there is large impact by the behaviour of the occupants. The models assume an average heating of the whole building, however in poorly insulated buildings the occupants are frugal and use heat sparingly and they also tend to heat only the spaces that they actually use.
Energy performances of new dwellings in practice
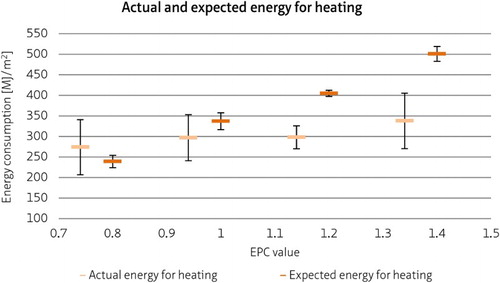
In 1995 energy performance regulation for space heating and cooling of newly built constructions were introduced in the Netherlands. The regulation consists of a standard (norm) that prescribes the calculation method which is called the energy performance norm. The standard results in a non-dimensional figure called the energy performance coefficient. Every few years the level of this coefficient was decreased, representing a lower energy use demand for building-related energy use. In 2021 this coefficient will be on the level of nearly energy neutral according to the EPBD. Since the introduction of the energy performance regulation there has been little assessment of the regulation’s effect on the actual energy use in the houses. Two studies found no statistical correlation between the energy performance coefficient level and the actual energy use per dwelling or per m2. Analysis of the WoON (WoOn Energie, Citation2009) survey, which was undertaken on behalf of the Dutch government in 2006 and contained a representative sample of 5000 dwellings, also found no correlation between the different levels of the energy performance coefficient and the actual energy use per dwelling and per m2. Guerra Santin, Itard and Visscher (Citation2009) and Guerra Santin and Itard (Citation2010) compared the actual and expected energy consumptions for 313 Dutch dwellings built after 1996. The method included an analysis of the original energy performance calculations that were submitted to the municipality as part of the building permit application, a detailed questionnaire and some day-to-day occupant diaries. These combined approaches generated very detailed and accurate data of the (intended) physical quality of the dwellings and installations, about the actual energy use (from the energy bills) and of the households and their behaviour. The dwellings were categorized according to their energy performance coefficient. Due to the relatively small sample size, the differences between the actual heating energy of buildings with different energy performance coefficient values were insignificant. Nonetheless the average consumption was consistently lower in buildings with a lower energy performance coefficient, but not nearly as low as expected. In this sample, it was found that the increased level of the energy performance had very little effect on the actual energy use. Guerra Santin et al. found that building characteristics (including heating and ventilation installations) were responsible for 19–23% of the variation in energy used in the recently built building stock (). Galvin (Citation2016, p. 75) found that the average energy performance gap in low-energy dwellings averaged 64%, but was 45% for passive houses.
Figure 1 Mean and 95% confidence interval for the actual energy consumption (MJ/m2) and expected energy for heating (MJ/m2) per EPC value
There are also indications that the gap is related to design and construction faults and that heating services operate in very different conditions than assumed beforehand. Nieman (Citation2007) showed that in a sample of 154 dwellings, 25% did not meet the energy performance requirements in the design phase due to mistakes in the calculations. Nevertheless the building permit was issued. In 50% of the dwellings, the realization was not in accordance with the design. These results comply with other findings about inadequate performance of the building industry, but also by a low level of quality monitoring by the construction parties and the poor performance of the building control authorities in the Netherlands and other countries (Meijer, Visscher, & Sheridan, Citation2002; Meijer & Visscher, Citation2006, Citation2008; Van der Heijden, Meijer, & Vischer, Citation2007). Taking into account the above findings, it is doubtful whether further tightening of the energy performance regulations will lead to improvements in actual outcomes.
Other and more efficient solutions exist to decrease the actual energy consumption of newly built dwellings. Important ingredients of the solution are: ensuring that appliances and installation are correctly installed, monitoring the calculated performances in practice; enlarging the know-how and skills of building professionals; and creating an effective and efficient building control and enforcement process. Monitoring the actual performance in the completed building becomes more important. The Dutch building control system is currently being reviewed. A new law on quality assurance for buildings will be introduced shortly. The main change will be that the responsibility for plan approval and site inspections will shift from municipal authorities to private parties. More significantly, the new emphasis will be on the assurance that the building ‘as built’ complies with the regulations. For many decades the main focus of building control in the Netherlands has always been on the design. So, this change can be considered as a step in the right direction. It is unclear yet how detailed such a compliance check on the completed building for the energy performance will be. For nearly energy-neutral buildings it would have to include a blower door test to check the air tightness and/or infrared scans to find thermal leakages.
Actual versus calculated energy use: existing dwellings
The largest energy saving potential is in the existing building stock. New dwellings add about 1% per year to the housing stock in Europe. The most important policy tool required by the EPBD in European member states is the issuing of EPCs. These give a hypothecated indication of the required energy to provide a certain average temperature in the building and depend on physical characteristics of the building. The certificate has no mandatory implications in the sense that owners could be forced to improve their buildings to certain levels. Nonetheless it is a crucial instrument for benchmarking and formulating policy goals. Building owners in all European Union member states have to obtain an EPC for a building at the moment it is sold or rented out. This is not yet current practice everywhere, mostly due to lack of enforcement. This especially applies to the private housing stock. In the Netherlands, however, the complete social housing stock is labelled with an EPC. The social sector in the Netherlands is still relatively large (35%) and well organized. For the social housing stock the EPCs are collected in a database called SHAERE (Sociale Huursector Audit en Evaluatie van Resultaten Energiebesparing, which translates as social rental sector audit and evaluation of energy saving results). With this database the progress of the renovation practices can be monitored.
The relation between the EPCs (with the calculated energy use) and the actual energy (based on measured data) use can be studied (Cohen & Bordass, Citation2015). A few years ago the sector formulated ambitious programmes, but these have been scaled down because of several reasons. The economic crisis of 2008–09 reduced the financial capacities of the housing associations and slowed the housing market. It also proved to be difficult to get approval of tenants for renovations that require an increase of the rents (70% of the tenants have to agree).
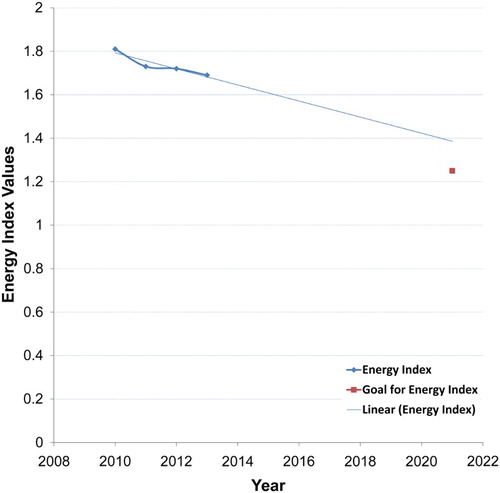
The Netherlands’ social housing sector agreed in 2012 with the government and the National Tenants Union to a covenant about energy renovation goals. The most important goal is to reach an average label B in 2020 for the whole sector, which comprises 2.3 million dwellings (35% of the total stock). Research with the SHAERE database shows the progress in renovation. demonstrates the label steps over 2010–13. Note that most of the renovations have led to small improvements. If the current figures are extrapolated to 2020, it is evident that the goals of an average label B will not be reached (). The label indexes relate the calculation of the energy index, which for label B is 1.25.
Figure 2 Distribution of the energy labels of the non-profit rented housing sector in the SHAERE databaseNote: SHAERE = Sociale Huursector Audit en Evaluatie van Resultaten Energiebesparing (Social Rental Sector Audit and Evaluation of Energy Saving Results)Source: Filippidou, Nieboer, and Visscher (Citation2014)
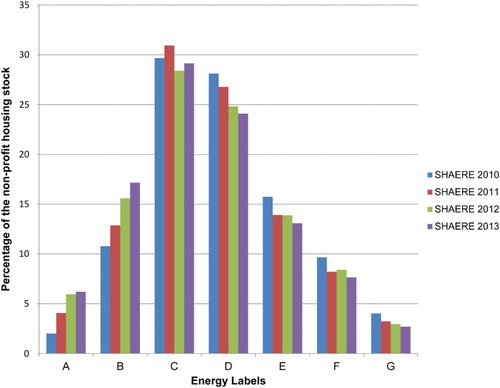
Figure 3 Development of the Energy Index in the Dutch non-profit housing sector since 2010Source: Filippidou, Nieboer, and Visscher (Citation2015)
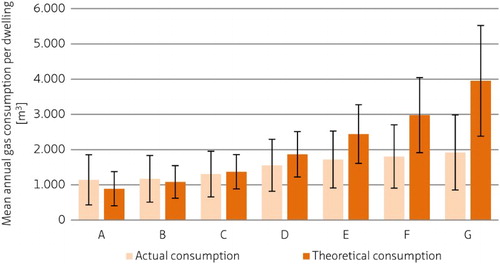
As noted previously, the actual domestic energy use is also influenced by the use and behaviour of the tenants (Gram-Hanssen, Citation2010). The dwellings with the worst EPC rating (category G) in practice use far less energy as expected, while the most energy-efficient dwellings (category A) use more. This is probably due to a combination of the rebound effect (an increase in comfort level of the dwellings), underperformance of the buildings and their equipment in the A- and B-labelled dwellings, as well as what Sunikka-Blank and Galvin (Citation2012) called the prebound effect: less energy used then expected in the E–G labelled dwellings due to a lower comfort level and a better-then-estimated performance of the buildings. shows the actual and theoretical gas consumption per dwelling per EPC. These findings for the Dutch housing stock were first generated in a research project by Majcen et al. (Citation2013a, Citation2013b).
Figure 4 Actual and theoretical gas consumption in Dutch dwellings for each energy label – per m2 dwelling areaSource: Majcen et al. (Citation2013a)
The research by Majcen et al. (Citation2013a, Citation2013b) was based on the Dutch energy labels issued in 2010 – a total of over 340,000 cases with 43 variables (regarding building location and technical characteristics, the properties of the label itself etc.). This dataset was derived from the publicly available database of the EPCs. These data were, on the basis of the addresses of the households, linked to actual energy use data. The energy data were provided by the CBS (Statistics Netherlands), which collected these data from the energy companies. The combined data file was then cleaned by deleting incomplete or obvious incorrect EPCs. This resulted in 193 856 usable cases. This still large sample proved to be representative for all housing types and energy label classes.
To understand how the energy label relates to the discrepancies, the gas and electricity consumption in various label categories were examined and analysed. The actual and theoretical gas use per dwelling was compared and then analysed per m2 of dwelling (). Little difference exists between the actual and theoretical energy use calculated per dwellings and per m2, except the difference in actual gas use between labels A and B. At the level of individual dwellings, the actual consumption was identical, but at the level of m2 the dwellings in category A use less gas than dwellings in category B. This may relate directly to the fact that dwellings in label category A were found to be considerably larger than all other dwellings. From these figures it is clear that although better labels lead to higher actual gas consumption, there is a clear difference between the mean theoretical and mean actual gas consumption for each label. For the most energy-efficient categories (A, A+ and A++) and for category B, shows that the theoretical calculation underestimated the actual annual gas consumption. This is in contrast to the rest of the categories for which the theoretical calculation largely overestimated the actual annual gas consumption. So this validates the concept of the prebound effect.
This research indicates that the energy label has some predictive power for the actual gas consumption. However, according to the labels, dwellings in a better label category should use on average significantly less gas than dwellings with poorer labels, which is not the case. The actual heating energy consumption is on average lower than theoretical consumption levels for most buildings (in this study for dwellings with labels C–G) as was observed previously by Guerra Santin, Itard, and Visscher (Citation2009), Branco et al. (Citation2004) Tigchelaar, Daniëls, and Maenkveld (Citation2011), Cayre, Allibe, Laurent, and Osso (Citation2011), and Hens, Parijs, and Deurinck (Citation2010). Guerra Santin (2009) already suggested that at a lower EPC value the difference between the expected and actual consumption will be smaller. The study of Majcen et al. (Citation2013a, Citation2013b) has proved this, and showed that even in very energy-efficient buildings actual gas consumption can exceed the predicted levels. These findings are also confirmed by Galvin (Citation2016).
Discussion: alternative policies and regulations to control energy use
Dimensions of controlling domestic energy use
As mentioned above, controlling the demand for domestic energy has various dimensions:
Prescription: traditional building regulations prescribe certain performances of the building envelope and the building services. Through building permit procedures a certain level of quality control is enforced.
Prediction: regulations for new buildings and energy labels for existing buildings use simulations models to predict the energy use.
Measurement: the actual energy use will be determined in the use phase by measuring.
For a long time there has been little research to couple together these aspects. This has changed in recent years since the energy-saving goals have become increasingly important. Insights from data of actual energy use and the actual performances of buildings (e.g. the real U-values) suggest that more specific forms of quality control are needed (Cohen & Bordass, Citation2015). These insights also allow for an improvement of the prediction models. It has also become clear that the behaviour of the inhabitants will significantly influence on the final energy use. At present, there is little done to control energy behaviours – pricing mechanisms for energy do not appear to be an effective deterrent and also have negative consequences on the poorest segments of society.
Traditional building regulations
Developments in building regulations and control
In the Netherlands as well as in many other countries, the building regulations are a recurring subject in the debate of governmental reviews as conflicting goals are evident. On the one hand, there is a desire to minimize regulations in order to reduce the administrative burden on citizens and businesses. On the other hand, there is a need to address new societal concerns through regulation and the establishment of standards to create a baseline for practice. Energy demand reduction and climate change mitigation are such concerns. The European Union and its member states have implemented regulations and enforcement schemes that should ensure very energy-efficient new buildings and have introduced instruments to improve the energy performance of the existing building stock. Although the general deregulation trend in Europe has led to less governmental intervention in the building sector, in the field of energy efficiency the number of regulations have increased and became more stringent. The desire for deregulation has led to a transfer of some responsibility to building owners and actual quality control has been transferred from the municipalities to private parties. At the same time, there has been a shift in the quality control from the design stage to the ‘as built’ situation. However, the increasing importance of assuring in-use energy performance has not been reflected in the regulations.
The research centre OTB (Research for the Built Environment at Delft University of Technology, the Netherlands) has been involved in studying alternative visions on building regulatory systems in international comparative projects (e.g. in Meijer, Visscher and Sheridan, Citation2002; Meijer and Visscher, Citation2006, Citation2008; and ECORYS, Delft University of Technology, Citation2015). What can be noticed in most countries are discussions (or sometimes even actual developments) where the balance slowly shifts:
From command and control regulations towards more economic incentive-based policies.
From public control and enforcement towards a more dominant role of private parties/building professionals (together with the creation of far more robust and reliable certification and accreditation schemes).
From a strong focus on control of the design to the monitoring of the building process and testing of the quality of the final building and post occupancy monitoring.
For a successful transition towards energy neutral construction, stricter demands must be set for the knowledge and skills of the building professionals (designers, engineers, installers, constructors, etc.). Bordass and Leaman (Citation2013) argue that professionals need to take increased responsibility for outcomes. Professionals will have to use new techniques and improve the quality and accuracy of the work. This means that they not only will have to improve their operating procedures but also have to provide performance guarantees. Maybe the competent persons scheme in England and Wales (e.g. in ECORYS, Delft University of Technology, Citation2015) could be an interesting example for this. Owners and users will require quality guarantees from the designers, installers and constructors. Certification and accreditation of parties, processes and products will become more important for building processes in general. For the realization of high energy performance standards, a reliable quality assurance system will be very important. In most countries that have some experiences with passive houses some form of performance guarantee and associated quality assurance scheme exists. In this respect Stevenson and Leaman (Citation2010a, Citation2010b) give a good overview of methods that can be used for quality control and performance measurement.
Misfits of current regulatory approaches
It is evident that with the current approach found in general regulatory instruments can only partly influence the actual energy demand in houses. Regulations only address the energy use that is (partly) related to the physical condition of the building (as appliances and inhabitants are outside their scope). However, there needs to be a shift in focus to ascertain the ‘as built’ quality. For example, nearly zero-energy buildings would require airtightness tests and infrared scans (to highlight any thermal bridging). The adequate functioning and the capacity of ventilation systems also needs testing. A differentiation is needed in regulations to account for in-use performance. This is because any mistake during the construction process will lead to a reduction of the minimum required performance and efficiency, thereby negatively influencing the energy demand.
Analysing the actual energy use compared with the indications of the EPCs gives a clear insight in the under-prediction of the use in houses with good labels and large over-predictions in the house with bad labels. This also leads to wrong assumptions of payback times of the investments. Strict regulations for new houses and retrofits will improve the physical performance of the building, but have a limited influence on the actual energy use.
Alternative forms of governance
Given the limitations of current building regulations, what other forms of governance could be used to reduce the domestic energy use and CO2 emissions?
Energy performance guarantees
An innovative approach for deep energy renovations to nearly zero in the Netherlands is called the net zero-energy renovation concept (Rovers, Citation2014). Houses from the 1960s and 1970s with a poor energy performance are retrofitted with a new highly insulated skin, air-source heat pump heating and photovoltaic (PV) panels. The renovation process is highly industrialized and the renovation time is limited to two weeks or less. Currently these deep retrofits are mostly done to social housing (houses from housing associations). A change in governance has been influential. A new law allows the housing associations to increase the rent by the cost of the average energy bill. After the retrofit, the tenants only pay a higher rent but no energy bill at all, provided their actual energy use within a prescribed limit of reasonable use. This only works if the theoretical estimations of the actual energy demand are correct.
Concurrent with this is the development of a new contractual obligation: an energy performance guarantee by the construction company. This is a kind of energy performance contract where the owner-occupant pays for the retrofit and gets a guarantee for a zero energy bill. In principle, the increase in rent should be offset by not having to pay an energy bill. The first evaluations are appearing now (Energiesprong, Citation2016), but they are only based on just a few cases. Some of the occupants are satisfied, but others are dissatisfied because the energy demand concept is below their expectation. It is based on lower indoor temperatures (20°C), short times for showering and an energy-sober lifestyle. If these occupants exceed the allowed level of energy use, then they have to pay extra for it. There will be much variation among users, but a reasonable baseline for normal energy demand may act as a positive influence on behaviours and practices. The near-zero concept of houses will help to reduce the variation, but still there will remain some variation and really zero cannot be guaranteed. This suggests that in addition to the physical aspects of creating a near-zero building, there are also social aspects relating to energy demand that need to be addressed. However, the overall impact on energy and CO2 reductions from these buildings (and the underlying regime that created them) has been significant.
Energy performance guarantees are basically a voluntary development by market parties. Until now, the underpinning governance has been supportive. The initiative was developed by an agency (Energiesprong, which translates as ‘energy jump’) and financially supported by the government. Recently the support programme has stopped and the expectation now is that the market should further develop it.
Economic incentives
The policies for the existing stock are largely based on the EPCs. In the first place homeowners and occupants are informed about the energy performance of a dwelling. This can influence buyers and should stimulate owners to renovate their homes. Often the incentive schemes use the concept of payback times. This is based on the argument why not invest (e.g. €10 000) if this can be earned back in 10 years by a lower energy bill? The insights presented in this paper show that this hardly works for renovations on the skin of a building to reduce the heating demand. There is a slight reduction of energy use, but the comfort level increases (higher temperatures). To have a real impact on savings the retrofit should go to the level of near zero.
Another investment strategy is in on-site renewable energy generation. This is independent from the occupant behaviour. However, it is dependent on the energy price. The drastic reduction of the oil price in 2015 illustrates this. The feed-in tariffs for electricity are set by governments and are also unpredictable. In the Netherlands, homeowners can yearly feed in 3000 kW for the same price as the price they have to pay for electricity, which includes 75% taxes. This arrangement makes it very profitable to buy PV panels. However, the government is now considering a change to this regulation in 2020. This shows that taxes and incentives can be a very strong governance tool.
Murphy, Meijer and Visscher (Citation2012) and Murphy (Citation2014) investigated how owner-occupiers respond to various kinds of incentives by the national and local Dutch governments. Most of these incentives were connected to EPCs and advise on making houses more energy efficient. These forms of governance had only modest success. The willingness to invest in energy renovations is still limited, especially due to many uncertainties about the reliability of the contractors and the actual energy savings as found by Galvin (Citation2014) in Germany.
Information
Other forms of information about actual energy use seem more promising. Quarterly energy use reports of the energy companies give better insights and are related to previous year’s corresponding quarter and to neighbours’ energy patterns. Smart meters are nowadays installed on a large scale. In a few years most homes in the Netherlands (and in several other countries) will have one. At the same time–energy management displays are increasingly used. Smart meters and these displays can be seen and used on smart phones. The insight will increase, but is this enough to stimulate energy-saving behaviour including renovation investments? Studies (e.g. Darby, Citation2008) about the potential of giving accurate feedback to inhabitants about their behaviour indicate that 5–10% savings might be achieved.
Cap and trade
Some lessons from the non-domestic sector may be appropriate. According to Nishida and Hua (Citation2011) and Nishida, Hua and Okamoto (Citation2016), the use of a cap-and-trade scheme in Tokyo is very promising, although its application to individual dwellings seems unlikely as it requires a competence that most homeowners do not have. However, a system that integrates building performance and energy demand into a simple package might be developed for the domestic sector. A system with packages that provide a fixed amount of monthly energy usage (e.g. similar to pricing systems for mobile phones), where a standard use would have a standard price, but an increased use would have a substantially higher price deserves further investigation. Such a scheme would require a definition of what a normal or average use would be for various classes of dwellings as well as the sizes and lifestyles of households.
Conclusions
To improve this situation for new residential buildings it has to be assured that constructions and installations are installed properly and in such way that they are not vulnerable for unpredictable or misuse by the occupants. This will set new demands on both the construction industry and the control/enforcement process. The public building regulations and enforcement systems will continue to have an important role.
The improvement of the existing building stock remains a major challenge. The potential energy savings are large, but the barriers to overcome are also high. Actual energy savings in renovated dwellings are below expectations due to rebound effects and lower than expected energy use in the old dwellings. Many owners believe that the benefits of the measures do not outweigh the costs.
For all kinds of governance policies and instruments, an accurate insight into the actual performances of buildings, actual energy use, behaviour and preferences of occupants will be essential. The unexplored territory for governance is how occupants’ expectations, behaviours and social practices in using energy can be changed. Rational, economic incentives do not appear to be convincing or effective. Other levers, narratives and instruments are needed to monitor and encourage a frugal approach to energy demand and its management. To ensure the success of governance strategies and instruments, the support and engagement with occupants will have a vital role. This represents a new area for (national and municipal) governments and the construction supply side. For the latter, it will necessitate new forms of engagement with occupants to demonstrate optimized use and new social practices, as well as ensuring that energy performance guarantees deliver. The creation of positive feedback loops for inhabitants will be essential.
Disclosure statement
No potential conflict of interest was reported by the authors.
ORCID
Henk Visscher http://orcid.org/0000-0003-0929-1812
Related Research Data
References
- Berkhout, P., Muskens, J., & Velthuijsen, J. (2000). Defining the rebound effect. Energy Policy, 28(6–7), 425–432. doi: 10.1016/S0301-4215(00)00022-7
- Bordass, B., Cohen, R., Standeven, M., & Leaman, A. (2001). Assessing building performance in use 2: Technical performance of Probe buildings. Building Research and Information, 29(2), 103–113. doi:10.1080/09613210010008027
- Bordass, B., & Leaman, A. (2013). A new professionalism: Remedy or fantasy? Building Research and Information, 41(1), 1–7. doi:10.1080/09613218.2012.750572
- Bordass, B., Leaman, A., & Ruyssevelt, P. (2001). Assessing building performance in use 5: Conclusions and implications. Building Research and Information, 29(2), 144–157. doi:10.1080/09613210010008054
- Branco, G., Lachal, B., Gallinelli, P., & Weber, W. (2004). Predicted versus observed heat consumption of a low energy multifamily complex in Switzerland based on long-term experimental data. Energy and Buildings, 36(6), 543–555. doi: 10.1016/j.enbuild.2004.01.028
- Buildings Performance Institute Europe (BPIE). (2011). Europe’s buildings under the microscope. Brussels: BPIE. Retrieved from: http://bpie.eu/wp-content/uploads/2015/10/HR_EU_B_under_microscope_study.pdf
- Cayre, E., Allibe, B., Laurent, M. H., & Osso, D. (2011). There are people in this house! How the results of purely technical analysis of residential energy consumption are misleading for energy policies, Proceedings of the European Council for an Energy Efficient Economy (ECEEE) Summer School, 6–11 June 2011, Belambra Presqu'île de Giens, France.
- Cohen, R., & Bordass, B. (2015). Mandating transparency about building energy performance in use. Building Research and Information, 43(4), 534–552. doi: 10.1080/09613218.2015.1017416
- Darby, S. (2008). Energy feedback in buildings: Improving the infrastructure for demand reduction. Building Research & Information, 36(5), 499–508. doi:10.1080/09613210802028428
- ECORYS, Delft University of Technology. (2015). Simplification and mutual recognition in the construction sector under the Services Directive, European Commission. Retrieved from http://bookshop.europa.eu/.
- Energiesprong. (2016). Eerste ervaringen met prestatiegarantie voor nul op de meter woningen (First experiences with performance guarantees for zero on the meter dwellings). Retrieved from http://energielinq.nl/resources/monitoringprestatiegarantie.
- Filippidou, F., Nieboer, N., & Visscher, H. (2014). The pace of energy improvement in the Dutch non-profit housing stock, in Proceedings of World Sustainable Building 2014 Barcelona Conference (volume 3, pp. 233–239). Barcelona: Green Building Council España. ISBN 978-84-697-1815-5. Retrieved from: http://www.wsb14barcelona.org/papers.html.
- Filippidou, F., Nieboer, N., & Visscher, H. (2015). Energy efficiency measures implemented in the Dutch non-profit housing sector. In Proceedings of the ECEEE 2015 Summer Study on Energy Efficiency. Stockholm: European Council for an Energy Efficient Economy. Retrieved from http://proceedings.eceee.org/visabstrakt.php?event=5&doc=5-093-15.
- Galvin, R. (2014). Why German homeowners are reluctant to retrofit. Building Research & Information, 42(4), 398–408. doi: 10.1080/09613218.2014.882738
- Galvin, R. (2015). Integrating the rebound effect: Accurate predictors for upgrading domestic heating. Building Research & Information, 43(6), 710–722. doi: 10.1080/09613218.2014.988439
- Galvin, R. (2016). The rebound effect in home heating: A guide for policymakers and practitioners. Abingdon: Earthscan from Routledge.
- Gram-Hanssen, K. (2010). Residential heat comfort practices: Understanding users. Building Research and Information, 38(2), 175–186. doi:10.1080/09613210903541527
- Guerra Santin, O., & Itard, L. (2010). Occupant behaviour in residential buildings in the Netherlands: Determinants and effects on energy consumption for heating. Building Research & Information, 38(3), 318–338. doi: 10.1080/09613211003661074
- Guerra Santin, O., Itard, L., & Visscher, H. J. (2009). The effect of occupancy and building characteristics on energy use for space and water heating in Dutch residential stock. Energy and Buildings, 41, 1223–1232. doi: 10.1016/j.enbuild.2009.07.002
- Hamilton, I. G., Summerfield, A. J., Lowe, R., Ruyssevelt, P., Ewell, C. C., & Oreszczyn, T. (2013). Energy epidemiology: A new approach to end-use energy demand research. Building Research and Information, 41(4), 482–497. doi: 10.1080/09613218.2013.798142
- Hens, H., Parijs, W., & Deurinck, M. (2010). Energy consumption for heating and rebound effects. Energy and Buildings, 42(1), 105–110. doi: 10.1016/j.enbuild.2009.07.017
- Li, F. G. N., Smith, A. Z. P., Biddulph, P., Hamilton, I. G., Lowe, R., Mavrogianni, A., … Oreszczyn, T. (2015). Solid-wall U-values: Heat flux measurements compared with standard assumptions. Building Research & Information, 43(2), 238–252. doi:10.1080/09613218.2014.967977
- Majcen, D., Itard, I., & Visscher, H. J. (2013a). Theoretical vs. Actual energy consumption of labelled dwellings in the Netherlands: Discrepancies and policy implications. Energy Policy, 54, 125–136. doi: 10.1016/j.enpol.2012.11.008
- Majcen, D., Itard, L., & Visscher, H. J. (2013b). Actual and theoretical gas consumption in Dutch dwellings: What causes the differences? Energy Policy, 61, 460–471. doi: 10.1016/j.enpol.2013.06.018
- Majcen, D., Itard, L., & Visscher, H. J. (2015). Statistical model of the heating prediction gap in Dutch dwellings: Relative importance of building, household and behavioural characteristics. Energy and Buildings, 105, 43–59. doi: 10.1016/j.enbuild.2015.07.009
- Meijer, F. M., & Visscher, H. J. (2006). Deregulation and privatisation of European building-control systems. Environment and Planning B: Planning and Design, 33(4), 491–501. doi: 10.1068/b3109
- Meijer, F. M., & Visscher, H. J. (2008). Building regulations from an European perspective. In Proceedings of COBRA 2008 – The construction and building research conference of the Royal Institution of Chartered Surveyors, RICS, London.
- Meijer, F. M., Visscher, H. J., & Sheridan, L. (2002). Building regulations in Europe, part I: A comparison of systems of building control in eight European countries. Housing and Urban Policy Studies 23. Delft: Delft University Press.
- Murphy, L. C. (2014). The influence of energy audits on the energy efficiency investments of private owner-occupied households in the Netherlands. Energy Policy, 65, 398–407. doi: 10.1016/j.enpol.2013.10.016
- Murphy, L. C., Meijer, F. M., & Visscher, H. J. (2012). A qualitative evaluation of policy instruments used to improve energy performance of existing private dwellings in the Netherlands. Energy Policy, 45, 459–468. doi: 10.1016/j.enpol.2012.02.056
- Nieman. (2007). Final report housing quality indoor environment in new built dwellings. Arnhem: Vrom inspectie Regio Oost.
- Nishida, Y., & Hua, Y. (2011). Motivating stakeholders to deliver change: Tokyo’s Cap-and-Trade Program. Building Research and Information, 39(5), 518–533. doi: 10.1080/09613218.2011.596419
- Nishida, Y., Hua, Y., & Okamoto, N. (2016). Alternative building emission-reduction measure: Tokyo Cap-and-Trade Programme (TCTP). Building Research and Information, 44(5-6). doi:10.1080/09613218.2016.1169475
- Raslan, R., & Davies, M. (2012). Legislating building energy performance: Putting EU policy into practice. Building Research and Information, 40(3), 305–316. doi:10.1080/09613218.2012.681440
- Rasooli, A., Itard, L., & Ferreira, C. I. (2016). A response factor-based method for the rapid In-situ determination of wall’s thermal resistance in existing buildings. Energy and Buildings, 119, 51–61. doi: 10.1016/j.enbuild.2016.03.009
- Rovers, R. (2014). New energy retrofit concept: ‘Renovation trains’ for mass housing. Building Research and Information, 42(6), 757–767. doi: 10.1080/09613218.2014.926764
- Sorrell, S., Dimitropoulos, J., & Sommerville, M. (2009). Empirical estimates of the direct rebound effect: A review. Energy Policy, 37(4), 1356–1371. April 2009. doi: 10.1016/j.enpol.2008.11.026
- Stevenson, F., & Leaman, A. (2010a). Evaluating housing performance in relation to human behavior: New challenges. Building Research and Information, 38(5), 437–441. doi: 10.1080/09613218.2010.497282
- Stevenson, F., & Leaman, A. (2010b). Developing occupancy feedback from a prototype to improve housing production. Building Research and Information, 38(5), 549–563. doi: 10.1080/09613218.2010.496182
- Sunikka-Blank, M., & Galvin, R. (2012). Introducing the prebound effect: The gap between performance and actual energy consumption. Building Research and Information, 40(3), 260–273. doi:10.1080/09613218.2012.690952
- Tigchelaar, C., Daniëls, B., & Maenkveld, M. (2011). Obligations in the existing housing stock: Who pays the bill?, Proceedings of the European Council for an Energy Efficient Economy, ECEEE Summer School, 6–11 June 2011, France.
- Van der Heijden, J., Meijer, F., & Vischer, H. (2007). Problems in enforcing Dutch building regulations. Structural Survey, 25(3-4), 319–329.
- WoON Energie. (2009). Woononderzoek Nederland, module energie, VROM.