
ABSTRACT
Using post-occupancy evaluations of seven mixed-mode buildings – three in Australia and four in India – this paper demonstrates that effective mixed-mode conditioning (instead of year-round air-conditioning) can deliver comfortable workspaces. Occupant feedback reinforces strong associations between overheating, thermal comfort, overall comfort and perceived productivity. However, differing levels of thermal acceptability within and between the Australian and Indian contexts are evident. Occupants in the Indian buildings were found to tolerate a wider range of temperatures when compared with Western contexts where lower temperature limits entrench an energy demand through a greater reliance on air-conditioning. The outcomes from the study suggest that the perception of overheating and consequent risk to building performance can be intensified when occupants perceive limited adaptive opportunity or problems are not rectified quickly, whereas perceived control is less important where building systems are user responsive. Occupants in three of the study buildings also perceived higher-than-anticipated comfort which could be attributable to well-liked attributes, such as break-out spaces, daylight and fresh air included in these buildings. The findings challenge designers and clients to develop user-responsive climate interactive workplaces that capitalize on spatial and mixed-mode environmental control to tackle the question of overheating.
Introduction
Thermal comfort as experienced by occupants is widely accepted to play a critical role in influencing overall comfort. Discomfort from overheating in buildings has a detrimental effect on occupants’ wellbeing and productivity (Candido, Kim, de Dear, & Thomas, Citation2016; Leaman & Bordass, Citation1999; Vischer, Citation2007; Wyon, Citation2004). From a building energy perspective, the notion of overheating is typically understood using a ‘universal’ heat balance model for thermal comfort (Fanger, Citation1970) where the exceedance of temperatures above a prescribed limit causes discomfort. To mitigate this discomfort, the source of overheating can be eliminated/reduced or energy can be expended on cooling to offset it. Nonetheless, this standardized management of thermal conditions is questioned by others who recognize thermal comfort to be a ‘socio-cultural achievement’ (Chappells & Shove, Citation2005; Cole, Robinson, Brown, & O'Shea, Citation2008) based on ideas of thermal delight (Heschong, Citation1979) and adaptation (de Dear & Brager, Citation1998; Humphreys, Citation1978; Nicol, Raja, Allaudin, & Jamy, Citation1999).
Adaptive models of comfort (de Dear & Brager, Citation1998; Nicol & Humphreys, Citation2010) in standards such as ASHRAE-55 2013 and EN 15251 (CEN, Citation2012) define a wider range of comfort temperatures for naturally ventilated buildings that are more compatible with the outdoor conditions. However, year round air-conditioning (AC), often justified by Fanger’s predicted mean vote (PMV) model, is fast becoming entrenched as the primary means to combat overheating in workspaces across the world (Ackermann, Citation2002; Cox, Citation2012; Ürge-Vorsatz, Cabeza, Serrano, Barreneche, & Petrichenko, Citation2015). This use of AC continues even when the risk of overheating is only restricted to a part of the year. Leasing agreements and rating tools further reinforce this practice due to the framing of most criteria and guidelines that support and reward the traditional heating, ventilation and air-conditioning (HVAC) perspective (Thomas & Thomas, Citation2010).
The consequences of this approach in developing countries like India are significant. Unrestrained development of commercial workspaces (Kumar, Kapoor, Deshmukh, Kamath, & Manu, Citation2010), coupled with an increasing uptake of premium-grade buildings designed to deliver a homogenous thermal environment 22.5 ± 1.5°C AC all year round (Cox, Citation2012) has the potential to take India to a tipping point in terms of unbridled energy consumption (Sivak, Citation2009; Ürge-Vorsatz et al., Citation2015).
Mixed-mode buildings use AC only when the indoor conditions are outside the acceptable comfort range. These buildings are a hybrid of fully AC and natural ventilation. Although studies suggest these buildings improve comfort, productivity and air quality (Brager, Citation2006; Leaman & Bordass, Citation2001) and save energy when compared with conventional AC buildings (Brager, Citation2000; CIBSE, Citation2000; Rowe, Citation2003), mixed-mode operation is poorly understood and its uptake remains low. For example, stipulation of the PMV model for the AC (active) mode, as seen in ASHRAE-55, has meant that in practice the extent to which a building can operate in the naturally ventilated (passive) mode is typically governed by AC thermostat settings rather than any wider band of operative temperatures that might have been permissible under the adaptive model. This in turn reduces the viability of designing a building that might operate in two modes – already perceived to be a challenge.
A recent field study (India Model of Adaptive Thermal Comfort – IMAC) (Manu, Shukla, Rawal, Thomas, & de Dear, Citation2016) found Indian occupants to be even more adaptive than predicted by the adaptive models for naturally ventilated buildings within ASHRAE-55, Citation2013 and EN 1525, reinforcing the socio-cultural notion of thermal comfort. Significantly, the IMAC study also established a single model of comfort for mixed-mode buildings that is statistically valid for both AC and naturally ventilated modes. The model, applicable for 30-day outdoor running mean air temperatures ranging from 13.0 to 38.5°C, shows neutral operative temperature varies from 21.5 to 28.7°C, and affords a ± 3.5°C range for 90% acceptability.
This paper investigates the context-specific opportunities and constraints for pursuing mixed-mode buildings as a means to combat overheating. It draws on feedback from mixed-mode buildings subject to a range of thermal comfort regimes and environmental control systems of different types from Australia and India. In particular, it seeks to identify why some buildings work well and others do not, what lessons can be applied more broadly towards alternate approaches to comfort in the workplace across both contexts.
Methods
The paper develops a rich narrative of building performance for seven mixed-mode buildings – three in Australia and four in India – using a post-occupancy evaluation (POE) framework (Bordass, Leaman, & Ruyssevelt, Citation2001; Vischer, Citation2007) to interrogate building design, operation and user feedback. The research presented emphasizes the interrelationships between approaches to environmental control, designed attributes and outcomes for the occupants in the two contexts.
The Australian buildings (Aus1 in Sydney; Aus2 and Aus3 in Melbourne) are located in a temperature climate characterized by warm/hot summer and cool winters. The four Indian buildings are located in relatively more challenging conditions – Ind1 and Ind2 in the composite climate of the National Capital Region (Delhi) characterized by long, hot summers, a humid monsoon and dry, cool winters; while Ind3 and Ind4 are located in the hot, dry climate of Ahmedabad (Bansal & Minke, Citation1995). The buildings selected for analysis include a range of mixed-mode systems (see and detailed descriptions below) that are adopted for contemporary workplaces in those countries. Six of the seven buildings (except Ind4) were designed with an explicit intent to include environmentally sustainable design features and principles, as detailed below. The Indian study buildings were part of the India Model for Adaptive Thermal Comfort (IMAC) (Manu et al., Citation2016) dataset and in all cases included active systems for cooling. Given the emphasis on combating overheating in this paper, some of the mixed-mode buildings in the IMAC study are not included here because they used active systems only for winter heating.
Table 1. Description of the study buildings.
The study approach included a review of project information, site visits and interviews with key stakeholders (owner/developer, design team and building manager) to gain an understanding of the individual buildings, their environmental control systems and performance in use. Building occupants in all seven buildings were surveyed using the Building Use Studies (BUS) Workplace Questionnaire (paper based) to gain their feedback on the long-term use of building. Additional feedback on issues that occupants raised in the BUS surveys was also elicited using focus groups for Aus2 and Aus3. The BUS surveys were administered after a minimum of one year of occupancy in six cases, but nine months of occupancy in the case of Ind2. This ensured that occupants had experienced the full range of seasonal variation in the building, while overcoming any ‘Hawthorne effect’ (Landsberger, Citation1958). The BUS survey elicits feedback on over 44 benchmarked variables ranging from thermal comfort in summer and winter to design and perceived productivity (Leaman & Bordass, Citation2007). With the Indian monsoon considered a distinct season with potential overheating implications, additional questions regarding thermal comfort and air quality in the monsoon were included for the Indian study buildings. The BUS variables discussed in this paper are summarized in . Whereas overheating is typically characterized with respect to monitored temperature data assessed against predetermined thermal comfort criteria, this paper foregrounds occupant feedback as the primary indicator of overheating – in particular their overall satisfaction with respect to thermal comfort rated on a seven-point A-type scale (where 1 is worst, 7 is best, and dissatisfaction is computed as those rating as 1, 2 or 3), and whether they perceive conditions in each of the seasons as being too hot or too cold (4 is best, 1 = too hot; 7 = too cold).
Table 2. Summary of BUS study results.
Occupant feedback with respect to questions of overall comfort, control over cooling and effectiveness of response to requests for change is investigated in relation to the feedback for thermal comfort – while consistently recognizing the particular contexts of the individual buildings in terms of designed attributes, environmental control strategies and ongoing operation. Occupant ratings of satisfaction with thermal comfort and overall comfort are also compared against perceived productivity and health in order to gauge if environmental conditions pose impediments to getting work done effectively or impact occupants perception of health. Occupant perception of productivity and health have been argued to provide appropriate and practical indicators which are consistent for all respondents in a building and also enables comparison across buildings (Leaman & Bordass, Citation1999; Sullivan, Baird & Donn, Citation2013) in contrast to the use of indicators such as ‘sick days off’ or ‘key board strokes’ which are becoming less relevant for contemporary workforces across the globe.
As a point of comparison, in the case of the Indian buildings, this paper also draws on thermal comfort field study (TCS) data for the four Indian buildings comprising a ‘right here right now’ survey and physical measurements. These data were originally collated to distil the adaptive models for naturally ventilated and mixed-mode buildings in the IMAC study (Manu et al., Citation2016) using the field methods and data analyses protocols of the ASHRAE RP-884 precedent (de Dear & Brager, Citation1998). The ‘right here right now’ survey was administered to occupants at each workplace, once per season – summer, winter and monsoon, with responses sought for thermal sensation, temperature preference and thermal acceptability, air movement preference, clothing insulation level and metabolic activity. Indoor climatic parameters experienced by each respondent were simultaneously logged, including air temperature, globe temperature, relative humidity and air velocity. Methods and instrumentation are further detailed in Manu et al. (Citation2016).
The approach of examining TCS data against long-term feedback enables a better understanding of the extent that occupants in the subcontinent adapt to the composite and hot, dry climates in which they are located, and where opportunities and caveats lie. Relevant metrics are mean thermal sensation, percentage of respondents rating thermal conditions as unacceptable, coincident indoor operative temperatures as well as calculated neutral operative temperatures and information on the extent of the use of fans. These aspects and associated notes are summarized in .
Table 3. Selected thermal comfort field study (TCS) survey results for Indian study buildings.
Although equivalent ‘right here right now’ survey and physical measurements were not elicited at the time of the Australian POE studies, all three buildings were operated within predetermined temperature criteria monitored by the building management system (BMS) on a zone-by-zone basis within these buildings. Given that temperature modulation in the occupied zones is controlled by the BMS sensors, it can be argued that space temperatures would generally stay within the stipulated temperature ranges set within the BMS. At the outset it is worth noting that all three Australian buildings were originally operated to a 25°C cooling set-point to govern the shift to passive cooling. Although less stringent than the typical 24°C limit in AC buildings, the limit is more conservative than would be permitted for the passive mode under the ASHRAE-55 adaptive comfort model for in summer. For 90% acceptability the limits for Sydney and Melbourne would be 26.5 and 25.8°C respectively, and limits for 80% acceptability would be 28.2 and 26.8°C respectively.Footnote1
The three Australian buildings were monitored for actual energy performance (total energy) using the NABERS energy rating protocol (National Australian Building Environmental Rating Scheme)Footnote2 at a time when the top performance level of 5 Stars (176 kgCO2/m2a for Sydney and 181 kgCO2/m2a for Melbourne) represented a 47% improvement over the 2.5-Star industry average. Consistent energy monitoring was not conducted as part of the original study of the Indian buildings. Consequently, as a secondary point of reference, parametric building energy simulation (using EnergyPlus) of a five-zone building model under different set-points is used to generate potential energy savings from cooling when capitalizing on the greater tolerance of temperature in Sydney, Melbourne, Delhi and Ahmedabad.
A brief description of the seven buildings is summarized in . Sectional drawings of these buildings are provided in , and relevant BUS and TCS results are summarized in and respectively. The pertinent outcomes for each building are discussed below in relation to design approach, building attributes and environmental control strategies. Broader lessons for combating overheating in workplaces from these studies in relation to the literature and the author’s experience of other buildings in both countries/contexts are discussed below.
Figure 1. Cross-sectional views of the study buildings.
POE studies of seven mixed-mode buildings
Building Aus1, Sydney
This building has been noted (Thomas & Hall, Citation2004) for its integrated environmental design process whereby client commitment and tangible environmental criteria at project inception enabled a strong energy performance (4.5-Star NABERS, 176 kgCO2/m2a). Air is drawn through operable louvres on the south facade across the narrow 15-m floor plate and out through solar chimneys on the north which are integrated in the space between twin-blade structural columns. Other elements for environmental control include external slatted screens which provide shading and security to the operable high-performance glass facade, exposed thermal mass in the ceiling for night cooling, and a BMS that controls the change over from passive mode to supplementary AC via a variable refrigerant volume system, based on a 19–25°C criterion.
Notwithstanding the energy-efficient performance, occupant feedback regarding the building was disappointing (). Occupants rated the building as too hot (33% in ), consistent with poor scores for satisfaction with temperature (3.2) and air in summer (3.1). Interviews with the building manager revealed that the problem of overheating was traced to an erratic temperature and ventilation control system driving the louvers, and to uncontrolled overheating on the top-floor spaces that were not linked to the solar chimney. Following complaints the set-points across the building were narrowed to 20–24°C. Further to occupant perception of excessively hot temperatures and unsatisfactory temperature conditions, the survey also shows a low perception of control over heating, cooling, noise and ventilation as well as low satisfaction rates for noise, overall comfort, design, and perceived productivity and health (). Site visits also suggested that the noise concerns within the open-plan office layout were further aggravated by the acoustically reflective surfaces of the exposed concrete ceilings. It would appear that the low satisfaction with indoor environmental parameters coupled with a low perception of control with these aspects serve to exacerbate occupants’ overall dissatisfaction
Building Aus2, Melbourne
Aus2 was fully refurbished to achieve the top 6-Star Green Star Office Design rating (GBCA, Citation2014). The building, detailed in Thomas and Vandenberg (Citation2007), is located in a constrained 10 × 55 m site with operable windows only possible on its shorter edges. An existing stair alongside one party wall was reinstated as the main circulation route and remodelled as both a light-well and thermal stack. Temperature, humidity, daylight and lighting levels, air quality and occupation are monitored by a BMS in order to control the changeover from natural ventilation to cooling by fan coil units, maintain space temperatures between 19 and 25°C, manage a night-purge strategy to ‘pre-cool’ the exposed concrete ceilings, and regulate lighting and ventilation in occupied zones.
As seen in , the occupants rated the building highly for temperature, air and overall comfort with scores significantly better than both scale midpoints and BUS benchmarks. The occupants also rated the building highly for its design, facilities, formal and informal meeting spaces, space utilization, and perceived health and productivity. Site visits, interviews and focus groups revealed that proactive building management enabled early problems to be rectified quickly, such as incorrect set-points in winter and a night-purge system which was operating regardless of outside temperature. The building has consistently achieved a 5 Star NABERS Energy rating (181 kg CO2/m2a) for its actual energy consumption.
Building Aus3, Melbourne
Aus3 was developed as a workplace for a local government body with ground-floor retail spaces and underground parking. Designed as a demonstration project for bioclimatic low energy architecture, the building incorporates both active and passive modes of environmental control. It integrates a 100% outside air-displacement system, substantive passive cooling (night ventilation of its thermal mass in the concrete-vaulted ceiling), and a back-up system for cooling via chilled-beam ceilings. Space temperatures are regulated by the BMS to stay within the 20–25°C range, and users are able to exercise individual control of fresh air vents and a task-lighting system. The building includes many other high-performance features and was expected to consume significantly less energy than the threshold for a 5-Star energy rating (Tan, Citation2007). However, a recent review of the energy performance found that the building had been performing at 4.0 Stars (245 kg CO2/m2a) ‘well below its potential due to the state of the HVAC controls’ and ‘complexity associated with the building’s web of relatively unfamiliar sub-systems’ (Hoogland & Bannister, Citation2014, p. 50).
Although overall temperature and ventilation in summer and winter at Aus3 was rated better than the benchmark and scale midpoint; survey and focus group participants raised some concerns about unexplained variations in temperatures between floors and across floor plates and in particular the tendency to be hot in summer afternoons (21% rated building as too hot in summer). Concerns were raised as to inadequate natural light compounded by a gloomy interior ambience from the dark concrete ceilings leading to the space being retrofitted with additional electric lighting in the ceiling. The open-plan layout, which was critical to unimpeded airflow, was also noted to raise concerns of noise. Notwithstanding the concerns with lighting and noise, overall comfort was rated more positively than might be expected. Break-out spaces with greenery located off the stairwell and in the form of balconies on every floor were positively received and occupants also returned positive ratings for design, needs as well as perceived productivity.
Building Ind1, New Delhi
Ind1 was designed in close consultation with the owner-occupant client to achieve a LEED Platinum rating (LEED, Citationn.d.). The building detailed elsewhere (Lall, Kapoor, & Shetty, Citation2010) incorporates naturally ventilated office floor plates protected by a series of unconditioned ‘break-out’ spaces around a sheltered courtyard, low-embodied energy materials and local construction methods designed to stabilize internal temperatures and minimize operational energy. Occupants are able to exercise a high degree of control over sun shading, daylight, natural ventilation, electric lighting and ceiling fans via a range of fenestration treatments and switching controls. The building was designed to operate in a passive mode from September to early March and envisaged an innovative two-stage hybrid AC system (Lall, 2010) with a combination of direct and indirect evaporative cooling over the dry summer (March–June), and a second stage of cooling using mechanical refrigeration for the humid monsoon months (July–August). This hybrid system was not installed due to unforeseen logistics and funding barriers and the building remained without AC over the first summer even after the client organization had moved into the building. A conventional AC system (capable of providing both heating and cooling) was then installed at the start of the monsoon season.
Unsurprisingly, the absence of active cooling in summer resulted in high internal temperatures and the worst results for overall temperature satisfaction in summer (64% dissatisfied; 45% rated conditions too hot; ). The TCS surveys () reinforce this experience (avg_ash = +1.7; avg_top = 36.2°C, 65% rate conditions as unacceptable) in a week when the seven-day running mean was 40.6°C. Although discomfort from overheating drops predictably once AC is installed in the monsoon (4%), tolerance for higher temperatures (avg_ash = –0.1; avg_top = 27.1°C), assisted by adaptive measures such as the use of ceiling fans (53% of had fans switched on during the TCS) is evident.
The TCS survey measurements provide a glimpse of the moderating influence of the building envelope in extreme summer. With no supplementary cooling on the day, indoor operative temperatures (avg_top = 36.2°C) remain around 7°K less than the maximum outdoor temperature of 43°C and in line with minimum temperature of 36°C.
Building Ind2, Gurgaon
This LEED Platinum-rated building houses multiple tenants, with a research institution as its primary owner occupant. The low energy design incorporates narrow floor plates, sheltered courtyards, appropriate fenestration and insulation to the building envelope to minimize unwanted heat gains and enable natural ventilation and access to glare-free daylight. Airflow through operable windows is aided by the stack effect within a central light well. The AC system is only operated in the periods between March and September (cooling), and December–January (heating). A carefully detailed displacement ventilation system, integrated with the structural columns and office partitions, ensures airflow paths are not impeded and concrete ceilings remain exposed to the internal space. Although changeover between modes is linked to a BMS, a highly experienced building manager onsite plays a proactive role in moderating the temperature set-points and hours of chiller operation. Arising from a detailed understanding of the building performance and user needs and behaviour, the approach takes into account opportunities for comfort that can be provided by ceiling fans (not tracked by the BMS) given time of day and season.Footnote3 The BUS results validate efforts for integrated design and comfort. Occupants reported a high satisfaction across all indoor environmental quality variables (temperature air noise and lighting) as well as design, perceived productivity and health (). The TCS survey campaigns in summer and monsoon occurred when the AC system was typically in operation. The results () corroborate the BUS scores to indicate a strong level of acceptance of thermal conditions (avg_ash ranged from –0.1 to 0.1; 5–13% rated conditions as unacceptable). Although perceived control over ventilation was rated no different to the BUS benchmark, occupants clearly made full use of ceiling fans. For example, over two-thirds of occupants had ceiling fans switched on concurrently with AC at the time of the TCS summer survey. However, on-site interviews indicated the occupants were less enthusiastic about opening windows to their office even in the mild season, citing dust and noise.
Building Ind3, Ahmedabad
This two-storey building accommodates over 200 government employees in an open-plan layout in addition to an auditorium, conference room and other functional spaces. Designed to minimize heat loads from the facade in this hot, dry climate, the thermally massive building is organized as three compact blocks to one side of a linear circulation spine. Adjoining blocks are separated by deep self-shaded light courts which offer year-round solar protection to the openable windows on these facades. Almost all occupants worked in open-plan offices where a seasonal changeover mode of operation is adopted. The spaces remain naturally ventilated for November–March, while cooling is provided via a ducted, centralized evaporative cooling system that is operated in the summer and monsoon seasons.
As seen in the BUS results (), the building recorded a high level of user dissatisfaction for summer conditions. Unlike mechanical refrigeration which can allow cooling to any supply air temperature, the cooling effectiveness of evaporative cooled systems is constrained by the humidity in the air. Consequently, the average indoor operative temperature during the TCS summer campaign remains 8°K below the maximum outdoor temperature (42°C) – at around 33.6°C. The TCS result indicating 65% of occupants were dissatisfied () was consistent across the summer season as evident in the BUS results (69% rated ‘too hot’; ). At this time, almost all users employed ceiling fans to improve their comfort and there is evidence of some users opening windows, although conditions were hotter outdoors than indoors. In contrast, occupants returned positive ratings for temperature and air in winter, lighting, noise and overall comfort, and on average registered no negative impact to perceived productivity.
Building Ind4, Ahmedabad
This eight-storey office building is typical of conventional buildings in Ahmedabad with some cognisance of the need to limit and shade glazing on all facades. The layout is designed to ensure all workstations in the open plan lie within 6–8 m from openable windows along the perimeter. Occupants are able to operate and regulate individual AC units (split, window and ceiling unit), allowing for localized changeover from AC to natural ventilation all year round.
The TCS responses show AC was being operated for 100% of occupants in summer, 74% in the monsoon and 34% in winter, and windows were not opened on the survey days. During these periods the average operative temperature was remarkably consistent ranging from 24.8 to 25.6°C with the mean ASHRAE thermal sensation votes slightly below neutral (avg_ash: –0.1 to –0.4; ) and consistent with BUS ratings where more occupants rated conditions as too cold than too hot. As seen in , the building is rated better than benchmark for temperature and air across all seasons, lighting, noise, facilities meeting needs, perceived health and perceived productivity. Of the seven buildings studied, Ind4 recorded the highest rating for control over cooling and gained positive ratings for effectiveness of response to requests for change.
Discussion
The real-world studies of building performance presented here recognize the importance of context dependency within individual buildings (Leaman, Stevenson, & Bordass, Citation2010) given the vast number of interdependencies between factors affecting performance. Such factors range from building design and construction, environmental control systems, climatic location, the extent to which design intent is achieved, how a building is used its occupants, facilities management, and occupant expectations, to organizational work practices and management. At one level, the seven separate cases in this paper provide a rich set of narratives of building performance to highlight opportunities and barriers to effective mixed-mode conditioning. However, the value of case studies (Flyvbjerg, Citation2006) is in the context-dependent knowledge it provides the discipline which is crucial for transferring knowledge to practical applications (Kirkeby, Citation2011). The discussion below presents insights from the individual exemplars in relation to the seven buildings and where applicable situates these in a wider context to observe similarities, trends or explain anomalies.
Overheating versus adaptation: expectations
shows the BUS ratings for occupant perceptions of temperature too hot/too cold in relation to the rating for overall temperature in summer. As would be expected, the extent to which occupants perceive discomfort (scores for too hot/too cold and percentage rating too hot) has a strong bearing on their overall rating of thermal comfort in summer. However, a key point of interest is the actual range of temperatures at which people in these buildings experience overheating. The diversity in the comfort scores, as well as percentage of occupants experiencing overheating in each building despite the same cooling set-point of 25°C, is noteworthy – of these three buildings, Aus1 performs the worst, while Aus2 registers the least discomfort. Admittedly there is no monitored evidence to show to what extent temperatures were riding about the intended limit in Aus1. However, the strategy first to tighten the set-points to 20–24°C is telling especially as other operational faults highlighted above could have been addressed first. This response highlights the manner in which preference for stable temperatures is continually reinforced (Chappells & Shove, Citation2005), especially in the light of research (Arens, Humphreys, de Dear, & Zhang, Citation2010) showing no perceptible benefits to comfort despite the increased energy to maintain temperatures within prescribed limits.
Figure 2. Scatter plot showing BUS ratings for ‘temperature in summer hot/cold’ versus ‘temperature in summer overall’.
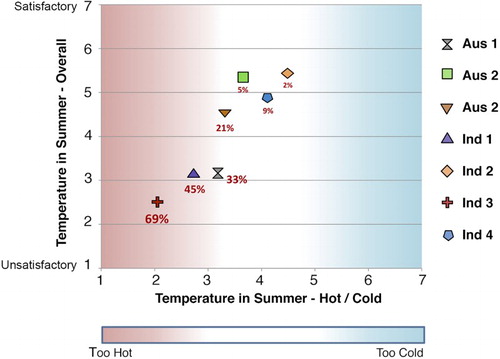
A second point of interest is the divergent level of acceptability of thermal conditions between Australian and Indian context. As noted above, the indoor temperatures in the Australian study buildings were modulated to a cooling set-point that is more conservative (lower) than would have been permissible under the ASHRAE adaptive model. Nevertheless as seen in and , these Australian buildings register similar or higher levels of dissatisfaction (scores for temperature in summer overall) and discomfort (percentage of occupants who are ‘too hot’) when compared with Indian study buildings which operated at higher temperatures.
Surveyed occupants in the Indian study buildings who undertake professional, administrative and technical work in contemporary and well-appointed workplaces are consistently found to tolerate well over 27°C in these buildings. This is evident in the neutral temperature calculations (), and the adaptive thermal comfort models for mixed-mode buildings reported elsewhere (Manu et al., Citation2016). Furthermore, a greater tolerance of warmer temperatures is evident even when conditions are deemed unacceptable. shows that the ratings of the actual thermal sensation (avg_ash) are consistently reported as cooler than would have been predicted using the PMV-PPD (predicted percentage dissatisfied) model (avg_pmv).
Ind1–Ind3 are three cases that include a seasonal changeover mode where the AC system is intentionally switched off in the mild season to defy the aforementioned trend to develop workplaces with year-round AC (Cox, Citation2012; Ürge-Vorsatz et al., Citation2015). It is noteworthy that both building operators and occupants tacitly accept that some level of discomfort could occur from overheating during the mild season when the AC is not employed. However, although this works well in Ind2, the study also demonstrates that a consistent occurrence of temperatures outside their comfort expectations is not accepted by occupants. The overheating, as seen in the summer outcomes for Ind1 and Ind3, highlights problems that will arise from a failure to realize properly the cooling strategy. For Ind1 this was a consequence of budgetary constraints, and for Ind3 this was the inability of the evaporative cooling system to maintain temperatures within an acceptable range during the extreme summer months.
The comfort expectations of the users and thermal set-points play a key role in influencing the extent to which the building operates in either active or passive mode. It would appear that a preference for lower temperatures, which is well entrenched in fully AC buildings in the Western context, serves to influence the fairly conservative set-points in the Australian study buildings. However, if occupants were to accept the warmer conditions, then from a technical perspective this would require effective thermal comfort criteria to govern a seamless changeover between modes for naturally ventilated and AC modes. This would also entail a carefully designed environmental control strategy comprising either simple robust controls that users can operate or a carefully integrated BMS with added opportunity for personalized control of airflow and temperature. Furthermore, it is necessary to recognize where opportunities and barriers to integrating adaptive opportunities and managing buildings lie. This is discussed below.
Cost of comfort: energy
The possibility of users tolerating an alternate temperature range beyond the stipulation of 22.5 ± 1.5°C for premium-grade buildings in both Australia and India brings potential energy savings when running the AC mode under different temperature regimes. shows simulation results (using EnergyPlus) for a five-zone building model under different set-points in Sydney, Melbourne, Delhi and Ahmedabad. The building envelope and internal load schedules are set to comply with local building energy codes, namely Energy Conservation Building Code – ECBC (Bureau of Energy Efficiency – India, Citation2009) and Building Code of Australia (Australian Building Codes Board, Citation2016). For simplicity, heating and cooling set-points were held constant throughout the year. Cooling set-points were tested from 22 to 28°C in 1°C increments. Given the emphasis on overheating in this paper, the discussion below focuses on the impact of varying the cooling set-point on an equator-facing perimeter mid-level zone.
Figure 3. Predicted cooling energy at different cooling set-points for Sydney and Melbourne (north) and Delhi and Ahmedabad (south).
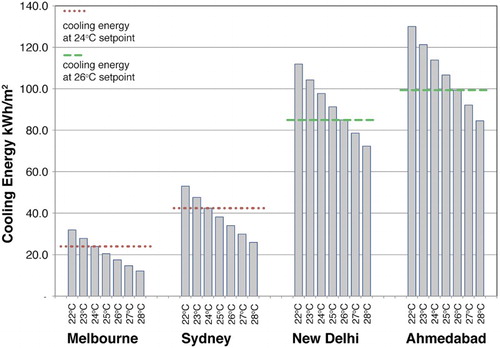
The results show the amount of energy for cooling decreases by roughly 10–15% for every degree rise in the set-point temperature in the Australian cities and 6–8% in Indian cities studied. The shift from the widely accepted baseline of 24°C for Sydney and Melbourne and 26°C for Delhi and Ahmedabad is worth noting. In the case of Melbourne, it clearly shows savings of 15% and 27% of the cooling energy at 24°C if the set-point was raised to 25 and 26°C. The results for Ahmedabad show a 15% reduction in energy if the set-point was raised from 26 to 28°C. More importantly, if the set-point was lowered to match Western workplaces at 24 or even 23°C in Ahmedabad, cooling energy would increase by around 15–23% with reference to the energy at 26°C. The magnitude of such a shift is a considerable concern, given that the cooling energy for an office in Ahmedabad is at least three times the energy for an office in a benign climate such as Melbourne. In this respect, the results highlight the stark choice that building development in India faces between year-round AC operated under a 22.5 ± 1°C regime and a mixed mode of operation governed by the adaptive model of thermal comfort.
Control and effectiveness of response to requests for change
(a) explores the relationship between ratings for control over cooling and temperature in summer overall, while (b) explores how effectiveness of response to requests for change might impact the rating for temperature in summer overall. Although there is no clear trend across the buildings in the BUS 2012 International benchmark dataset, the context-specific stories of the individual POEs helps to situate an understanding of where this matters.
Figure 4. Scatterplots showing the relationship between ratings for (a) perceived control over cooling and (b) effectiveness of response with ratings for temperature in summer overall.
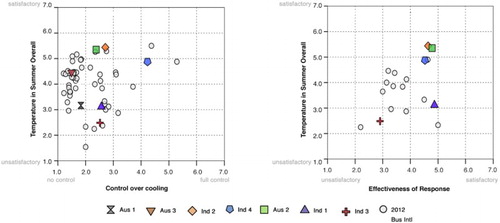
Low scores for perceived control as seen in Aus1 are consistent with poor performance and low ratings for thermal comfort in . On the other hand, a high perception of control over cooling and satisfaction with effectiveness of response to requests for change at Ind4 ((a, b)) appears to reinforce the positive scores for thermal comfort in summer in this building. These results suggest a potential risk to occupant satisfaction when occupants perceive very little control or adaptive opportunity especially when problems are not rectified quickly. However, it is vital to note that the question of user control becomes less important when things work well. As seen in Aus2 and Ind2, thermal comfort scores do not seem to be affected by the limited user control over cooling in this building ((a)). On the other hand, a proactive and user-responsive approach to building management is seen in both buildings. This approach is corroborated in the high occupant ratings for effectiveness of responses to requests for change and can be argued to play an important role in delivering user satisfaction for thermal comfort ((b)).
While all the study buildings can be defined as mixed-mode buildings, they exhibit a range of approaches in relation to the question of control and strategies for combating overheating. The ‘passive building–active occupant’ framework (Cole et al., Citation2008) is evident to some extent at the Indian study buildings where occupants were able to open windows and use ceiling fans (Ind1–Ind3), or personally initiate the use of localized AC units to combat overheating (Ind4). The Australian buildings operate largely at the other end of the spectrum in an ‘active building–passive occupant’ framework (Cole et al., Citation2008) and rely on the active forms of control via a BMS to control the dynamic changeover from passive to active mode, and vice versa. As seen in these buildings, it is important to note that occupants are likely to perceive limited control. This can, in turn, alter their expectations and tolerance of discomfort as evident in Aus1. In this context Aus2 and Aus3 highlight models of user-responsive building management that must accompany such buildings. Ind2 lies midway between the two approaches discussed above with active systems modulating temperature conditions for most of the summer and monsoon coupled with free-running passive operation in winter and the mild season, a high level of adaptive opportunities afforded to occupants and a proactive onsite user manager. Significantly, its design and operation already incorporate aspects recognized to enhance thermal experiences such as a shift to personal control, adequate air movement and user responsive design (Brager, Zhang, & Arens, Citation2015; Leaman & Bordass, Citation1999). As seen in Aus2 and Ind2, the best outcomes for thermal comfort are achieved when building designs and environmental control systems are robust enough to manage overheating and deliver comfort, cope with some errors in operation or includes occupants who are willing to play a proactive role and understand the design intent.
Forgiveness, overall comfort and perceived productivity
The scatterplots in situate the study buildings in the context of the buildings in the BUS International dataset (and including the seven study buildings). (a, b) (comprising all the buildings in the BUS 2012 International benchmark dataset) illustrates the role thermal comfort in summer plays in ratings for overall comfort and perceived productivity. The regressions for the whole set indicate a significant relationship between occupant responses for temperature in summer and comfort overall (r = 0.72); and temperature in summer and perceived productivity (r = 0.75), confirming the strong associations between these aspects in other studies (Kim & de Dear, Citation2012; Leaman, Thomas, & Vandenberg, Citation2007). Although the poor ratings for thermal comfort in summer in Ind1 and Ind3 could have been expected to negatively impact ratings for overall comfort and perceived productivity, this is not the case in (a, b). Interestingly, they appear furthest from the trend line and are discussed further below.
Figure 5. Statistical correlation showing the strength of the relationship between ratings for (a) temperature in summer overall and comfort overall, (b) temperature in summer overall and perceived productivity, (c) comfort overall and perceived productivity, and (d) comfort overall and perceived health. (a–d) show the study buildings in the context of the wider BUS dataset. The regression line is for the whole set.
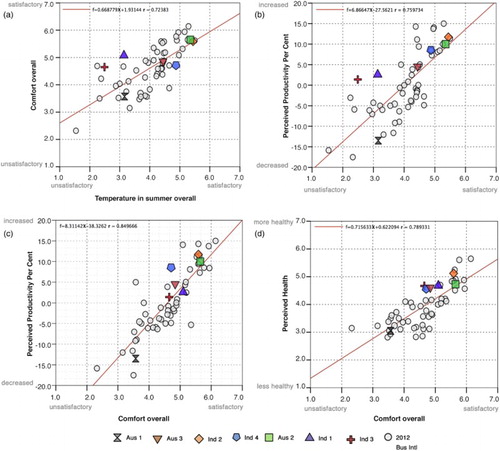
Ind1 is one of the three buildings that demonstrate a level of forgiveness or tolerance (1.1 in ) where the rating of overall comfort is greater that what would have been predicted from their separate scores for temperature, air, lighting and noise. The high occupant satisfaction with lighting, daylight, noise, control over lighting and ventilation, design, and work facilities as seen in suggest that a number of positive features in the overall design attributes such as access to daylight and transitional ‘break-out’ spaces, a high degree of personal control, and a layout that facilitates work are well received by occupants. Furthermore, it could be argued that their positive experience of these aspects seems to outweigh their low rating for temperature as seen in the ratings for overall comfort, design perceived productivity and perceived health.
At Ind3, the BUS ratings for lighting, noise, and air and temperature in winter are better than benchmarks (). Satisfaction with these aspects seems to buoy occupant ratings for overall comfort and perceived productivity. Additionally, in the case of Aus2 and Aus3, the positive outcomes for overall comfort despite poor scores for temperatures in winter (Aus2) and lighting and noise (Aus 3) also support the notion of forgiveness, that ‘although they [users] may have detailed criticisms about some of the conditions, they are prepared to overlook them’ (Leaman et al., Citation2007, p.28).
The scatterplots in (c, d) comprising all the buildings in the BUS 2012 International benchmark dataset (and including the seven study buildings) depict the strong associations between overall comfort and perceived productivity (r = 0.85); and overall comfort and perceived health (r = 0.78). As seen, there is a close proximity of almost all the study buildings to the line of best fit. The two buildings at the top end (Aus2 and Ind2) for comfort and perceived productivity clearly demonstrate an almost ‘textbook’ performance by gaining high satisfaction scores for nearly all other variables. Users in Aus2, Aus3, Ind1 and Ind2 register strong satisfaction with design, and how well the building meets ones needs. These results reiterate the fundamental requirement for a building to satisfy its functional role, as well as the likelihood that a number of desirable attributes (such as interesting spaces, daylight, access to fresh air and views) will reinforce one another in a virtuous circle in a well-designed building.
Integrated environmental design and operation
A climate-responsive approach to building design, supported by committed clients and a skilled design team, is a critical first step to ensuring low-energy outcomes. The Indian study buildings demonstrate sensitivity to heat gain from the facade through shading and low window-to-wall ratios, while also emphasizing local materials and skills. This is in stark contrast to another recent trend in the subcontinent where buildings are designed with extensive glazed facades (Mukhopadhyay & Revi, Citation2012) that would entail high-performance glazing to combat the overheating problems they would create. Five of the study buildings (Aus1–Aus3, Ind1 and Ind2) also go beyond the basic application of passive design principles to achieve a tectonic or seamless integration of architectural and structural elements that serve an environmental role.
The efficiency of the building fabric and design is borne out in the actual energy-efficiency performance ratings for the Australian buildings with all three buildings performing at least 28% better than the industry average buildings for their cities. The climate-responsive design in Ind1 and Ind3 (the latter supplemented by evaporative cooling) can be credited for moderating average indoor operative temperatures around 8–10°K below the 42–43°C peaks for summer. Nonetheless, the recorded discomfort reinforces the importance of mitigating the residual discomfort from overheating in these workspaces using some form of supplementary cooling.
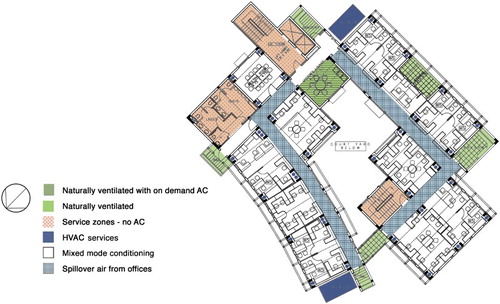
While highly detailed personal comfort systems are researched and critiqued as to how they ameliorate conditions (Boerstra et al., Citation2015; Zhang, Arens, & Zhai, Citation2015), this paper would argue for an alternate approach that goes beyond expectations for the ‘perfect set’ of thermal conditions. This approach rests in reinstating spatial and temporal diversity in buildings (Hawkes, McDonald & Steemers, Citation2001; Heschong, Citation1979) through the pursuit (and good design) of more climate-interactive spaces as opposed to climate-rejecting ones. Aus3 and Ind1 point to some interesting opportunities. and highlight zones of environmental control in the layout plans in these buildings. Aus3 () is indicative of the beginning of a new trend (Drake, de Dear, Alessi, & Deuble, Citation2010) where a small percentage of the floor area is devoted to break-out spaces that can be isolated from the central AC. A much more nuanced spatial hierarchy for climate control is evident in Ind1 () which challenges the traditional approach of maintaining standardized conditions across all areas of the floor plate at all times. Naturally ventilated corridors are tempered with ‘spill air’ when the offices are conditioned to enable a gradual transition to other naturally ventilated break-out spaces and meeting areas that can separately rely on supplementary cooling when the need arises. As new forms of ‘activity-based working’ are promoted, a higher percentage of the floor area is being devoted to break-out café-style work environments and flexible zones. It can be argued that many of these new functional spaces have less stringent environmental requirements, and would benefit from fresh air, enhanced air speed, daylight and connection to the outdoors, thereby lending themselves to a climate-interactive, mixed mode of operation. In these types of workspaces where occupants are also encouraged to change location based on their activities, the potential for behavioural adaptation can also be increased.
Figure 6. Layout plan showing zones of environmental control for Aus3.
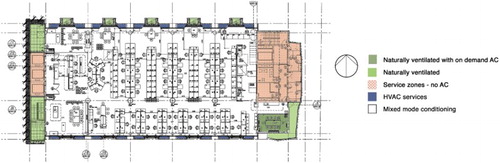
Figure 7. Layout plan showing zones of environmental control for Ind1.
Conclusions
This paper emphasizes the context specificity of a building and its environment as experienced by its users to offer a nuanced understanding of overheating. It reinforces the strong associations between thermal comfort, overall comfort and perceived productivity in the workspace. The comparative examination of the seven mixed-mode buildings in India and Australia demonstrates that while overheating can detrimentally affect occupant satisfaction for thermal comfort, it is possible to deliver thermally efficient workspaces that satisfy the requirements of comfort using effective mixed-mode conditioning. This climate-interactive approach is in contrast to an energy-intensive approach that ignores the climate and relies upon the use of AC throughout the year. Of the mixed-mode buildings studied, those using effective AC only when and where necessary yielded thermal conditions that led to the highest comfort assessments and greater perceived productivity.
The success of mixed-mode buildings is contingent on a number of factors. First, the study emphasizes the importance of an integrated approach to the design, development and operation of the building fabric and systems to ensure the design intent is realized and overheating is mitigated. Second, it calls for a proactive user-responsive approach to the operation of the building where users understand design intent, and monitoring and feedback loops exist to rectify problems. This is particularly critical in active controlled buildings where users exercise little control or perceive limited adaptive opportunities. On the other hand, the findings from three of the buildings in this study suggest occupants can be more forgiving of some discomfort from overheating in situations where other aspects ‘work well’ and they enjoy an adaptive environment which includes climate-interactive features such as daylight and increased airflow.
The study also revealed a divergent level of acceptability of thermal conditions between the Australian and Indian contexts. The Australian mixed-mode buildings were operated within temperature limits more conservative (lower) than would have been permissible under the ASHRAE-55 adaptive model of thermal comfort. However, occupants in these buildings registered dissatisfaction with thermal conditions especially where they perceived the lack of user responsive management of the thermal environment.
Preference for a narrow band of temperatures as well as a lack of information on the risks this creates for performance can serve to constrain the uptake of mixed-mode buildings. In this context, encouraging occupants and developers out of the highly controlled and homogenous thermal environment they have come to expect will require a multipronged approach beyond merely stipulating mixed-mode conditioning. As discussed, this could include adoption of appropriate comfort criteria and a user-responsive approach to manage the changeover between modes as well as a climate-interactive approach to spatial and temporal diversity.
Occupants in the Indian study buildings tolerated warmer temperatures, consistent with an adaptable model of comfort (Manu et al., Citation2016) that was previously shown to be more adaptive than predicted under ASHRAE-55. Significantly, the potential for effectively designed mixed-mode conditioning to deliver comfort as seen in this study, coupled with the tolerance of higher temperatures, question the pursuit of a climate-rejecting year-long AC approach. Addressing this issue is urgent, given that workplaces conditioned to lower temperature together with the projected increase of built floor space will only exacerbate the dependence on fossil-based energy in these warmer climatic locations.
Acknowledgments
The collation of data for the detailed analysis of the seven buildings presented in this paper would not have been possible without the generous support of a number of individuals and organizations. The support received from key personnel in each of the buildings to facilitate the study as well as the generous participation by individual owners, designers, owners, facilities management staff and occupants at each building is gratefully acknowledged. Each of the POE studies used the BUS questionnaire under licence from Building Use Studies, UK. The assistance from Adrian Leaman of Building Use Studies during these studies and in generating the scatterplots for and to include the buildings in the BUS international benchmark dataset is acknowledged. The author would like to acknowledge fellow investigators, namely Monica Vandenberg (Aus2 and Aus 3) and Adrian Leaman (Aus 3), for their permission to use data collated to evaluate design performance in the Australian buildings. The author acknowledges IMAC collaborators Sanyogita Manu, Yash Shukla, Rajan Rawal and Richard de Dear for their permission to use the data collated towards the IMAC study for the Indian buildings in this paper (Ind1–Ind4). Thanks are also due to the team of CEPT University research assistants who assisted with survey administration in these Indian buildings.
Disclosure statement
As acknowledged, the paper draws on IMAC study data.
ORCID
Leena E. Thomas http://orcid.org/0000-0003-0707-9260
Additional information
Funding
Notes
1. Neutral temperature is based on the ASHRAE-55 adaptable model = 0.31*outdoor temperature + 17.8, where neutral temperature is the indoor operative temperature (°C), and outdoor temperature is the 30-day outdoor running mean air temperature (°C), with a ± 2.5°C range for 90% acceptability and ± 3.5°K for 80%. Neutral temperature for summer was computed assuming a 22.3°C outdoor temperature for Sydney and 20.2°C for Melbourne based on statistics from the Bureau of Meteorology for January. For 90% acceptability, the limits for Sydney and Melbourne would be 26.5 and 25.8°C respectively, and for 80% acceptability they would be 28.2 and 26.8°C respectively.
2. The National Australian Building Environmental Rating Scheme (NABERS, Citation2014) energy rating system (formerly ABGR – Australian Building Greenhouse Rating) is a protocol for benchmarking actual energy performance and CO2-equivalent emissions post-occupancy. Since it was introduced in 1999, buildings have been benchmarked on a scale of 0 to 5 Stars, with 5.5- and 6-Star rating bands introduced in 2012. A whole building rating at a 5-Star NABERS level for office buildings indicates a 47% CO2 reduction in comparison with the industry average at 2.5 Stars, while 4.5- and 4-Star ratings deliver 37% and 28% respectively. The whole building energy rating is based on the total energy consumed in the office building. In 2002, no building as large as Aus1 had realized the top 5-Star rating achievable at the time.
3. For example, the site visit revealed that the building manager typically operated the chiller between 09:30 and 16:00 hours in summer, whereas the office hours ran from 08:30 to 17:30 hours. This approach took into account the relatively cooler hours of the morning and the coolth within the building at the end of the day when the ceiling fans could be employed by the occupants as needed.
References
- Ackermann, M. E. (2002). Cool comfort: America’s romance with air conditioning. Washington, DC: Smithsonian Institution Press.
- ANSI/ASHRAE. (2013). Standard 55–2013: Thermal environmental conditions for human occupancy. Atlanta, GA: American Society of Heating, Refrigerating, and Air-Conditioning Engineers, Inc.
- Arens, E., Humphreys, M., de Dear, R., & Zhang, H. (2010). Are ‘Class A’ temperature requirements realistic or desirable? Building and Environment, 45, 4–10. doi:10.1016/j.buildenv.2009.03.014
- Australian Building Codes Board [ABCB]. (2016). Section J: Energy efficiency. In Building code of Australia 2016 (Vol. 1, pp. 387–485). Canberra: Australian Building Codes Board.
- Bansal, N. K., & Minke, G. (Eds.). (1995). Climatic zones and rural housing in India. Jülich: Forschungszentrum Jülich GmbH, Zentralbibliothek.
- Boerstra, A. C., te Kulve, M., Toftum, J., Loomans, M. G. L. C., Olesen, B. W., & Hensen, J. L. M. (2015). Comfort and performance impact of personal control over thermal environment in summer: Results from a laboratory study. Building and Environment, 87, 315–326. doi:10.1016/j.buildenv.2014.12.022
- Bordass, W., Leaman, A., & Ruyssevelt, P. (2001). Assessing building performance in use 5: Conclusions and implications. Building Research & Information, 29(2), 144–157. doi:10.1080/09613210010008054
- Brager, G. S. (2000). Mixed mode ventilation: HVAC meets mother nature. Engineered Systems, 17(5), 60–70.
- Brager, G. S. (2006). Mixed mode cooling. ASHRAE Journal, 48(8), 30–37.
- Brager, G. S., Zhang, H., & Arens, E. (2015). Evolving opportunities for providing thermal comfort. Building Research & Information, 43(3), 274–287. doi:10.1080/09613218.2015.993536
- Bureau of Energy Efficiency – India. (2009). Energy conservation building code user guide. New Delhi: Government of India.
- Candido, C., Kim, J., de Dear, R., & Thomas, L. (2016). BOSSA: A multidimensional post-occupancy evaluation tool. Building Research & Information, 44(2), 214–228. doi:10.1080/09613218.2015.1072298
- Chappells, H., & Shove, E. (2005). Debating the future of comfort: Environmental sustainability, energy consumption and the indoor environment. Building Research & Information, 33(1), 32–40. doi:10.1080/0961321042000322762
- Chartered Institution of Building Services Engineers (CIBSE). (2000). Guide A: Environmental design (7th ed.). London: CIBSE.
- Cole, R. J., Robinson, J., Brown, Z., & O’Shea, M. (2008). Re-contextualizing the notion of comfort. Building Research & Information, 36(4), 323–336. doi:10.1080/09613210802076328
- CEN (Comité Européen de Normalisation). (2012). EN 15251: Indoor environmental input parameters for design and assessment of energy performance of buildings – addressing indoor air quality, thermal environment, lighting and acoustics. Brussels: CEN.
- Cox S. (2012). Losing our cool – Uncomfortable truths about our air-conditioned world. New York: New Press.
- de Dear, R., & Brager, G. (1998). Developing an adaptive model of thermal comfort and preference. ASHRAE Transactions, 104(1), 27–49.
- Drake, S., de Dear, R., Alessi, A., & Deuble, M. (2010). Occupant comfort in naturally ventilated and mixed-mode spaces within air-conditioned offices. Architectural Science Review, 53(3), 297–306. doi:10.3763/asre.2010.0021
- EnergyPlus (8.4.0) [Computer software]. Golden, CO: NREL.
- Fanger, P. O. (1970). Thermal comfort. Copenhagen: Danish Technical Press.
- Flyvbjerg, B. (2006). Five misunderstandings about case-study research. Qualitative Inquiry, 12(2), 219–245. doi: 10.1177/1077800405284363
- GBCA (Green Building Council of Australia). (2014). Green Star Rating Tools. Retrieved June 7, 2014, from http://www.gbca.org.au/green-star/green-star-design-as-built/
- Hawkes, D., McDonald, J., & Steemers, K. (2001). The selective environment. London: Taylor & Francis.
- Heschong, L. (1979). Thermal delight in architecture, Cambridge, MA: MIT Press.
- Hoogland, M., & Bannister, P. (2014). Council house 2 (CH2) in review. EcoLibrium(R), 13(10), 44–50.
- Humphreys, M. A. (1978). Outdoor temperatures and comfort indoors. Building Research and Practice, 6(2), 92–105. doi: 10.1080/09613217808550656
- Kim, J., & de Dear, R. (2012). Nonlinear relationships between individual IEQ factors and overall workspace satisfaction. Building and Environment, 49, 33–40. doi:10.1016/j.buildenv.2011.09.022
- Kirkeby, I. M. (2011). Transferable knowledge: An interview with Bent Flyvbjerg. Architectural Research Quarterly, 15(1), 9–14. doi:10.1017/S1359135511000315
- Kumar, S., Kapoor, R., Deshmukh, A., Kamath, M., & Manu, S. (2010). Total commercial floor space estimates for India, New Delhi. Retrieved from http://www.eco3.org/total-commercial-floor-space-estimates-for-india-report-no-1030/.
- Lall, A. B., Kapoor, N., & Shetty, S. (2010). Analyzing design issues for hybrid system buildings for India. Proceedings of conference: 2010 Windsor Conference: Adapting to Change: New Thinking on Comfort, Windsor, UK, 9–11 April.
- Landsberger, H. A. (1958). Hawthorne revisited. Ithaca, NY: Cornell University.
- Leaman, A., & Bordass, W. (1999). Productivity in buildings: The ‘killer’ variables. Building Research & Information, 27(1), 4–19. doi:10.1080/096132199369615
- Leaman, A., & Bordass, W. (2001). Assessing building performance in use for the PROBE occupant surveys and their implications. Building Research & Information, 92, 129–143. doi:10.1080/09613210010008045
- Leaman, A., & Bordass, W. (2007) Are users more tolerant of ‘green’ buildings? Building Research & Information, 35, 662–673. doi:10.1080/09613210701529518
- Leaman, A., Stevenson, F., & Bordass, B. (2010). Building evaluation: Practice and principles. Building Research & Information, 38(5), 564–577. doi:10.1080/09613218.2010.495217
- Leaman, A., Thomas, L. E., & Vandenberg, M. (2007). ‘Green’ buildings: What Australian users are saying. EcoLibrium(R), 6(10), 22–30.
- LEED. (n.d.). The Leadership in Energy and Environmental Design Green Building Rating System™. Retrieved from http://www.usgbc.org/DisplayPage.aspx?CategoryID=19
- Manu, S., Shukla, Y., Rawal, R., Thomas, L. E., & de Dear, R. (2016). Field studies of thermal comfort across multiple climate zones for the subcontinent: India model for adaptive comfort (IMAC). Building and Environment, 98(March), 55–70. doi:10.1016/j.buildenv.2015.12.019
- Mukhopadhyay, P., & Revi, A. (2012). Climate change and urbanisation in India. In N. K. Dubash (Ed.), Handbook of climate change and India: Development, politics, and governance (pp. 303–316). Abingdon: Earthscan.
- National Australian Building Environmental Rating Scheme [NABERS] Office. (2014). NABERS. Retrieved from http://www.nabers.gov.au/
- Nicol, J. F., & Humphreys, M. A. (2010). Derivation of the adaptive equations for thermal comfort in free-running buildings in European standard EN15251. Building and Environment, 45, 11–17. doi:10.1016/j.buildenv.2008.12.013
- Nicol, J. F., Raja, I. A., Allaudin, A., & Jamy, G. N. (1999). Climatic variations in comfortable temperatures: The Pakistan projects. Energy and Buildings, 30, 261–279. doi:10.1016/S0378-7788(99)00011-0
- Rowe, D. (2003). Study of a mixed mode environment in 25 cellular offices at the University of Sydney. International Journal of Ventilation, 1(4), 53–64. doi:10.1080/14733315.2003.11683644
- Sivak, M. (2009). Potential energy demand for cooling in the 50 largest metropolitan areas of the world: Implications for developing countries. Energy Policy, 37, 1382–1384. doi:10.1016/j.enpol.2008.11.031
- Sullivan, J., Baird, G., & Donn, M. (2013). Measuring productivity in the office workplace. Final report. Centre for Building Performance Research, Victoria University of Wellington, New Zealand. Retrieved from https://www.msd.govt.nz/documents/about-msd-and-our-work/about-msd/structure/pmcoe/publications/measuring-productivity-in-the-office-workplace.docx
- Tan, S.-F. (2007). Practice. Architecture Australia, 91(1). Retrieved from http://architectureau.com/articles/practice-15/
- Thomas, L. E., & Hall, M. R. (2004). Implementing ESD in architectural practice – an investigation of effective design strategies and environmental outcomes. Passive and low energy architecture (PLEA) annual international conference – 2014, 415–420. Eindhoven: Technische Universiteit Eindhoven.
- Thomas, L. E., & Thomas, P. (2010). Unravelling the mix – Towards effective simulation, implementation and operation of mixed mode buildings. Proceedings of conference: Adapting to change: New thinking on comfort, 1–16. Windsor, UK: Windsor Conference on Thermal Comfort, Network for Comfort and Energy Use in Buildings (NCEUB).
- Thomas, L. E., & Vandenberg, M. (2007). 40 Albert Road, South Melbourne: Designing for sustainable outcomes – A review of design strategies, building performance and users’ perspectives. BEDP Environment Design Guide, 13(3), CAS45, 1–12.
- Ürge-Vorsatz, D., Cabeza, L. F., Serrano, S., Barreneche, C., & Petrichenko, K. (2015). Heating and cooling energy trends and drivers in buildings. Renewable and Sustainable Energy Reviews, 41, 85–98. doi:10.1016/j.rser.2014.08.039
- Vischer, J. C. (2007). The effects of the physical environment on job performance: Towards a theoretical model of workspace stress. Stress and Health, 23(3), 175–184. doi:10.1002/smi.1134
- Wyon, D. P. (2004). The effects of indoor air quality on performance and productivity. Indoor Air, 14(7), 92–101. doi:10.1111/j.1600-0668.2004.00278.x
- Zhang, H., Arens, E., & Zhai, Y. (2015). A review of the corrective power of personal comfort systems in non-neutral ambient environments. Building and Environment, 91, 15–41. doi:10.1016/j.buildenv.2015.03.013