
ABSTRACT
The United Nations’ (UN) sustainable development goals (SDGs), the core of the 2030 Agenda for Sustainable Development and the UN Paris Agreement, were adopted in 2015. Involvement of not only national governments but also all other stakeholders including local governments is important to promote sustainable development and to achieve the goals. The question arises, therefore, of what methods should be used to best implement and assess sustainability issues at a local level. In this light, a new version of Comprehensive Assessment System for Built Environment Efficiency (CASBEE), CASBEE for Cities, is introduced for assessing the sustainability of cities and communities around the world based on SDG indicators and greenhouse gas (GHG) emissions. The tool allows users to understand the sustainability of cities and communities based on quality (Q) and environmental load (L) perspectives. The sustainability assessments show that cities in developed countries tend to have good grades for Q, but bad grades for L, while cities in developing countries tend to have the opposite trend. This will assist cities and communities in both developed and developing countries to understand urgent problems and to identify effective solutions for sustainable development.
Introduction
The year 2015 contained significant political agreements for the future of sustainable development. United Nations’ (UN) member states adopted the 2030 Agenda, during the 70th session of the UN General Assembly (United Nations, Citation2015). This includes 17 aspirational goals and 169 concrete targets, officially referred to as the sustainable development goals (SDGs). The Paris Agreement was adopted during the 21st session of the Conference of the Parties to the United Nations Framework Convention on Climate Change (UNFCCC-COP 21) (United Nations Framework Convention on Climate Change, Citation2015). The former is a universal goal with integrated objectives for sustainable development and the latter is a universal agreement to address climate change. The New Urban Agenda: Quito Declaration on Sustainable Cities and Human Settlements for All was adopted in October 2016 at the UN’s Habitat III conference, taking full account of the milestone achievements of 2015 (United Nations Conference on Housing and Sustainable Urban Development (Habitat III), Citation2016). Although these international frameworks have been adopted by national governments, they require local governments, citizens, businesses, non-profit organizations (NPOs)/non-governmental organizations (NGOs) and all other stakeholders to be involved and engage in sustainable development.
A substantial amount of implementation and monitoring will occur in cities and communities. Thus, local government authorities and communities are likely to have a large responsibility in promoting sustainable development (ICLEI Local Governments for Sustainability, Citation2015). Local governments are well situated between national governments and citizens. Therefore, local governments are expected to play a major role in two ways: contributing to national strategies and simultaneously addressing local problems. Owing to these substantial roles of local governments, many organizations are now starting to provide support by introducing information to address challenges. For example, ICLEI Local Governments for Sustainability (hereafter ‘ICLEI’) published briefing sheet documents and the United Cities and Local Governments (UCLG) produced a publication introducing SDGs (ICLEI, Citation2015; UCLG, Citation2015). The Global Taskforce of Local and Regional Governments published the ‘Roadmap for Localizing the SDGs: Implementation and Monitoring at Subnational Level’ together with UN-Habitat and the UN Development Programme (UNDP), emphasizing the importance of localizing SDGs (Global Taskforce of Local and Regional Governments, UN-Habitat and UNDP, Citation2016). The Sustainable Development Solutions Network (SDSN) published a guide for stakeholders titled Getting Started with the SDGs in Cities (SDSN, Citation2016). Many other information sources and guidelines have been developed for local governments to support their own activities and initiatives.
It is important for local governments to understand their current conditions and to identify problems that require urgent solutions. The concept of ‘think globally, act locally’ is said to be important, and translating global initiatives into local actions is required. To initiate actions at the local level, monitoring is one of the most important processes. Understanding current conditions and progress toward goals is vital for sustainable development, as it is otherwise impossible to implement appropriate and effective policies and actions. The main objective of this paper is to introduce a method for assessing and monitoring the sustainability of cities and communities around the world based on SDG indicators and greenhouse gas (GHG) emissions. Existing methods and tools for city assessment are first briefly introduced.
Existing city assessment methods and tools
Many methods and tools have been proposed and developed for assessing the sustainability of buildings, neighbourhoods and cities. This paper does not provide an exhaustive introduction of these methods and tools because a comprehensive review of previous studies is not within its scope. For a discussion of sustainable indicators, see previous research papers (Holman, Citation2009; Joss et al., Citation2015) and technical reports issued by the International Organization for Standardization (ISO) (Citation2014a; ISO, Citation2017). Rather, this paper summarizes the current circumstances regarding city assessment, monitoring and management.
The World Resources Institute (WRI), C40 Cities Climate Leadership Group (C40 Cities) and ICLEI have collaboratively developed a GHG accounting protocol for cities and communities, commonly known as the Global Protocol for Community-Scale Greenhouse Gas Emission Inventories (GPC), to guide local governments in quantifying GHG emissions from activities that take place within their local jurisdiction in order to address climate change issues (WRI, C40 Cities and ICLEI, Citation2014). Local governments are now able to estimate their GHG emissions by referring to the methodology of GPC and to monitor their progress toward GHG mitigation goals.
The Inter-Agency and Expert Group on SDG Indicators (IAEG-SDGs) has proposed approximately 230 indicators to support the efforts of stakeholders to monitor global progress of SDGs (IAEG-SDGs, Citation2016). However, these indicators are aimed at monitoring progress of SDGs at a global level and thus include some that are of no practical use for monitoring progress at a local level. These indicators should be modified or alternative indicators must be proposed to monitor the efforts of local governments and achievements of SDGs. Comprehensive sets of indicators to assess cities have been developed, such as those developed by Murakami et al. (Citation2011), Bourdic, Salat, and Nowacki (Citation2012) and STAR Communities (Citation2016). However, an assessment method to monitor the progress of SDGs and the Paris Agreement at the local level is still lacking; such a method would support local initiatives and activities in cities, urban areas and rural areas.
Method: development of a city assessment method for cities worldwide
Basic framework for a city assessment method
A method that enables all stakeholders to assess cities and communities based on SDG indicators and GHG emissions, namely, CASBEE for Cities (worldwide-use version; hereafter, ‘CASBEE-City’), was developed. CASBEE was originally developed to assess the environmental performance of individual buildings; the assessment scope was subsequently widened to the urban development scale in 2006 and to the city scale in 2011. Other assessment systems, such as the BRE Environmental Assessment Method (BREEAM) in the UK and the Leadership in Energy and Environmental Design (LEED) system in the US, were also initially developed for assessing buildings before widening in scope based on the experience with individual building assessment (Cole, Brown, & Mckay, Citation2010).
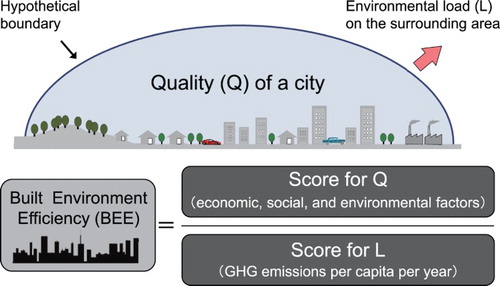
CASBEE-City is an assessment method specifically developed to assess cities and all other forms of communities (hereafter referred to as just cities). The assessment framework is summarized in . Assessment using CASBEE-City is conducted at the city level, within its specific administrative boundary. A hypothetical boundary is set around the city to define clearly the assessment target. CASBEE-City enables users to understand comprehensively target cities from the following two aspects: quality (Q), comprising economic, social, environmental and quality activities, and load (L), representing environmental load.
Figure 1. Comprehensive Assessment System for Built Environment Efficiency (CASBEE)-City assessment framework.
Sustainability assessment of a city
A higher Q score and a lower L score are associated with a higher built environment efficiency (BEE = Q/L) value, which indicates that a city has an excellent environmental efficiency and is relatively sustainable in comparison with other cities within the CASBEE-City assessment methodology (Murakami, Iwamura, & Cole, Citation2014). Cole (Citation2005) mentioned that this assessment structure, which explicitly distinguishes Q and L, goes beyond a simple additive model of achievements in all performance areas to derive an overall score, which has been a dominant feature of virtually all previous methods.
A sustainability assessment of a city is comprehensive, involving economic, social and environmental factors. When assessing environmental sustainability, the ecological footprint, defined as the total area of land required to sustain an urban region, is a promising indicator (Rees, Citation1992). However, the data required to calculate the ecological footprint are difficult to gather for some cities. Moreover, the ecological footprint is sometimes criticized because it does not account for all human activities. Therefore, for practical reasons, the absolute amount of GHG emissions per capita per year was adopted as a key indicator of the environmental load (L) to track progress towards the goal of the Paris Agreement. Other environmental factors are assessed together with economic and social factors to estimate quality (Q). Assessments of economic and social sustainability are difficult, as these properties are often strongly related to individual values, cultures, histories etc. Thus, an absolute assessment of Q is difficult in many cases (Cooper, Citation1999; Kohler, Citation1999; Rees, Citation1999). Relative assessments are limited by the potential to conceal the real impacts of development on the global environment, as pointed out by Rees and Kohler; however, relative assessments are preferable to a complete lack of analyses. Instead, the possibility of understanding one’s relative position may introduce the principle of competition and provide incentives to improve status. Therefore, an appropriate set of indicators to measure ‘relative sustainability’ was selected from proposed SDG indicators.
Assessment of cities worldwide
CASBEE-City was initially developed to assess cities in Japan in 2011. However, the assessment target has since been broadened and it now applied to all cities around the world. Assessment items and indicators in the new assessment method, CASBEE-City (worldwide-use version), must be carefully selected to enable assessments of cities in both developing and developed countries, regardless of their size or location. To this end, candidate indicators were selected after reviewing various materials issued by international organizations, such as the UN and its related organizations (UN-Habitat, the United Nations Educational, Scientific and Cultural Organization (UNESCO), the World Bank and the World Health Organization (WHO)), the ISO and the Organisation for Economic Co-operation and Development (OECD). The indicator selection process is described in more detail below.
Assessment framework for quality (Q)
The assessment of Q is based on the concept of the triple bottom line, in which the quality of a city is comprehensively assessed from economic, social and environmental perspectives: the three pillars of sustainability. Assessment items and indicators for Q were basically selected from the proposed 230 global SDG indicators. However, some indicators are altered slightly or selected from the ISO 37120 indicators when the originally proposed indicators are not applicable to cities or the necessary data cannot be collected at the local level. ISO 37120:2014 is a set of indicators developed to measure the performance of city services and quality of life; it became an international standard (IS) in May 2014 (ISO, Citation2014b).
Indicators were carefully selected by taking several key criteria into account, including (1) indicators with high data availability, (2) indicators proposed in both SDGs and ISO 37120 (i.e. indicators considered important by international organizations), (3) indicators that can be defined with clarity, (4) indicators that can be evaluated quantitatively and (5) balance among assessment items. In particular, the availability of data was strongly considered, as assessment indicators are essentially useless if data are not available, irrespective of the theoretical basis for including them. Many theoretically interesting indicators have been proposed by IAEG-SDGs; however, many of these cannot be used for city assessments owing to lack of data. Therefore, indicators for CASBEE-City (worldwide-use version) were selected by taking data availability into account. For example, indicators where at least 30 data points could not be collected were excluded in the study to improve the accuracy of the results.
Each SDG indicator belongs to one of the overarching 17 goals. The most relevant goal for urban issues is SDG goal 11: ‘Make cities and human settlements inclusive, safe, resilient and sustainable’, the only (unique) goal focused on a specific area, including corresponding targets and indicators. These indicators were initially reviewed. However, the role of local stakeholders far exceeds the achievement of goal 11. Issues related to cities are related to the other 16 goals and indicators applicable to city assessment are also distributed throughout the other indicators. Therefore, indicators for the other 16 goals should be reviewed as well, and this point has been acknowledged (Caprotti et al., Citation2017; ICLEI, Citation2015; UCLG, Citation2015). The one to three most relevant indicators for each of the 17 goals of SDGs (except goal 11) were selected to monitor progress. Selected indicators and definitions are shown in .
Table 1. Assessment items and indicators for CASBEE-City (worldwide-use version).
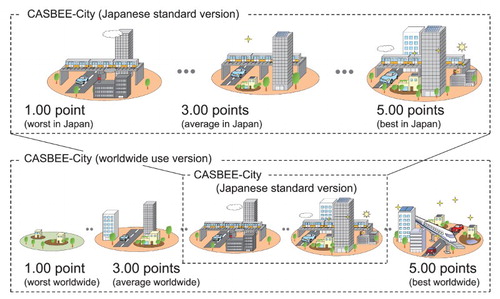
City quality is assessed using the selected assessment indicators. Indicator values are calculated after data collection. Raw indicator values are reported to understand the current actual conditions of cities. Then, cities are evaluated for each assessment item and a maximum of five points are given, corresponding to the conditions in a city and to political efforts led by the city. Three points is the baseline; average cities in Japan were assigned to this level in the previously developed CASBEE-City (hereafter referred to as CASBEE-City Japanese standard version to distinguish it from the recently developed CASBEE-City worldwide-use version) (Japan Sustainable Building Consortium (JSBC), Citation2011). Application boundaries have expanded from Japanese cities to cities worldwide and three points are assigned to cities consistent with the worldwide average. Five points is optimal, indicating the best-performing and most forward-looking cities with respect to quality. One point is assigned to low-performing cities that have yet to take action, as shown in .Footnote1 This five-point scale enables comparisons among cities and allows cities to determine their strengths and weaknesses.
Figure 2. Expansion of the application boundaries from Japanese cities to cities worldwide.
Finally, the total Q score (100-point scale) is calculated by an additive/weighted approach. The total Q score is calculated by summing the scores (five-point scale) for each indicator, using a coefficient to weight values. The weighting coefficients for indicators are set to be equal within categories and can be redistributed among indicators in cases when values cannot be calculated owing to a lack of data. Weighting coefficients for the three categories (economic, social and environmental aspects) are also equal in the default settings. If complex interactions among 17 goals, 169 targets and approximately 230 indicators of SDGs are revealed, the weighting coefficients can be changed to reflect this scientific knowledge. The weighting coefficients can also be changed according to the intended use. The total Q score is calculated according to the following equation:Footnote2(1) where the parameter Q is the score for each indicator or category on a five-point scale, which can be calculated from the relative position of the target city among cities worldwide (1 point is the worst score and 5 points represents the best score); w (
) is the weighting coefficient for each indicator or category; and i and j are indexes corresponding to each category and indicator, respectively.
Assessment framework for environmental load (L)
The assessment of L is based on the amount of GHG emissions in the CASBEE-City assessment. GHG emissions are converted into CO2 equivalents (CO2eq) and evaluated based on annual GHG emissions per capita (t-CO2eq/person/year) in order to ensure a fair assessment, regardless of population size. Assessment of L in CASBEE-City is limited to GHG emissions to monitor progress toward mitigation goals, aligned with the Paris Agreement. Other environmental loads, such as air pollution, water pollution and waste generation, are partially considered on the quality (Q) side.
CASBEE-City recommends the use of the GPC to calculate GHG emissions (WRI et al., Citation2014). GPC is the international protocol for calculating GHG emissions at the cities and communities level. GHG emissions inside and outside the city are generated by activities taking place within the city. To distinguish between these emission types, the GPC groups GHG emissions into three categories based on where they occur. GHG emissions that physically occur within the city are categorized as scope 1; emissions from the use of electricity, steam and/or heating/cooling supplied by grids, which may or may not cross city boundaries, are categorized as scope 2; and emissions that occur outside the city, but are driven by activities taking place within the city, are categorized as scope 3. Cities are encouraged to disclose the extent to which they have estimated their GHG emissions for fair comparisons with results obtained for other cities. If data are not available and, therefore, cities cannot calculate their GHG emissions using GPC, CASBEE-City recommends the use of the calculation tool or method adopted by the particular city or country. Most importantly, it is necessary to ensure transparency and therefore cities should disclose the protocol that is used, the sector and subsector included, and the kind of GHG that is calculated.
In this manner, absolute GHG emissions are estimated by referring to the methods of the GPC and other reliable protocols. Indicator values (t-CO2eq/person/year) for L are obtained by dividing annual GHG emissions by the city population. CASBEE-City offers the opportunity for international comparisons, as suggested previously (Cooper, Citation1999; Kohler, Citation1999; Rees, Citation1999). Finally, a total L score on a scale of 0 to 100 is calculated by applying a logistic function where the global emissions average per capita (approximately 5t-CO2eq/person/year) is represented with a median value of 50. The total score for L is calculated using the following equation:Footnote3(2) where parameter a is the gain, which specifies the curvature of the logistic curve; parameter x represents the amount of GHG emissions from the city; and m represents the worldwide city average GHG emissions. The values for GHG emissions are log-transformed owing to the huge disparities. Some cities emit only 0.1 CO2eq/person/year, while others emit more than 100 CO2eq/person/year.
The load reduction score (LR = 100 – L score) is also calculated and is represented in a bar chart along with the Q item scores.
Assessment of cities based on quality (Q) and environmental load (L)
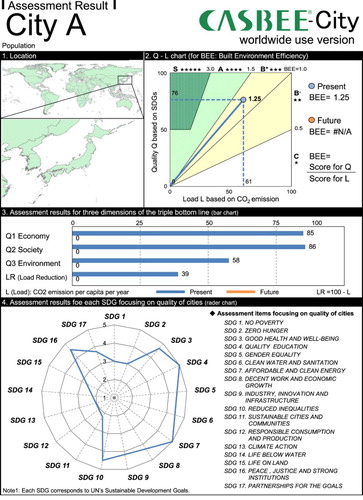
The assessment results for Q and L of a city are plotted on a two-dimensional graph called the built environment efficiency (BEE) chart, in which the total score for L is plotted on the x-axis and the total score for Q is plotted on the y-axis, as shown in . BEE is then calculated to enable a comprehensive assessment using the following equation containing the aforementioned total score for Q and total score for L on a 100-point scale:(3) BEE is expressed as the slope of a straight line beginning at point (0, 0) and reaching a maximal point (total score for L, total score for Q). According to the value corresponding to the gradient, a target city is ranked and labelled as follows: S rank, A, B+, B– and C. Even if the gradient is 3.0 or higher, the BEE will not be assigned to the S rank, the highest grade, unless the Q = 50 (the average score) or higher. Cities with a high score for Q and low score for L, plotted in the top left of the BEE chart, are regarded as ‘relatively more sustainable’. Cities in the bottom right are regarded as ‘relatively less sustainable’ within the CASBEE-City assessment methodology. Cities can compare current actual conditions with predicted future conditions by inputting a future target value for each indicator. An image of the assessment results sheet, including the abovementioned BEE chart, generated by CASBEE-City, is shown in . CASBEE-City also generates a radar chart, which enables users to understand how cities contribute to the achievements of SDGs.
Figure 3. Visualization of the assessment results in a built environment efficiency (BEE) chart.
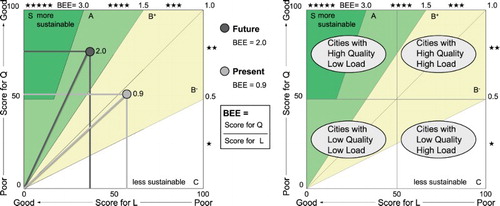
Figure 4. Assessment results generated by the CASBEE-City.
Case studies: assessment of cities around the world
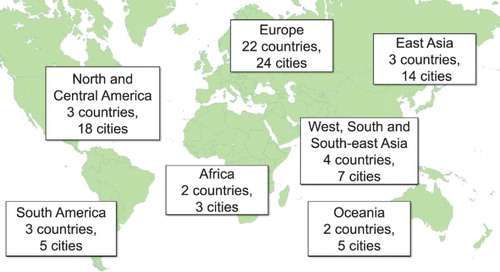
This section describes the comprehensive assessment of cities around the world using CASBEE-City (worldwide-use version). Cities were assessed to examine CASBEE-City functionality, feasibility and accuracy. Cities in Europe, Africa, North America, South America, Asia and Oceania, including both developing and developed countries, were chosen to measure progress toward goals (i.e. SDGs and GHG mitigation goals) in each region. The assessment method is theoretically applicable to all cities worldwide, including small towns and villages where statistical data exist; however, large cities, such as capital cities or those that are well-known internationally, were chosen as assessment targets for case studies because it is relatively easy to collect data and evaluate the method. shows the number and distribution of cities included in the analysis.
Figure 5. Cities assessed using CASBEE-City.
Data for cities were collected from the statistical databases of international organizations and relevant statistical bureaus. Despite extensive efforts to collect data necessary for city assessments, some data could not be obtained. When required data were missing, the weighting coefficient of the appropriate indicator was evenly redistributed among the other indicators when calculating the Q score. CASBEE-City recommends that cities use the GPC to estimate annual GHG emissions per capita per year and to calculate the L score; however, the number of cities that use GPC is limited at present and, therefore, GHG emissions data were collected from the OECD statistics based on data availability.
Results: assessment results of cities around the world based on Q and L
Using CASBEE-City, 76 cities in 39 countries were assessed based on Q, L and BEE and evaluated in a comparative framework. The assessment results are mapped on the BEE chart, as shown in .
Figure 6. Assessment results for cities around the world using CASBEE-City.
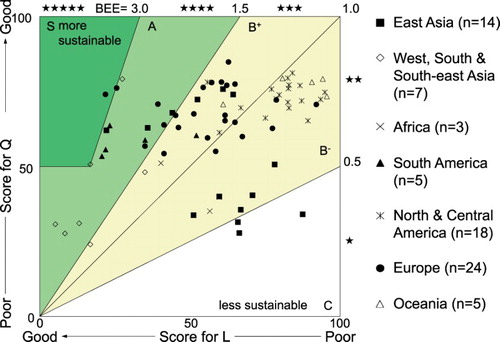
A single point in represents a city.Footnote4 Although there were exceptions, the results indicated that cities in developed countries and regions (e.g. North and Central America) generally have a high quality score, but a huge environmental load. In contrast, cities in developing countries and regions (e.g. West, South and Southeast Asia) have lower quality scores compared with those of cities in developed countries and regions. However, developing cities tend to have a low environmental load and thus a higher environmental efficiency than those of developed cities, in some cases.
It should be noted that a high variance in the total Q score exists for cities in Asia. These results show the high variation among developed cities and cities with ongoing development in these regions. The total Q score for cities in Africa remained low as a whole. In contrast, cities in North and Central America, Europe and Oceania had high Q scores and a low variance. These are general trends for regions in the world. When focusing on the assessment results for Q obtained in this study, the trends roughly resemble city rankings based on other analyses, such as the Economist Intelligence Units’ Global Liveability Ranking and Mercers’ Quality of Living Rankings.
GHG emissions and the total L score in developed cities tend to be large. However, GHG emissions from cities depend on the lifestyle of citizens, population density, urban form, industrial structure, regional climate etc. and thus it is difficult to make fair comparisons. It should be noted that the case studies were not standardized in the study and the results should be interpreted with caution.
Discussion, limitations and future challenges
City assessments and the visualization of the results are expected to enable users, such as local government administrators and other stakeholders, to understand their strengths and weaknesses in comparison with other cities in the world, which is important to promote sustainable development and to make cities more attractive.
CASBEE-City enables measurements of the contributions of cities to achievements toward goals (SDGs and GHG mitigation goals). However, a full understanding of city sustainability is clearly a long way off, for a range of reasons, summarized below:
The definition of a city must be reconsidered, given the increasing conceptualization of cities with reference to non-territorial spatial concepts (Barnett & Parnell, Citation2016). The city was defined as an enclosed space within a local jurisdiction in this study; however, cities as assessment targets may be variable and broader in scope. Treating cities as completely measurable and controllable entities is erroneous. It should be noted that the proposed set of indicators measure a limited number of criteria within a fixed administrative boundary which does not always reflect the reality of a metropolitan city and its outlying districts.
Selected indicators should be revised according to their intended use. The indicator set proposed in the study is just an example of the use of SDG indicators for assessing cities. Although standardizing the definition and measurement methodology for sustainable cities would be helpful, such standardization would result in generic, broadly applicable definitions and it would be necessary to include exceptional cases (Caprotti et al., Citation2017). Standardization of indicators can also exclude indicators that are important in a local context. These negative aspects of standardization should not be overlooked. Therefore, indicators proposed in the study as well as SDG indicators should be reviewed and subjected to further improvement. The adoption of SDGs must not discourage discussion related to sustainable indicators; rather, it should be starting point for further discussions and improvements.
Figure 7. Example results of an actual case study for Tokyo and London.
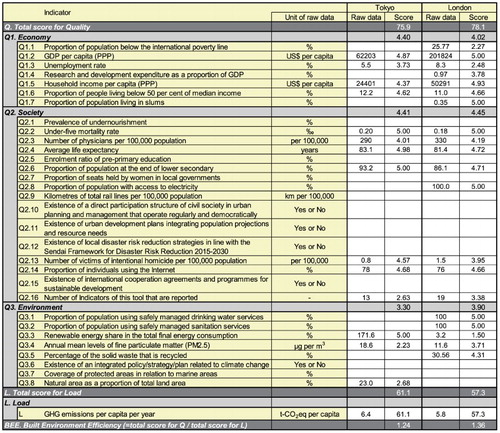
Continuous data collection is necessary for each indicator. Owing to limited data availability, case studies in this paper allow only a partial assessment of city sustainability. shows example results of an actual case study for Tokyo and London.Footnote5 There are many missing data, illustrating the difficulties of data collection, even in developed cities where it is relatively easy to collect statistical information. Data availability, robustness and comparability also affect the selection of assessment indicators. Due to data limitation, the proposed assessment method may exclude some necessary indicators. If more city data were available, then more informational, essential indicators would become available for city assessment.
The development of a channel (system) for acquiring data is one of the most important and essential challenges to be overcome for addressing SDGs. In this light, the Global Partnership for Sustainable Development Data (Citation2016) has started to build an enabling environment for harnessing data relevant to sustainable development. IAEG-SDGs are also developing new indicators to monitor global progress of SDGs. More accurate city sustainability assessments are expected as data availability increases due to the efforts of these stakeholders.
The linkages between sustainability issues also must be fully understood, and those results should be considered when selecting assessment indicators and determining the weighting coefficient for each indicator. The precise scientific rationale of selecting assessment indicators should be clarified further. For these reasons, it is important for users of CASBEE-City (worldwide-use version) to acknowledge that there are still several limitations in city sustainability assessments and that results should be updated in an ongoing manner.
These are just a few examples of the limitations of the study and future challenges. Caprotti et al. (Citation2017) outlined agendas for future consideration; continued discussion based on their questions and the study framework is required to achieve real sustainable development.
Conclusions
An assessment method that allows users, such as local government officers, citizens and other stakeholders, to understand the actual conditions of their cities and make progress toward achieving global SDGs and the Paris Agreement, CASBEE-City, was developed and introduced in this study. In total, 76 world cities in 39 countries were assessed from the perspective of Q, L and BEE and compared to demonstrate their function, feasibility and accuracy of assessment results using CASBEE-City.
City assessments were conducted using CASBEE-City, and these case studies revealed that cities in developing regions tend to have lower Q scores than those of other cities. In contrast, many cities in developed regions have high Q scores. However, the opposite trend was observed for L. Many cities in developing regions emit fewer GHGs than the global average, whereas many cities in developed regions emit more GHGs than that average. Therefore, some cities in developing regions have better BEE (= Q/L) values than those of cities in developed regions, indicating that more decarbonization is required for cities in developed regions.
An ideal development path toward sustainable cities is shown in . Developed cities have to decrease their GHG emissions, while maintaining quality. In contrast, developing cities should focus on improving quality without increasing their environmental load. It is important for cities to understand their current actual conditions in comparison with other cities around the world. It is also important for those cities to learn best practices and to consider and implement appropriate and effective measures toward sustainable development.
Figure 8. Ideal development path toward sustainable cities.
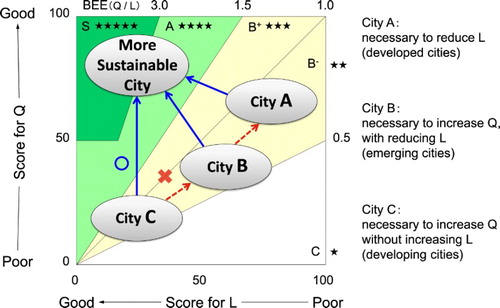
Because Q is a relative assessment index, it cannot be directly applied to determine the consumption level required for a reasonable quality of life to achieve the SDGs and to limit GHG emissions in order to keep global warming to 1.5 or 2.0°C above pre-industrial levels. However, the method proposed in this study is a starting point for discussing the balance between human development and environmental conservation. This city assessment and the visualization of results for actual city conditions are expected to enable local governments and all other stakeholders to detect urgent issues in their cities and to make their cities more liveable and sustainable.
Acknowledgements
This study is a part of a project conducted under the auspices of the Committee for the Development of an Environmental Performance Assessment Tool for Cities. The authors thank the members of the committee: Mr Tomohiro Uchiike, Mr Takashi Otsuka, Mr Shinichi Kaburagi, Dr Takahiro Kawayoke, Dr Ryota Kuzuki, Mr Hiroaki Takai, Professor Akira Nakamura, Mr Takashi Hashimoto, Dr Junichi Fujino, and Mr Nobuhaya Yamaguchi. Finally, the authors would also like to thank Mr Masaki Takigami, Mr Junya Yamasaki and Mr Shoichiro Fujita who have contributed to the study.
Disclosure statement
No potential conflict of interest was reported by the authors.
ORCID
Shun Kawakubo http://orcid.org/0000-0003-3676-8057
Shuzo Murakami http://orcid.org/0000-0002-5758-3919
Toshiharu Ikaga http://orcid.org/0000-0002-3451-5614
Yasushi Asami http://orcid.org/0000-0001-9717-3044
Additional information
Funding
Notes
1. Theoretically, 1 point is assigned to the worst city worldwide and 5 points assigned to the best city worldwide. However, it is impossible to collect data for all cities in the world at present. For practical reasons, rather than using data for cities, national data were collected and a five-point scale was defined using these national-level data, which were obtained as averages for all cities in each country.
2. Refer to CASBEE for Cities Technical Manual (worldwide-use version, forthcoming) for more technical information.
3. See note 2 above.
4. City names are not indicated in the study because the assessment results for cities are not fair for some regions at present owing to lack of data and to avoid political critiques. The assessment results for cities will be improved and updated as more city data become available. Disclosure of city information is important to monitor progress toward achieving goals.
5. It may be possible to collect more data for some cities if assessors contact local governmental city officers directly. However, the assessment of cities in this study was conducted based on publicly available statistical information that can be included in international databases, for the purpose of obtaining equal results.
References
- Barnett, C., & Parnell S. (2016). Ideas, implementation and indicators: Epistemologies of the post-2015 urban agenda. Environment and Urbanization, 28, 87–98. doi: 10.1177/0956247815621473
- Bourdic, L., Salat, S., & Nowacki, C. (2012). Assessing cities: A new system of cross-scale spatial indicators. Building Research & Information, 40, 592–605. doi: 10.1080/09613218.2012.703488
- Caprotti, F., Cowley, R., Datta, A., Caston Broto, B., Gao, E., Georgeson, L., … Joss, S. (2017). The new urban agenda: Key opportunities and challenges for policy and practice. Urban Research & Practice. doi: 10.1080/17535069.2016.1275618
- Cole, R. J. (2005). Building environmental assessment methods: Redefining intentions and roles. Building Research & Information, 33, 455–467. doi: 10.1080/09613210500219063
- Cole, R. J., Brown, Z., & Mckay S. (2010). Building human agency: A timely manifesto. Building Research & Information, 38, 339–350. doi: 10.1080/09613211003747071
- Cooper, I. (1999). Which focus for building assessment methods – environmental performance or sustainability? Building Research & Information, 27, 321–331. doi: 10.1080/096132199369435
- Global Partnership for Sustainable Development Data. (2016). Global partnership for sustainable development data. Retrieved from http://www.data4sdgs.org
- Global Taskforce of Local and Regional Governments. (2016). Roadmap for localizing the SDGs: Implementation and monitoring at subnational level. Retrieved from http://unhabitat.org/roadmap-for-localizing-the-sdgs-implementation-and-monitoring-at-subnational-level
- Holman, N. (2009). Incorporating local sustainability indicators into structures of local governance: A review of the literature. Local Environment, 14, 365–375. doi: 10.1080/13549830902783043
- ICLEI. (2015). ICLEI briefing sheet. Retrieved from http://www.iclei.org/briefingsheets.html
- Inter-Agency and Expert Group on SDG Indicators (IAEG-SDGs). (2016). SDG indicators, official list of SDG indicators. Retrieved from http://unstats.un.org/sdgs/indicators/indicators-list/
- International Organization for Standardization (ISO). (2014a). Smart community infrastructures – Review of existing activities relevant to metrics, ISO/TR 37150:2014(E).
- International Organization for Standardization (ISO). (2014b). Sustainable development of communities – Indicators for city services and quality of life, ISO 37120:2014(E).
- International Organization for Standardization (ISO). (2017). Sustainable development in communities – Inventory of existing guidelines and approaches on sustainable development and resilience in cities, ISO/TR 37121:2017(E).
- Japan Sustainable Building Consortium (JSBC). (2011). CASBEE for cities technical manual. Tokyo: Japan Sustainable Building Consortium.
- Joss, S., Cowley, R., de Jong, W. M., Muller, B., Park, B., Rees, W. E., … Rydin, Y. (2015). Tomorrow’s city today: Prospects for standardising sustainable urban development. London: University of Westminster.
- Kohler, W. (1999). The relevance of green building challenge: An observer’s perspective. Building Research & Information, 27, 309–320. doi: 10.1080/096132199369426
- Murakami, S., Iwamura, K., & Cole, R.J. (2014). CASBEE a decade of development and application of an environmental assessment system for the built environment, Tokyo: Institute for Building Environment and Energy Conservation (IBEC).
- Murakami, S., Kawakubo, S., Asami, Y., Ikaga, T., Yamaguchi, N., & Kaburagi, S. (2011). Development of a comprehensive city assessment tool: CASBEE-city. Building Research & Information, 39, 195–210. doi: 10.1080/09613218.2011.563920
- Rees, W. (1992). Ecological footprints and appropriated carrying capacity: What urban economics leaves out. Environment and Urbanization, 4, 121–130. doi: 10.1177/095624789200400212
- Rees, W. (1999). The built environment and the ecosphere: A global perspective. Building Research & Information, 27, 206–220. doi: 10.1080/096132199369336
- Star Communities. (2016). STAR community rating system version 2.0. [Software]. Retrieved from http://www.starcommunities.org/
- Sustainable Development Solutions Network (SDSN). (2016). Getting started with the SDGs in cities, a guide for stakeholders. Retrieved from http://unsdsn.org/wp-content/uploads/2016/07/9.1.8.-Cities-SDG-Guide.pdf
- United Cities and Local Governments (UCLG). (2015). The sustainable development goals: What local governments need to know. Retrieved from https://www.uclg.org/sites/default/files/the_sdgs_what_localgov_need_to_know_0.pdf
- United Nations. (2015). Transforming our world: The 2030 agenda for sustainable development, A/RES/70/1.
- United Nations Conference on Housing and Sustainable Urban Development (Habitat III). (2016). Draft outcome document of the United Nation conference on housing and sustainable urban development (Habitat III), A/CONF.226/4*.
- United Nations Framework Convention on Climate Change. (2015). Adoption of the Paris agreement, FCCC/CP/2015/L.9/Rev.1.
- World Resources Institute, C40 Cities Climate Leadership Group and ICLEI. (2014). Global protocol for community-scale greenhouse gas emission inventories (GPC). Retrieved from http://www.ghgprotocol.org/greenhouse-gas-protocol-accounting-reporting-standard-cities