
ABSTRACT
Building management systems are designed for energy managers; there are few energy-feedback systems designed to engage staff. A tool, known as e-Genie, was created with the purpose of engaging workplace occupants with energy data and supporting them to take action to reduce energy use. Building on research insights within the field, e-Genie’s novel approach encourages users to make plans to meet energy-saving goals, supports discussion and considers social energy behaviours (e.g. discussing energy issues, taking part in campaigns) as well as individual actions. A field-based study of e-Genie indicated that visualizations of energy data were engaging and that the discussion ‘Pinboard’ was particularly popular. Pre- and post-survey (N = 77) evaluation of users indicated that people were significantly more concerned about energy issues and reported engaging more in social energy behaviour after about two weeks of e-Genie being installed. Concurrently, objective measures of electricity use decreased over the same period, and continued decreasing over subsequent weeks. Indications are that occupant-facing energy-feedback visualizations can be successful in reducing energy use in the workplace; furthermore, supporting social energy behaviour in the workplace is likely to be a useful direction for promoting action.
Introduction
Non-domestic buildings contribute around 12% of UK greenhouse gas emissions (BEIS, Citation2016) and have a significant potential to reduce emissions. However, studies intervening to reduce energy use in a workplace setting are few (Staddon, Cycil, Goulden, Leygue, & Spence, Citation2016). Contemporary building-management systems already provide highly granular energy data to managers, but there are few systems that feedback energy data to building users; this is the role of the e-Genie tool. It aims to feedback energy use to building users and encourage goal setting and planning, and discussion around energy issues, in order to prompt behaviour change. The current study also focuses on social energy behaviour alongside individual behaviour change given that individual agency is limited in workplaces (Bedwell et al., Citation2014; Carrico & Riemer, Citation2011).
Energy use in the workplace
Workplaces are distinct contexts in which people consume energy. They are usually shared spaces where responsibility for energy use is unclear. Employees do not have a direct financial interest in saving energy at work (Murtagh et al., Citation2013). Previous research shows that employees are motivated to save energy at work to improve their organization’s finances (Leygue, Ferguson, & Spence, Citation2017), but this is unlikely to be as strong as the direct financial motivation received for energy saving at home. Environmental reasons have been self-reported as the most important motivations to save energy in the workplace, followed by helping the organization’s finances, feeling good about the actions taken (warm glow) and helping the organization’s image (Leygue et al., Citation2017). Similarly, it is found that biospheric values (which relate to environmental concern) and environmental self-identity predict personal norms to undertake environmental behaviour at work (Ruepert et al., Citation2016).
The communal nature of energy usage in the workplace means that behaviour is visible to others, and therefore there are social normative considerations that impact behaviour (Bedwell et al., Citation2014). Indeed, social rewards for energy conservation (e.g. grade points) have been found to outperform financial rewards, and are particularly effective when visible to others (Handgraaf, Van Lidth de Jeude, & Appelt, Citation2013).
Notably, the use of office equipment and lighting often accounts for more than half of a workplace building’s overall consumption (Murakami et al., Citation2006), but much of this consumption is shared, which makes individual actions difficult. Individual energy use is likely to appear insignificant against the potential impact of collaborative reductions (Carrico & Riemer, Citation2011). Previous evaluations of energy-saving interventions have found that staff have expressed feelings of low individual self-efficacy in relation to energy saving, but that collective efficacy was significantly higher (Boomsma, Goodhew, Pahl, & Jones, Citation2016). This indicates the importance of social energy behaviour in this context, i.e. sustainable behaviours that require coordination or discussions with others. Furthermore, discussions with colleagues about electricity increases the likelihood of considering electricity-saving behaviours (Boomsma et al., Citation2016) and sense of community relates to self-reported energy-consumption behaviour (Dixon, Deline, McComas, Chambliss, & Hoffmann, Citation2015).
The facilities manager (FM) has a pivotal role in workplace energy savings, but requires the support of stakeholders to achieve these (Goulden & Spence, Citation2015). The trend in workplace energy management in recent decades has been to ‘engineer out’ building users by removing local environmental controls (e.g. thermostats, window latches, radiator valves) and placing them under the control of the FM via a building energy-management system (BEMS). This strategy has failed, at least to a degree, because building users retain the ability to influence energy management through organizational leverage – either through direct requests to the FM or, if required, via the recruitment of senior management to their cause (Goulden & Spence, Citation2015). There is a need to aid communications with and between building users, as requests made to the FM are often conflicting and/or disruptive to other workplace aims. Given that energy saving has not traditionally been a focus in office workplaces, leadership from senior management is particularly important in driving changes (Bedwell, Costanza, & Jewell, Citation2016; Staddon et al., Citation2016).
Previous research has found that engagement with energy use and energy interventions has been low (e.g. Boomsma et al., Citation2016; Bull, Stuart, & Everitt, Citation2012; Murtagh et al., Citation2013). People in workplaces usually have a primary focus on workplace goals, of which energy saving is not usually one. Setting goals in relation to energy saving and encouraging people to make a behavioural commitment has been found to be particularly effective (Abrahamse, Steg, Vlek, & Rothengatter, Citation2005). Therefore, it may be possible to create specific energy-saving goals; indeed, individuals in a workplace environment are potentially captive audiences for communications (Dixon et al., Citation2015) and are subject to organizational rules and policies. Notably, no differences have been found regarding whether goals are set by the individual or another person (McCalley & Midden, Citation2002). However, research suggests that aiming for a goal is unlikely to be successful without planning around how and when the goal is going to be achieved (Gollwitzer, Citation1993). To help translate intentions into behaviour, Gollwitzer (Citation1999) proposed implementation intentions to help individuals plan desired behaviour by linking environmental cues with the desired actions. Implementation intentions have been one of the most impactful developments within health psychology in promoting positive health behaviours (Gollwitzer, Citation1999) and have recently been used to promote energy use with some success (Bell, Toth, Little, & Smith, Citation2016). Goal-setting and -implementation tools may, therefore, be a particularly useful focus in encouraging workplace energy-saving behaviour. Notably, goal setting has been found to be especially effective when combined with feedback on progress (Becker, Citation1978; McCalley & Midden, Citation2002).
Energy feedback and visualizations
The impact of energy feedback on energy behaviour has received considerable interest, particularly due to smart meter rollouts (and associated energy displays) happening in many countries, including the UK. Indeed, sustainable energy communications studies found that the simple provision of information to participants can increase awareness of energy issues and enable people to understand better how to conserve energy. Notably, information that is tailored to an individual’s context is more effective than general information, presumably due to the specificity of the knowledge and the increased ability to identify ways to act on that knowledge (Abrahamse et al., Citation2005; Steg, Citation2008).
Given the dearth of studies conducted on energy-reduction interventions in the workplace (Staddon et al., Citation2016), it is useful to examine studies across domestic and non-domestic contexts to gain insight into what kinds of energy feedback have the greatest impact. Studies in a domestic setting using continuous direct energy consumption feedback (e.g. energy displays, online visualizations) have indicated mixed results with impacts observed varying between negligible to 15% savings on household energy use (Darby, Citation2006; Ehrhardt-Martinez, Donnelly, & Laitner, Citation2010; Giordano et al., Citation2013). Energy-consumption information appears to be most useful if it provides instantaneous feedback, historical consumption information and feedback on associated costs (Darby, Citation2006). It is proposed that feedback of this kind allows people to link energy consumption with actions more effectively (Fischer, Citation2008). It is also observed that behaviour changes prompted by feedback in the short term may fade, and longer-term continued feedback and engagement is needed to maintain changes and to prompt further changes (Darby, Citation2006). There are frequent concerns about information overload, however, and focus groups around the design of energy displays highlight keeping information simple as a key criterion for an effective display (Anderson & White, Citation2009).
Visual energy feedback (e.g. thermal imaging, carbon mapping) has been found to be particularly useful in engaging domestic users with their energy use (Gupta, Barnfield, & Gregg, Citation2017). Pahl, Goodhew, Boomsma, and Sheppard (Citation2016) highlight that visualizations are useful in communicating information quickly, attracting attention and evoking emotional responses. For these reasons, visualizations may be particularly effective in helping individuals remember and enact energy-saving goals. Indeed, research has found that thermal-imaging communications were more effective than controls in reducing energy use (Goodhew, Pahl, Auburn, & Goodhew, Citation2015). Similar to thermal imaging, carbon mapping (overlaying energy use and potential for energy savings onto geographical community maps) was found to be particularly helpful in community workshops in visualizing the need for action and demonstrating that others were taking action. To date, there is little known research examining the use of thermal imaging in the workplace.
Comparative feedback has been found to be useful in residential (Staats, Harland, & Wilke, Citation2004) and organizational settings (Dixon, et al., Citation2015; Siero, Bakker, Dekker, & Van den Burg, Citation1996). It is suggested that comparative feedback may be particularly effective in organizational settings because there are more peer interactions and behaviour is more visible. Providing information about others’ energy usage communicates descriptive norms (Dixon et al., Citation2015), though caution is necessary where others may not demonstrate positive energy-saving behaviour, as this may demotivate others and indicate that their efforts are not being shared (Brandon & Lewis, Citation1999). In a slightly different way, Carrico and Riemer (Citation2011) found that peer-level feedback was more successful than feedback delivered impersonally by e-mail, possibly because people were more likely to pay attention to the information delivered in person and because the information may have been given more credibility.
Current research
The current research aimed to integrate interdisciplinary insights via the development of a new energy engagement tool, named e-Genie (Goal-setting and ENergy Information Engagement). Unlike most other workplace energy-information tools, e-Genie was designed for building users rather than energy managers or FMs in order to promote cooperation in saving energy. Building on previous digital feedback tools, e-Genie provided current and historical energy feedback tailored to the context, and encouraged goal setting to reduce energy use. Novel features of e-Genie, which build on existing research insights, were that it specifically encouraged users to make plans to meet energy-saving goals, it supported discussion between building users, and it had a focus beyond individual behaviour to consider and promote social energy behaviours. In addition, thermal-imaging cameras and thermometers were trialled in conjunction with the e-Genie tool to promote engagement with the tool and energy issues, and to provide data to support discussions within the tool; this was the first known trial of user-led thermal imaging within the workplace. A pilot study and a main trial are described here, examining the impact of e-Genie on energy saving in the workplace.
Methods
Pilot and main trial
Design
The study design deployed the e-Genie platform in workplace office environments in order to test the functionality and usability of the system, and to examine whether engagement with e-Genie impacted energy-saving behaviour. Staff were also provided with thermal-imaging cameras and thermometers. For the pilot study, the functionality of the platform and user engagement were evaluated through ethnographic research and via surveys conducted pre- and post-deployment; the main study evaluation was conducted through data feeds from the e-Genie tool, workshop engagement, and via pre- and post-deployment surveys.
Materials
Energy-monitoring equipment
Thermal data were generated by temperature sensors (developed by Wireless Things, Nottingham, UK) placed around office areas. For the pilot study, electricity data were gained using circuit monitors (produced in-house). For the main study, electricity data were gained from an existing automated meter-reading system used by the organization, which measured overall building electricity use. The subscription to the electricity metering system unfortunately expired during the main study (though it was planned to be renewed in future), meaning further data were not gained beyond around six weeks into the study. In addition, the main study site had ongoing issues with temperature and the gas systems were at times switched off, or being repaired; additionally, some of the thermal sensors were moved or removed by building users.
e-Genie
e-Genie has two main sections: scrolling front screens that provide energy information (electricity and gas) and further screens that users click through to in order to take action on energy (see (a–d) and Appendix 1 in the supplemental data online).
Figure 1. (a) The temperature calendar is one of the front screens within e-Genie. It displays temperatures from the workplace within columns that represent one 24-hour day, which are coloured according to the average temperature for that period, where white indicates cool temperatures and orange indicates hotter temperatures. (b) The Annotation tool is also one of the front screens within e-Genie. It displays the amount of energy used (kW) over time. The user can click and drag their cursor across different sections in order to tag areas with what they think the energy use corresponds to. (c) The ‘Always on’ calendar displays the baseline electricity consumption and whether or not this was higher, similar to or lower than the previous day’s usage. Positive messages, i.e. ‘went down’ or ‘stayed the same’, are illustrated in green to indicate their desirability, and negative messages, i.e. ‘went up’, are illustrated in red to indicate they are undesirable. (d) The digital ‘Pinboard’ is a discussion space where energy issues could be discussed. Users could also upload images to this space, e.g. those taken with the thermal-imaging camera. (e) The Pledge tool provides ideas of energy-saving behaviour change goals and encourages users to create plans containing cues and actions in order to support these goals.
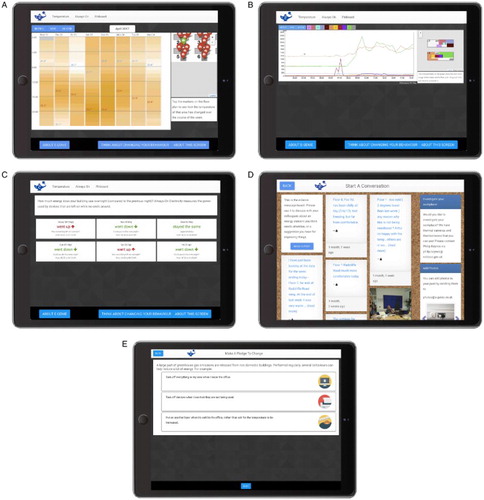
e-Genie has three energy data screens: a ‘temperature calendar’ (Costanza, Bedwell, Jewell, Colley, & Rodden, Citation2016); an ‘annotation tool’, which displays circuit monitoring of electricity with the ability to label usage observed (Costanza, Ramchurn, & Jennings, Citation2012) – removed for the main study as the pilot indicated that this was overly complex; and an ‘always on’ tool that provides information about overnight baseload usage. As noted in previous research (Abrahamse et al., Citation2005), energy information tailored to a specific context helps to increase awareness of energy issues and aids people to identify ways to reduce energy.
Users had three different options to take action on energy use. Users could e-mail their local FM, they could discuss energy use on the ‘Pinboard’ website (both forms of social energy behaviour), or they could create a goal and associated plan to change their individual or social energy behaviour with the Pledge tool. This builds on previous research that highlights the utility of goals and planning in energy saving (Gollwitzer, Citation1999). Goals could be printed out on a nearby mini-printer and kept as a reminder (mini-printer functionality was removed for the main study due to lack of interest and technical issues).
Building users could access e-Genie on desktop computers, mobile phones or on tablet displays mounted at strategic ‘public’ locations within the workplace (e.g. by the water cooler). For privacy reasons, the complete website was only accessible via devices connected to the workplace network; external devices were only able to access energy data screens. For the pilot study, the action parts of the tool required a username for access; this was removed from the main study as it appeared to discourage engagement. Both the pilot study and main trial experienced technical difficulties during the study. Problems included wi-fi network dropouts, ‘freezing’ of tablets, web server downtime and problems with tablet software updates.
Evaluation questionnaire
The pre-intervention questionnaire included measures of perceived efficacy of actions undertaken, self-reported energy behaviour and energy concern (see Appendix 2 in the supplemental data online for full wording, response scales and associated scale reliabilities). Further questions assessing a participant’s age, gender and length of occupancy in the building were also included. The post-intervention questionnaire contained the same measures of perceptions and self-reported behaviour and also contained open-ended questions about the participant’s engagement with the Pledge tool and e-Genie. A £10 Amazon voucher was offered for survey participation.
Perceived efficacy was measured with three questions (cf. Bandura, Citation2006) that examined the perceived impact of behaviour on energy use, climate change and the organization’s finances, e.g. ‘I believe that my energy use at work has an influence on my organization’s total energy use.’ Self-reported energy behaviours were measured with 21 items, including items measuring individual energy behaviour such as: ‘Turn appliances off at the plug socket when not in use’; and social energy behaviour such as: ‘Remind a colleague to switch something off to save energy.’ These were based on previous measures from Spence, Leygue, Bedwell, and O’Malley (Citation2014) and Leygue et al. (Citation2017). Concern about energy saving was measured (cf. Spence et al., Citation2014) with one item asking the individual about the extent of their concern: ‘How concerned, if at all, are you personally about saving energy at work?’
Thermal-imaging cameras and digital thermometers
Two thermal-imaging cameras attachments for smart phones (one Android and one iPhone version) and two digital thermometers were used. The thermal-imaging cameras were made by FLIR (Wilsonville, OR, USA) and can be inserted into the bottom of a smart phone. Visualizations of energy may help to engage building users as these have been found to help attract attention and provoke emotional responses (Pahl et al., Citation2016). The thermometers were basic units that displayed temperature on a liquid crystal display (LCD) screen; these were considered to provide further tailored energy information useful in helping users to understand local energy issues and potential related actions.
Workshop protocols
For the main study, four workshops were conducted (not used in the pilot study) to introduce e-Genie to key people in the workplace, map energy activities in the building, allocate ownership and control, and to identify more energy-efficient procedures (see Appendix 3 in the supplemental data online). These were conducted in order to embed e-Genie more effectively into the local context and to encourage discussions about energy saving, given that conversations around energy and sense of community have been related to energy saving in previous research (Boomsma et al., Citation2016; Dixon et al., Citation2015). Workshop participants included eight ordinary building users with no specific energy remit, two of whom were floor representatives who had a role of liaising with FMs, one person from the energy management team and one person from the FM team. The involvement of FMs was purposeful given their pivotal role in achieving changes in energy use in the workplace (Goulden & Spence, Citation2015). Participants were recruited by e-mail, which described workshops including the energy focus and a food incentive. Attendees were selected to represent the range of floors the study covered and attendance was largely consistent with only one person dropping out after the first week. Workshops were conducted over lunchtimes and each took approximately one hour. Participants were asked to promote the use of e-Genie amongst colleagues upon the launch of e-Genie given that information delivered by peers has been found to have had a greater impact than that delivered impersonally (Carrico & Riemer, Citation2011). Cupcakes were offered to participants for participation in the first two workshops; no incentives were offered for the last two as these were deemed unnecessary.
Pilot study
Deployment site
The pilot deployment site was a not-for-profit organization in a modern building in Central London. The rented offices were open plan and comprised two floors of the building, extensively refitted for the current organization, and containing around 80 occupants at any one time, approximately 50 of whom were temporary (located there for only a few months), alongside an exhibition and conference space.
Procedure
Ethnographic research began before the e-Genie launch and was used to create energy-saving goals for the Pledge tool. e-Genie was launched and made available to building users with a lunchtime seminar describing the academic background and functions of e-Genie. Promotional materials (e.g. e-Genie branded chocolate) were provided to incentivize users to discuss the tool with the research team. In addition, operations staff within the building were provided with the digital thermometers and thermal-imaging add-ons for all staff to access and borrow to encourage engagement. Pre- and post-intervention surveys were circulated by e-mail, with the first circulated a week before the launch of e-Genie, requiring completion by the e-Genie launch day, and the second circulated four weeks after the first to those who completed the first survey.
Insights from the pilot study
Engagement in e-Genie was limited in this pilot: 10 users interacted with the system. Of these 10, several posted on the Pinboard, but none engaged with the Annotation or Pledge tools. Not enough data were gained from the surveys (N = 7) to allow a meaningful analysis to be conducted, but valuable initial insights into the tool and energy use within the workplace were gained.
Certain aspects of the tool were perceived as overly complex; ethnographic observations suggested some users found the system offered too much information and too little guidance. Where people did engage, it tended to be through the prism of what was most tractable to them in this context: in this case, thermal comfort. Thermometers and thermal camera add-ons attracted interest and were used by a minority. Temperature data gathered were used to challenge current office conditions and the placing of sensors used for e-Genie input. The Annotation and Pledge tools were not used and need to be modified or removed. It is proposed that the e-Genie system is responsive to the context in which it is deployed and is best deployed in a modular fashion where specific parts of the tool are activated or deactivated as is useful for the organization. The navigation of e-Genie was also identified as an issue, given that many users did not fully explore the screens available.
It appears that building users will need a clearer use-case, or incentives, for engaging with a system such as e-Genie. This might be achieved by defining tasks for users, e.g. challenges for users to achieve, which could be identified jointly with local managers. Increased tailoring of the tool may also help to engage users, with users being supported to create their own energy-saving tasks, or pledges within the Pledge tool, e.g. through workshop discussions.
Main study
e-Genie was further developed based on the evaluation of the pilot study (see Appendix 1 in the supplemental data online for details). The Annotation tool was removed given concerns that it was difficult to understand in its current form. The Pledge tool was consolidated and shortened. Here the behaviours encouraged by the Pledge tool were generated by the workshops conducted before e-Genie deployment and also could be tailored by the user, so were thus more clearly linked to the deployment site. In addition, the navigation was adjusted so that the user could switch between screens using tabs rather than arrows, a home screen was added for the action functions (Pledge tool, Pinboard and e-mailing the FM) and the requirement to log in was removed. The ability to contact the FM was also removed according to the wishes of the deployment site.
Design
e-Genie was deployed at a regional government site from February to June 2017 to test system functionality further and to engage building users with the building’s energy-use and energy-saving behaviour. Workshops were used to engage key staff with the e-Genie tool and to explore how this could interact with, and feed into, organizational energy policies.
Deployment site
The deployment site was a 1970s’-built regional government site comprising a large office building with 10 floors. The building had approximately 900 occupants altogether and e-Genie monitored data and engaged users on six of these floors (numbers 2–7) where approximately 600 building users were based. The monitored floors consisted of open-plan office spaces set out in two wings, with kitchenettes between, and the occupants distributed fairly evenly. Temperatures were a result of a complex heating, ventilation and air-conditioning (HVAC) system, solar gain into the space, and the heat released by occupants and equipment. Ongoing comfort issues were highlighted within the building by the FM team.
Procedure
Four workshops were organized in the organization. Workshops 1–3 were run at weekly intervals and focused on introducing e-Genie and mapping energy use, considering power and comfort apportionment and responsibilities, and initial causality and policy considerations. These were run ahead of the e-Genie launch and designed to integrate the study aims with those of the organization, identify behaviours that should be targeted by the Pledge tool, and to engage key members of staff with the upcoming deployment. Workshop 4, which revisited causality and policy, was run approximately four weeks after the e-Genie launch. Staff were again provided with thermal-imaging cameras and thermometers; these were also used as input for discussions within workshops.
Building users were notified of the e-Genie launch with an e-mail and through a stall set up in the canteen. Evaluation surveys were circulated a week before the e-Genie launch, with a cut-off date for completion of the day of the launch, and the second-stage survey was circulated two weeks after the e-Genie deployment to those participants who had responded to the initial survey (N = 92).
Results
Workshop insights
Whilst the office space was open and formally consisted of hot desks, in practice groups of staff fulfilling certain functions sat together, and had a sense of ownership over their space. Occupants had a limited understanding of what equipment in the office used most energy, had little knowledge of how the heating system worked, or was intended to work, and expressed a great deal of frustration with the thermal comfort. Temperatures in the building were highly variable, changing between floors and within them and there was lack of consistency in these over time. Staff highlighted negative consequences for staff wellbeing and energy efficiency as a result of the unpredictable temperatures.
Workshop participants were encouraged to use the thermal-imaging cameras and thermometers, and this proved to be an engaging process. Several used the cameras, and the images taken were used at the second workshop to prompt discussion of comfort and energy use in the space. Surprising differentials in temperature were noted, e.g. in the fabric of the building, which showed how much heat was being lost through the glazed areas of the facade. Observations also led to suggestions for changes in process. For example, cold spaces under desks were observed, leading to the idea that computers could be repositioned under desks to provide some incidental heat gain. Thermometers got some use by participants, but were used less than cameras, primarily because it seemed that building users were already using their own thermometers to explore and evidence temperature issues.
e-Genie tool assessment
Building user engagement with e-Genie was much higher than the pilot study. The number of distinct individual users was not logged here, but it is noted that the Pinboard received 66 comments during the first six weeks of deployment, though it had limited engagement by the FMs.
Energy data
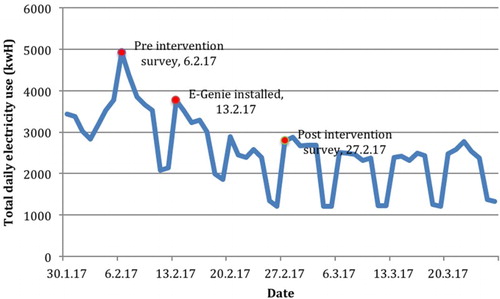
Electricity, gas and thermal sensor data were collected throughout the study. Gas and temperature data could not be analysed due to the technical difficulties, leaving large gaps in data collected. We combined electricity data to provide daily summaries of electricity usage for the two-week period before the deployment of e-Genie, continuing to six weeks after the initial deployment (). Data indicated that the two weeks following the deployment of e-Genie (matching the period of evaluation of questionnaire data below) demonstrated a 24.64% reduction in energy use compared with the two-week period before e-Genie deployment. For the subsequent two fortnight periods measured, reductions continued with a further 14.55% and 2.30% reduction in energy usage (each compared with the previous fortnight). Overall, in the final fortnight, monitored energy usage was 37.09% lower than in the initial fortnight period monitored before e-Genie deployment.
Figure 2. The total daily electricity usage is illustrated over the study period of the main study. Cyclical dips in the electricity trace indicate lower usage at weekends. Red points indicate key study time points.
In order to examine if there were an effect of e-Genie on electricity use over and above the weather over this time period, generalized estimating equations (GEEs) were used, with a first-order autocorrelation function to account for non-independence over time and robust standard errors, to model electricity use as a function of both heating degree-days (HDD)Footnote1 and time coded as pre- or post-e-Genie (0 or 1 respectively). The model demonstrated that both HDD (B = 100.414, p = 0.006) and e-Genie (B = −775.411, p = 0.001) had significant effects. As a high score on HDD indicates a longer period at a low temperature, the positive coefficient indicates that more electricity is used when temperature is low for a longer period of time. However, even with HDD in the model, e-Genie still results in a significant decrease in electricity use.
Questionnaire data
Seventy-seven building users responded to the survey and they were matched between time points. Participants had a median age of 46 (range 19–67) years and a fairly even split of genders (39 male, 38 female). Only one person reported completing the Pledge tool, so these data were not analysed here.
A repeated-measures analysis of variance (ANOVA) was used to examine differences in self-reported behaviour because this accounts for the relatedness between the pre- and post-measures. Self-reported behaviour to save energy was significantly higher after a two-week period following e-Genie being installed (F(2, 65) = 6.24, p < 0.01) (). Examining individual and social energy-saving behaviour reports separately, we found no difference in individual energy-saving actions across the two-week period (pre-mean = 2.87, SD = 1.04; post-mean 2.86, SD = 0.95; F = 0.01, p = n.s.), but a significant increase in social energy-saving actions (pre-mean = 3.36, SD = 1.20; post-mean 3.70, SD = 1.20, F = 9.55, p < 0.01).
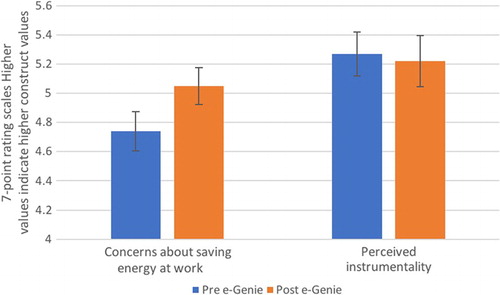
A further repeated-measures ANOVA indicated differences in perceptions examined (energy concern and perceived efficacy) over time (F(2, 75) = 3.58, p < 0.05). Concerns about saving energy at work were found to be significantly higher at the end of the two-week period following e-Genie installation (pre-mean = 4.74, SD = 1.17; post-mean = 5.05, SD = 1.12; F = 6.73, p < 0.05), but levels of perceived efficacy did not change (pre-mean = 5.27, SD = 1.33; post-mean = 5.23, SD = 1.53; F = 0.10, p = n.s.) ( and ).
Figure 3. Self-reported environmental behaviour intentions before and after the e-Genie installation in the main study. Data indicate that individual environmental behaviour intentions were similar pre- and post-e-Genie installation; social environmental behaviour intentions were significantly higher two weeks after e-Genie was installed.
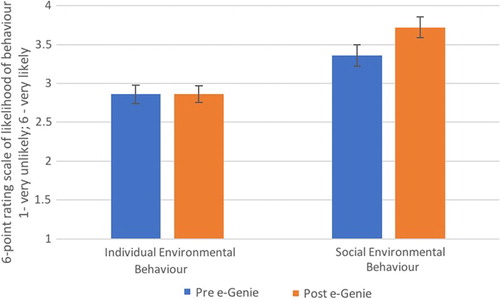
Figure 4. Perceptions relating to energy use pre- and post-e-Genie installation in the main study. Data indicate that concerns about saving energy at work were significantly higher two weeks after e-Genie had been installed. Perceived instrumentality levels were similar pre- and post-e-Genie install.
e-Genie feedback
Several open-ended questions in the questionnaire focused on what people did and did not like about e-Genie, how they thought e-Genie could be improved, and reasons why they did not use the Pledge tool if they had not. Open-ended responses were coded thematically by two researchers independently and then codes discussed to reach consensus. Agreement was high before discussions (ranging from 64.71% to 77.97%) and disagreements centred around how many subcategories were created rather than over meaning. Responses could be coded as more than one theme only if multiple points were made; the same point could not be coded as more than one theme.
With respect to why e-Genie was liked (see Table 1 in Appendix 4 in the supplemental data online), participants reported that seeing energy data was useful, and that they liked the data visualizations. In addition, respondents commented that e-Genie encouraged communication and the Pinboard was liked. Comments also indicated a perception that the installation of e-Genie demonstrated the management take energy issues seriously.
Responses examining why e-Genie was not liked and how it could be improved (see Tables 2 and 3 in Appendix 4 in the supplemental data online) focused on similar issues. Comments indicated that problems primarily focused on increasing the reach of e-Genie, in that more temperature sensors could be placed and in more appropriate places. Usability issues were also raised with regards to making it easier to make comments on the Pinboard, to navigate the system and to make the system more technically reliable. Some individuals also commented that they found it hard to undertake recommended actions and they would like to have more control over energy systems in their environment. A few people also highlighted that they desired more interaction from management in responding to energy issues raised within e-Genie.
Questionnaire respondents were asked whether they had undertaken pledges to change their behaviour and if they had not, why not (see Table 5 in Appendix 4 in the supplemental data online). Responses here centred around lack of time or awareness of the tool, and some people indicated they still aimed to use this feature. Many people also said they found it difficult to act because of lack of local control over energy; others explained they did not have ideas for action or that they did not find the tool useful in this respect.
Discussion
e-Genie is an innovative tool in that it provides energy data visualizations to building users rather than FMs, only done by a few other recent tools (Murtagh et al., Citation2013; Yun, Citation2014); it differs from these previous tools in that it provides support for users to make plans to meet energy-saving goals, it supports discussion between building users, and it provides support for social as well as individual behaviour change. Initial trials of e-Genie have indicated moderate success with subsequent higher levels of energy-saving concerns and social energy behaviour reported; these data converged with objective data indicating a 25% decrease in electricity usage after a fortnight of deployment and a 37% decrease after six weeks. Importantly, decreases in electricity were observed over and above reductions in heating due to increases in temperature over the study period. The long-term impacts of the tool are unknown, however, as further evaluation was not possible due to technical issues. Data from workshops and open-ended survey questions also indicated that additional energy data, and associated visualizations, were liked and welcomed in the workplace setting by both building users and facilities management. It is proposed that e-Genie is best developed as a modular tool, adapting to the organizational context as necessary.
From this study and previous work (e.g. Goulden & Spence, Citation2015), it appears that the provision of data alone is not enough. People need to be supported in communicating, negotiating and acting on energy use. The collected data find little to no impacts on individual energy behaviour or on perceived individual efficacy of the e-Genie tool; this may be indicative of the lack of scope for individual energy-behaviour changes in the workplace (Bedwell et al., Citation2014; Carrico & Riemer, Citation2011). Lack of individual agency provides a further imperative for the examination and promotion of social energy behaviour, which to date has received little attention within the field. Social energy behaviours – encouraging people to discuss and negotiate energy use and propose process changes – appear to be a particularly impactful direction for future interventions at the building user level. It is possible there is particular scope for increasing social energy behaviour given that social behaviours may not be those immediately considered as sustainable workplace behaviours. However, discussion amongst building users seems to be a key part of energy management – as noted, some participants in this study were already using thermometers to record and discuss issues. It is recommended that energy and facilities management consider supporting discussions around energy issues and further engaging building users to help to resolve issues (e.g. thermal comfort) and identify energy-saving opportunities. The idea of recruiting building users to support facilities management stands in stark contrast to the ‘engineering out’ of building users from the energy management process (Goulden & Spence, Citation2015), but has the potential to increase user satisfaction, identify opportunities for energy saving, and manage the extensive demands relating to thermal comfort that characterize many workplaces (Huizenga, Abbaszadeh, Zagreus, & Arens, Citation2006).
Engagement between FMs and staff around energy remained a challenge. Qualitative data indicated that the ‘Pinboard’ tool was particularly liked by users and it is possible that the increased discussions around energy relate to the increases reported in social energy behaviour. However, it was clear FMs within our studies were unable or unwilling to engage with a system that requires them to shift to a proactive user-engagement stance. The inclusion of building users within the process of energy management could be perceived as requiring the FMs ceding some level of control to building users, which may not be liked. Therefore, there is an ongoing challenge here in how to engage FMs in this role. It is possible that engagement of FMs could be gained through the provision of extra resources, and appropriate training. There also may be ways in which improvements to e-Genie could support and encourage FM engagement, e.g. by giving special status to FM comments or providing FMs with greater control over the visualizations and data provided within e-Genie.
Thermal-imaging cameras and thermometers deployed in conjunction with e-Genie appeared to be successful in supporting discussions around energy use. There was an existing interest in using data to support discussions, observed as some were already using thermometers. Thermal-imaging cameras appeared to provide users with more depth of understanding of temperature in the local context and may be a useful tool in other contexts in promoting engagement with energy in the workplace environment.
Control groups were not included in either study here for practical reasons and, therefore, it is difficult to examine whether changes in concerns and behavioural intentions observed in our main study may have happened anyway over this time period or whether the differences are due to the experience of having e-Genie installed in the office or some other changes experienced. In addition, whilst our study includes a moderate sample size for a study of this type, it still only engaged a subsection of the building users. Engaging building users with energy-saving interventions is a reoccurring problem within research in this area (e.g. Boomsma et al., Citation2016; Bull et al., Citation2012; Murtagh et al., Citation2013) and is an aspect in this field that needs further attention. Indeed, the Pledge tool, which uses implementation intentions – a demonstrably effective planning technique used in other fields (Gollwitzer, Citation1999), and with some success in a previous energy study (Bell et al., Citation2016) – received little attention here. Further research could consider delivering the planning ideas in different, perhaps less obvious ways, e.g. through imagery linking environmental cues with the desired behaviour. Embedding e-Genie further within the organization by demonstrating strong leadership from management and/or setting explicit workplace goals around energy could also encourage people to participate.
Engagement with only a subsample of participants results in the possibility that participants are different to other building users in some way, perhaps in that they are already more interested in energy issues. However, it is noted that an inconvenience allowance was used to reduce sampling biases to encourage people to take part regardless of their level of interest in energy issues. In addition, objective electricity data also indicate an overall decrease in electricity use over the study period, supporting the conclusion that the intervention had a significant positive impact on energy-saving behaviour in the building.
Further user interface development of e-Genie would improve the tool and future deployments would particularly benefit from additional support from FMs and the continued implementation of workshops alongside the tool. In addition, the commitment of key actors within the organization was highlighted within open-ended questions as important, supporting previous research (Staddon et al., Citation2016). The deployments in the present study experienced numerous technical issues, and given that user devices and software change quickly over time, it appears that user-facing digital energy tools in the workplace are likely to require ongoing technical support. This is a new challenge for energy monitoring in the workplace, given that previous BEMS could be installed and largely left alone.
Future research could consider developing use cases where issues do not currently exist, e.g. energy challenges. Digital energy visualizations for ordinary building users in the workplace may also be useful for supporting more advanced efficiency goals, e.g. shifting energy usage away from peak times. This could facilitate organizational responses to avoiding network charges for peak time useFootnote2 and reduce overall energy system demand requirements.
Conclusions
Overall, the utilization of e-Genie – an energy-feedback tool that promoted engagement with energy and actions to save energy – indicated moderate success with subsequent lower levels of electricity use observed and higher levels of self-reported energy concern and social energy behaviour. The deployment faced significant problems with engaging members of staff and indicated where engagement did occur: it was particularly around existing energy issues (e.g. thermal comfort). The implications of this research are that people need to be supported with their communication on the topic of energy, and taking action to save energy in the workplace. Social energy behaviour appears to be a particularly fruitful way of identifying and making changes to the way energy is used in workplaces, with the potential for large savings to be made.
Supplemental data.pdf
Download PDF (495.2 KB)Acknowledgements
We would like to thank the members of our advisory panel for providing insight, discussion and strategic direction including Michael Harrison (BEIS), Mike Summers (Arup), Neil Merrall (Siemens), Tom Hargreaves (UEA), Joseph Williams (UK Green Building Council), Mark Conner (University of Leeds), Jacky Pett, Simon Roberts (CSE), Mike Hazas (Lancaster University), Chris Large (Global Action Plan), Gunnar Stevens (University of Siegen), Frances Bowen (Bath University), and Chris Jones (Sheffield University). In addition, we acknowledge the time and efforts of our partner sites who allowed us to trial communications and interventions in their places of work. Without this support and engagement this research could not have been conducted.
Disclosure statement
No potential conflict of interest was reported by the authors.
ORCID
Alexa Spence http://orcid.org/0000-0003-4014-0430
Murray Goulden http://orcid.org/0000-0003-4005-8752
Ben Bedwell http://orcid.org/0000-0003-2948-032X
Rayoung Yang http://orcid.org/0000-0003-0071-3521
Additional information
Funding
Notes
1. HDDs are a commonly used industry measure indicating how much heating is needed. They are calculated by multiplying the extent to which outdoor temperature is lower than the set point, 15.5°C, by the length of time it was at that temperature and summing these time periods for the day. HDD data for the study period were obtained from www.degreedays.net/.
2. For example transmission use of system (TUOS) and distributed use of system (DUOS) are charges for using transmission networks to gain your electricity supply. By shifting use to off-peak hours, these charges can be reduced.
References
- Abrahamse, W., Steg, L., Vlek, C., & Rothengatter, T. (2005). A review of intervention studies aimed at household energy conservation. Journal of Environmental Psychology, 25(3), 273–291. doi: 10.1016/j.jenvp.2005.08.002
- Anderson, W., & White, V. (2009). Exploring consumer preferences for home energy display functionality. Bristol, UK: Centre for Sustainable Energy.
- Bandura, A. (2006). Guide for constructing self-efficacy scales. In F. Pajares & T. Urdan (Eds.), Self-efficacy beliefs of adolescents (pp. 307–337). Greenwich: Information Age Publishing.
- Becker, L. J. (1978). Joint effect of feedback and goal setting on performance: A field study of residential energy conservation. Journal of Applied Psychology, 63(4), 428–433. doi: 10.1037/0021-9010.63.4.428
- Bedwell, B., Costanza, E., & Jewell, M. (Oct, 2016). Understanding energy consumption at work: Learning from arrow hill. In Proceedings of the 19th ACM Conference on Computer Supported Cooperative Work & Social Computing, CSCW ‘16, New York, NY, USA: ACM.
- Bedwell, B., Leygue, C., Goulden, M., McAuley, D., Colley, J., Ferguson, E., … Spence, A. (2014). Apportioning energy consumption in the workplace: A review of issues in using metering data to motivate staff to save energy. Technology Analysis & Strategic Management. Special Issue of Smart Metering Technology & Society, 26, 1196–1211.
- BEIS. (2016). Heat in buildings. The future of heat: Non-domestic buildings. London, UK: HM Government.
- Bell, B., Toth, N., Little, L., & Smith, M. (2016). Planning to save the planet: Using an online intervention based on implementation intentions to change adolescent self-reported energy-saving behaviour. Environment and Behavior, 48, 1049–1072. doi: 10.1177/0013916515583550
- Boomsma, C., Goodhew, J., Pahl, S., & Jones, R. V. (2016). The feasibility of saving energy in challenging organisational contexts: Testing energy visualisation in a social services office in the United Kingdom. Energy Research & Social Science, 15, 58–74. doi: 10.1016/j.erss.2016.02.004
- Brandon, G., & Lewis, A. (1999). Reducing household energy consumption: A qualitative and quantitative field study. Journal of Environmental Psychology, 19, 75–85. doi: 10.1006/jevp.1998.0105
- Bull, R., Stuart, G., & Everitt, D. (2012). Seeing energy differently: Exploring the impact of a green ICT initiative at De Monfort University. Retrieved from http://greenview.dmu.ac.uk/uploads/final-project-report.pdf
- Carrico, A. R., & Riemer, M. (2011). Motivating energy conservation in the workplace: An evaluation of the use of group-level feedback and peer education. Journal of Environmental Psychology, 31, 1–13. doi: 10.1016/j.jenvp.2010.11.004
- Costanza, E., Bedwell, B., Jewell, M., Colley, J., & Rodden, T. (2016, May). ‘A bit like British weather, I suppose’ design and evaluation of the temperature calendar. In Proceedings of the 34th Annual ACM Conference on Human Factors in Computing Systems, CHI ‘16, New York, NY, USA: ACM.
- Costanza, E., Ramchurn, S. D., & Jennings, N. R. (2012, September). Understanding domestic energy consumption through interactive visualisation: A field study. In Proceedings of the 2012 ACM Conference on Ubiquitous Computing, Pittsburgh, US.
- Darby, S. (2006). The effectiveness of feedback on energy consumption: A review for DEFRA of the literature on metering, billing and direct displays. Oxford: Environmental Change Institute.
- Dixon, G. N., Deline, M. B., McComas, K., Chambliss, L., & Hoffmann, M. (2015). Saving energy at the workplace: The salience of behavioral antecedents and sense of community. Energy Research & Social Science, 6, 121–127. doi: 10.1016/j.erss.2015.01.004
- Ehrhardt-Martinez, K., Donnelly, K. A., & Laitner, S. (2010). Advanced metering initiatives and residential feedback programs: A meta-review for household electricity-saving opportunities ( Report No. E105). Washington, DC. Retrieved from http://www.energycollection.us/Energy-Metering/Advanced-Metering-Initiatives.pdf
- Fischer, C. (2008). Feedback on household electricity consumption: a tool for saving energy? Energy Efficiency, 1, 79–104. doi:10.1007/s12053-008-9009-7
- Giordano, V., Meletiou, A., Cavrig, C. F., Mengolini, A., Ardelean, M., Fulli, G., et al. (2013). Smart grid projects in Europe: Lessons learned and current developments. Luxembourg: European Commission.
- Gollwitzer, P. (1993). Goal achievement: The role of intentions. European Review of Social Psychology, 4, 141–185. doi: 10.1080/14792779343000059
- Gollwitzer, P. (1999). Implementation intentions: Strong effects of simple plans. American Psychologist, 54, 493–503. doi: 10.1037/0003-066X.54.7.493
- Goodhew, J., Pahl, S., Auburn, T., & Goodhew, S. (2015). Making heat visible: Promoting energy conservation behaviors through thermal imaging. Environment and Behavior, 47(10), 1059–1088. doi: 10.1177/0013916514546218
- Goulden, M., & Spence, A. (2015). Caught in the middle: The role of the facilities manager in organisational energy use. Energy Policy, 85, 280–287. doi: 10.1016/j.enpol.2015.06.014
- Gupta, R., Barnfield, L., & Gregg, M. (2017). Exploring innovative community and household energy feedback approaches. Building Research & Information, 1–16. doi: 10.1080/09613218.2017.1356130
- Handgraaf, M. J., Van Lidth de Jeude, M. A., & Appelt, K. C. (2013). Public praise vs. Private pay: Effects of rewards on energy conservation in the workplace. Ecological Economics, 86, 86–92. doi: 10.1016/j.ecolecon.2012.11.008
- Huizenga, C., Abbaszadeh, S., Zagreus, L., & Arens, E. (2006). Air quality and thermal comfort in office buildings: Results of a large indoor environmental quality survey. In Proceedings of healthy buildings 2006 (Vol. III, pp. 393–397). Lisbon.
- Leygue, C., Ferguson, E., & Spence, A. (2017). Saving energy in the workplace: Why and for whom? Journal of Environmental Psychology, 53, 50–62. doi: 10.1016/j.jenvp.2017.06.006
- McCalley, L. T., & Midden, C. J. H. (2002). Energy conservation through product-integrated feedback: The roles of goal-setting and social orientation. Journal of Economic Psychology, 23, 589–603. doi: 10.1016/S0167-4870(02)00119-8
- Murakami, S., Levine, M. D., Yoshino, H., Inoue, T., Ikaga, T., Shimoda, Y., … Fujisaki, W. (2006). Energy consumption, efficiency, conservation and greenhouse Gas mitigation in Japan’s building sector. Berkely, CA: Lawrence Berkely National Laboratory.
- Murtagh, N., Nati, M., Headley, W. R., Gatersleben, B., Gluhak, A., Imran, M. A., & Uzzell, D. (2013). Individual energy use and feedback in an office setting: A field trial. Energy Policy, 62, 717–728. doi: 10.1016/j.enpol.2013.07.090
- Pahl, S., Goodhew, J., Boomsma, C., & Sheppard, S. R. (2016). The role of energy visualization in addressing energy use: Insights from the EVIZ project. Frontiers in Psychology, 7, 127. doi: 10.3389/fpsyg.2016.00092
- Ruepert, A., Keizer, K., Steg, L., Maricchiolo, F., Carrus, G., Dumitru, A., … Moza, D. (2016). Environmental considerations in the organizational context: A pathway to pro-environmental behaviour at work. Energy Research & Social Science, 17, 59–70. doi: 10.1016/j.erss.2016.04.004
- Siero, F. W., Bakker, A. B., Dekker, G. B., & Van den Burg, M. T. C. (1996). Changing organisational energy consumption behaviour through comparative feedback. Journal of Environmental Psychology, 16, 235–246. doi: 10.1006/jevp.1996.0019
- Spence, A., Leygue, C., Bedwell, B., & O’Malley, C. (2014). Engaging with energy reduction: Does a climate change frame have the potential for achieving broader sustainable behaviour? Journal of Environmental Psychology, 38, 17–28. doi: 10.1016/j.jenvp.2013.12.006
- Staddon, S., Cycil, C., Goulden, M., Leygue, C., & Spence, A. (2016). Intervening to change behaviour and save energy in the workplace: A systematic review of available evidence. Energy Research and Social Science, 17, 30–51. doi: 10.1016/j.erss.2016.03.027
- Staats, H., Harland, P., & Wilke, H. A. M. (2004). Effecting Durable Change: A team approach to improve environmental behaviour in the household. Environment and Behaviour, 36, 341–367.
- Steg, L. (2008). Promoting household energy conservation. Energy Policy, 36, 12, 4449–4453. doi:10.1016/j.enpol.2008.09.027
- Yun, R. (2014). Persistent workplace plug-load energy savings and awareness through energy dashboards: Feedback, control, and automation. In Conference on Human Factors in Computing Systems – Proceedings (pp. 331–334). New York: Association for Computing Machinery.