
ABSTRACT
This paper reports the results of a comprehensive indoor environmental quality (IEQ) evaluation conducted in seven office buildings at an Australian university. A mix of objective and subjective assessments was carried out and a total of 519 staff participated in the survey from various non-academic departments. Three types of buildings were included in this study: ‘Heritage listed’ (c.1880–1890s), ‘Conventional’ (c.1960–1980s) and ‘Modern’ (post 2000) office buildings. Although the measured IEQ conditions were relatively good with no significant fluctuation across the selected buildings, the discrepancy between objective IEQ data and subjective occupant evaluations was noted. The Modern building type designed with fully double-glazed façades showed the highest levels of overall comfort and satisfaction and perceived productivity, whereas the Conventional building type constructed during the late 20th-century period, notable for deep floor plates, had the lowest. The heritage listed type buildings had lower window to wall ratios, yet displayed improved occupant satisfaction across all IEQ areas over the conventional type buildings. The results support that building renovation and regular maintenance can improve occupant comfort and satisfaction within offices. The findings could be useful for property managers looking for strategies to improve the performance of their building stock.
Introduction
A typical university campus contains a large number of buildings in specific locations, accommodating multiple users and activities. Subsequently, university buildings often have complex, multi-use and heterogeneous nature, containing a range of spaces (Lawrence et al., Citation2019). Although university building management has prioritized reduction of CO2 emissions and improvement of energy efficiency by focusing mainly on monitoring energy use and effective energy-saving strategies, occupancy diversity has been a critical factor in building management in order to understand energy use patterns and predict occupancy schedules (Davis & Nutter, Citation2010; Yoshida et al., Citation2017). Furthermore, a large body of research on occupant comfort and satisfaction has been conducted in educational buildings to ensure acceptable indoor environmental quality (IEQ) as energy efficiency does not automatically improve indoor conditions. While some focused on thermal comfort as one of the most influential IEQ factors on occupants, thereby adopting an objective and subjective mixed approach (Lawrence et al., Citation2019; Lawrence & Keime, Citation2016; Sarbu & Pacurar, Citation2015), others looked into occupants’ subjective evaluation on university campus facilities and non-physical environmental and subjective factors such as cleanliness and views (Castilla et al., Citation2017; Kärnä et al., Citation2015). Studies have also been extended to include more comprehensive IEQ factors such as thermal comfort, indoor air quality, lighting, acoustics and space layout and their impact on occupant comfort, health and productivity in the context of best-practice sustainability and well-being certifications in university buildings (Hedge et al., Citation2014; Hua et al., Citation2014; Lee et al., Citation2012).
Indoor environmental quality (IEQ) is the combination of indoor environment components that interact with users of the environment. It is largely characterized by four environmental categories including thermal comfort, indoor air quality (IAQ), lighting and acoustics (Larsen et al., Citation2020). Thermal comfort and IAQ have been identified as the two most important aspects of IEQ that receive considerable attention by building designers and occupants (Huizenga et al., Citation2006; Humphreys, Citation2005), demonstrating that satisfaction with air quality and thermal comfort is generally more important than satisfaction with the level of lighting or noise. More recently, specific IEQ factors and their association with overall comfort or satisfaction have been explored so as to determine more influential factors in the built environment. A dominant approach of previous IEQ studies is to collect a large set of cross-sectional and/or longitudinal data with less concerning physical building conditions (e.g. Bae et al., Citation2020; Bluyssen et al., Citation2016; Frontczak et al., Citation2012; Kim & de Dear, Citation2012; Sakellaris et al., Citation2016). This research approach has contributed to identify which IEQ factors positively or negatively influence overall comfort and satisfaction, presenting the degrees of their association or the categories of their sub-groups.
Providing good quality indoor environments in buildings has become increasingly important with people spending significant quantities of time indoors and becoming more aware of potential air quality threats. Considering the confined nature of the built environment, the concentration levels of indoor pollutants and carbon dioxide may build up higher than outdoor levels (Jones, Citation1999; Rudnick & Milton, Citation2003). Building elements, such as materials and finishes, thermal conditions, air quality, lighting and acoustics, are known to influence physical, mental and social wellbeing of building occupants. Extensive research has established that the impact of IEQ on the health and productivity of its occupants (Al Horr et al., Citation2016; Chen et al., Citation2020; Sensharma et al., Citation1998; Seppänen & Fisk, Citation2006). It has been found that IEQ of an office building can influence the physiological and psychological health of the employees which can interfere with their task performance, thereby influencing their overall productivity (Tanabe et al., Citation2009; Vischer & Wifi, Citation2015). Besides these, other factors such as privacy, communications, social relationships, office system organization, and management can influence work productivity (Clements-Croome, Citation2018). Thus, it is critical to provide healthier and supportive spaces with users, enabling them to conserve focus and energy for their work rather than expending it to cope with adverse environmental conditions (Roskams & Haynes, Citation2020).
There has been an increasing trend of designing and building open-plan offices globally (Kang et al., Citation2017). The open-plan office configuration enables reductions in construction, fit-out and facility management costs, but is offset by higher occupant density driving higher ventilation loadings (Veitch et al., Citation2007), with related increased energy costs. This trend continues despite research to indicate that acoustics is one of the strongest determinants of workplace satisfaction in open-plan offices (Abbaszadeh et al., Citation2006; Kim & de Dear, Citation2013). Unwanted noise can contribute to annoyance and dissatisfaction among workers in open plan offices (Kim & de Dear, Citation2013; Pierrette et al., Citation2015) and particularly in university offices (Braat-Eggen, Citation2020; Braat-Eggen et al., Citation2019). Furthermore, noise can have a direct impact on productivity. Rasheed et al. (Citation2019) found that noise was the only IEQ factor that can predict both comfort and productivity in five different office types, and Kang et al. (Citation2017) identified the quality of acoustic environment had the greatest influence on productivity among the key IEQ factors. Within university settings, studies of occupants of open-plan offices have interestingly recorded predominantly negative feedback, particularly within those buildings that have sought to impose open-plan office configuration fit-outs on full-time academic staff (Baldry & Barnes, Citation2012; Lansdale et al., Citation2011; Parkin et al., Citation2011; Van Marrewijk & Van den Ende, Citation2018; Wilhoit et al., Citation2016). Furthermore, a recent study conducted in a university administrative building identified that employees in enclosed private offices were more satisfied with IEQ factors than those in other types of shared offices. It also established a positive link between employees’ environmental satisfaction and self-reported performance in the enclosed private office (Motalebi et al., Citation2019).
Office layout influences occupant distraction and interaction in open-plan offices. Haynes (Citation2007) posited evidence that distraction may have the greatest negative impact on perceived productivity, and that interaction has the most positive effect on perceived productivity. Office workers want freedom to perform distraction-free solo work when required while having opportunities for informal interaction with colleagues on their own terms (Haynes, Citation2007; Haynes et al., Citation2017; Heerwagen, Citation2000). The literature suggests that occupants are more readily distracted in an open-plan office than in a cellular office (Bernstein & Turban, Citation2018; Brennan et al., Citation2002; Kim & de Dear, Citation2013), with numerous studies confirming deleterious effects of open-plan environments on occupant health, wellbeing and productivity (Richardson et al., Citation2017). Even though a number of studies have investigated the effect of design on occupant satisfaction and productivity, the results vary and depend on various factors such as the type of work (Tanabe et al., Citation2009) and motivation (Davis et al., Citation2020).
Although university buildings accommodate various non-academic functions so as to support its institutional goals, much less attention has been paid to these spaces compared to academic spaces such as lecture theatres and laboratories in the IEQ research. In addition, university campuses tend to have a range of properties aged from greater than a hundred years, to more recent innovative projects, and it is crucial to manage building performance across all properties regardless of building age as it can impact occupant performance. This paper aims to report the results of a comprehensive indoor environmental quality (IEQ) evaluation conducted in seven office buildings in an Australian university, and further examine if any differences exist in the occupant perception of the offices according to building age and physical building conditions.
Methodology
A total of seven office buildings predominantly used to accommodate professional (non-academic) staff were selected in an urban Australian university campus. The university campus is located in Melbourne, the state capital of Victoria, whose local climate is classified as a temperate oceanic climate (Cfb). The seven office buildings were selected in respect of building age and physical conditions and subsequently categorized into three types: ‘Heritage listed’ (c.1880–1890s), ‘Conventional’ (c.1960–1980s) and ‘Modern’ (post 2000) office buildings. A single or multiple open-plan offices were selected in each selected building according to its occupancy and physical conditions such as office level and workspace area and to collect a mix of objective and subjective IEQ performance data (refer to ). Prior to the distribution of the occupant survey, an email communique was released to all staff in each selected building indicating that a survey was about to be conducted. A team of four people were then tasked with hand-delivering the survey and, if the occupants were seated at their desks, provided an introduction to the survey’s contents, reasoning, and use. Occupants were also presented with a QR code should they prefer to conduct the survey electronically. Hard-copy surveys along with an additional small colourful card indicating the survey’s intent, were left on all unoccupied workstations. The small card indicated that the researchers would be returning within one week to collect the completed survey. This direct, flexible, and friendly contact with the building occupants encouraged greater survey completions and quality of results (Preiser et al., Citation1988; Preiser & Vischer, Citation2006).
Subjective measurement
The tailored questionnaire was developed to collect the attitudes, perceptions and beliefs of the employees and their subjective responses to IEQ performance, and also included questions related to their perceived productivity. The questionnaire took around 10–15 min to complete and consisted of five sections. The first section collected general information on the respondents’ job activities and workplace. It is noteworthy that a six-point Likert-type scale without a neutral position was adopted in this section so as to force respondents to provide a response. This measurement seems to be preferred for measuring respondents’ attitudes with direction (disagree to agree) and intensity (1 to 6). The second section required the respondents to rate the indoor environment conditions of their workplace including thermal comfort, indoor air quality, noise and lighting levels on a scale of 1 to 7. This was followed by the third section which included questions to rate the spatial comfort and amenities of their workplace on a scale of 1 to 7. Section 4 included common health symptoms associated to the sick building syndrome (Fisk et al., Citation2009; Wargocki et al., Citation1999) and required respondents to rate them on a scale of 1 to 5 from never experiencing to always experiencing the symptoms. The questionnaire was distributed to a total of 1000 professional (non-academic) staff electronically or in hard copy and a total of 535 questionnaires were returned among them, representing 53.5% of response rate. It is a general rule of thumb that a response rate of at least 50% can be acceptable to reduce non-response bias in the satisfaction research (Hill et al., Citation2017). Furthermore, a web-based IEQ research looked for trend in the data collected in more than 70 buildings and found no statistically significant relationship between response rate and occupant satisfaction levels (Zagreus et al., Citation2004). A total of 519 occupant responses from the selected buildings were analysed in the present study. The research project was reviewed and approved by the College Human Ethics Advisory Network (CHEAN) at RMIT University (Project number: DSC CHEAN A 22127-05/19).
Objective measurement
During the survey, measurements of the indoor environmental conditions including air temperature, globe temperature, relative humidity, air velocity, CO2 concentration levels and lighting levels were taken using a portable IEQ datalogger Testo 480. The instrument was programmed to record data at 5-minute sampling intervals (ASHRAE, Citation2017) and installed at a height of 1.2 m in order to correspond to the breathing zone at seated position. Two sets of identical instruments were placed at selected locations in each office. They were located away from doors and windows, avoiding being directly underneath supply air diffusers. The data was recorded for one week in each office space. Spot measurements of sound levels were also conducted from 5 to 38 locations in each office depending on the workspace area and configuration using Testo 816 sound level meter. Measurements were conducted over four months, primarily in the winter period (June 2019 to September 2019). The instrument specification is presented in and the typical layout of instrument set-up in the office spaces is shown in .
Figure 1. IEQ measurement instrumentation.
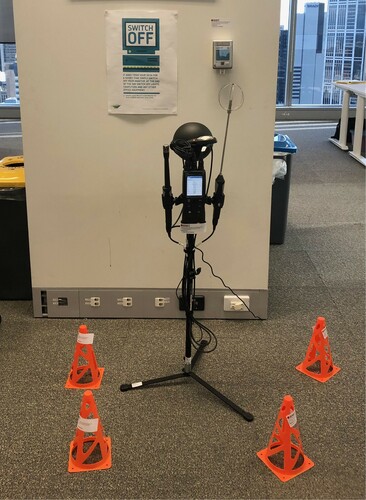
Table 1. Instrument description.
It is noteworthy that the occupant survey was given priority and the indoor environmental conditions were monitored to complement and enhance the interpretation of the survey results in the present study. The IEQ measurements and occupant survey were conducted in natural workplace settings with cross-sectional design, and they were not intended to be a spatio-temporally specific study.
Results
Building characteristics
The physical conditions of the seven buildings including the year of built, number of floors, gross floor area (GFA), the level of the selected office, workspace area, occupant density, ceiling height, building depth and the function of the office are shown in . Occupant density was calculated as the total occupiable area divided by the number of workstations in the selected offices. Other than workspace such as meeting rooms, breakout rooms and kitchen seating was not included as potential workstations. The buildings can be categorized into three types according to the building age and other physical conditions. Buildings A and B are heritage listed and low-rise buildings constructed in the year of 1891 and 1860 respectively and they can be categorized as Type 1 (Heritage listed). Buildings C, D, E and F were constructed between 1960 and 1984 and are conventional mid to high-rise buildings (Type 2 Conventional). Building G was constructed in 2005 and is a modern high-rise office building and the newest of all the buildings under investigation (Type 3 Modern). shows the facades of the three types of buildings and details the construction types and HVAC systems.
Figure 2. Facades of three building types. Image source: RMIT University.
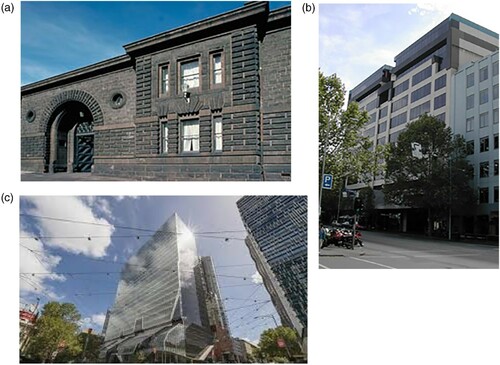
Table 2. Building characteristics.
Table 3. Building envelope and HVAC system details.
shows the type of HVAC system and distribution, type of construction and glazing, and window to wall ratio. Although the building services differed in configuration, all office environments were mechanically ventilated and heated through centralized HVAC systems. It seems that the window to wall ratio increases in accordance with the building age, reporting that Type 1 buildings show only 10% of window area.
Indoor environmental conditions
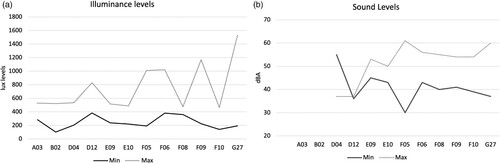
The measured indoor environmental conditions are plotted in and . shows the air temperature, relative humidity (RH) and CO2 concentration in the selected buildings during office hours on weekdays. The minimum temperature ranged between 18.8°C and 22.1°C and maximum temperature ranged between 22.4°C and 27.7°C. The minimum and maximum relative humidity ranged between 24.2–33.7% and 38.2–48.1%, respectively. The temperatures in all selected offices were mostly compliant with the thermal comfort standards (ASHRAE Standard 55, ISO 7730) for winter and some occasional peaks in temperature were observed. However, relative humidity (RH) was much lower than the recommended ranges (30–70%). D04 (min. 27.6% and max.42.5%) and F10 (min. 24.2% and max.43.0%), both conventional type buildings (Type 2) demonstrated the lowest minimum and maximum RH. CO2 concentration levels ranged between 369 and 1086 ppm, with the maximum of up to 1086 ppm in F10 (Conventional building type). One of the heritage listed building type, B02 also showed a high level of CO2 concentration of 1060 ppm. When CO2 concentration levels exceed 1000 ppm, it indicates insufficient ventilation and unacceptable conditions in relation to odours removal (ASTM, Citation2018). Lighting and sound levels were locally measured in the selected offices in respect of workstation layout, proximity to windows and use of internal blinds (). The illuminance levels demonstrated high variations ranged from 102 to 1526 lux, reporting the maximum levels of illuminance were well above the recommendation of 320 lux by the Standards Australia (AS/NZS, Citation1680.Citation1, Citation2006). Sound levels varied from 30 to 61 dBA, depending on the types of work performed and workstation occupancy. The Standards Australia (AS/NZS, Citation2107, Citation2016) recommends background noise levels for open-plan offices to be 40–45 dBA.
Figure 3. Temperature and RH (a) and (b) CO2 concentration measured inside the offices.
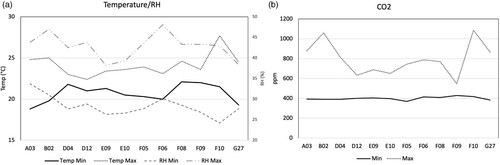
Figure 4. Lighting levels (a) and sound levels (b).
Note. No sound levels were measured in the buildings A and B.
For a sound understanding of thermal comfort as one of the most influential IEQ factors on occupants, predicted mean vote (PMV) and predicted percentage of dissatisfied (PPD) were calculated across the selected offices using the CBE thermal comfort tools (Tartarini et al., Citation2020). demonstrates the PMV and PPD values and thermal comfort compliance with the ASHRAE Standard 55-2020. Operative temperature was calculated based on the measured indoor conditions, and the metabolic rate of 1.2 met for sedentary office work and the clothing level of 0.61 clo for trousers and long-sleeve shirt were used based on the observations through site visits during the indoor condition monitoring periods. Two third of the selected offices met the compliance, showing ‘neutral’ sensation. Four offices located in the conventional type buildings (Type 2), however, did not comply with the ASHRAE Standard 55-2020, demonstrating over 10% dissatisfaction with thermal comfort. They reported ‘slightly cool’ sensation with the range of 12 to 16% of PPD. It is noted that the typical winter indoor clothing level for office workers can be 1.0 clo, however, it was observed that most of the occupants in this study had lighter clothing level such as long-sleeve shirt and trousers, taking off the winter outer jacket while working inside the offices. When increasing the clothing level of 0.96 clo (Jacket, long-sleeve shirt and trousers), all offices except D4 (PMV = 0.78, PPD = 18%, slightly warm) comply with the ASHRAE Standard 55-2020.
Table 4. PMV, PPD and thermal comfort compliance (met: 1.2, clo:0.61).
Occupant survey
A total of 519 responses were collected from the three types of buildings: Type 1 ‘heritage listed’ (N = 33), Type 2 ‘conventional’ (N = 418) and Type 3 ‘modern’ (N = 68). The demographic characteristics and workspace setting of the samples are shown in Table S1 in the supplementary files. 43.3% of the respondents were male and 56.3% of them were female. The response from the age group of 35–44 years was the largest accounting for 33.3% of the respondents, followed by the age group of 25–34 (28.0%) and the age group of 45–54 (25.0%) of completed surveys. Most of the respondents (83.4%) worked full time while 8% were part-time and 7% were working on casual basis. Normal distributions of the variables were tested and confirmed including normality within groups (building types).
Occupant perception of IEQ and perceived productivity
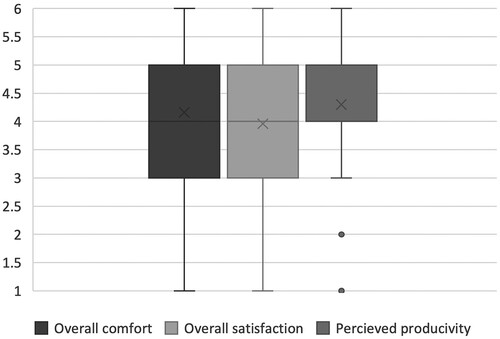
The occupant perception of the indoor environmental quality across thermal comfort, IAQ, noise, lighting and spatial comfort was measured on a scale of 1 to 7, with 4 representing a neutral position. The combined data from the three types of buildings (N = 519) were analysed to outline the occupant perception of indoor condition parameters () and overall comfort and satisfaction with the office and perceived productivity (). The mean scores of each variable showed near the neutral position (), reporting that occupants felt slightly noisy (M = 4.68). Overall noise was reported to be an issue by approximately half of the respondents with 28.3% reporting it to be slightly noisy, approximately 21.3% reporting it to be noisy and approximately 6.6% reporting it to be too noisy across all the buildings as shown in Figure S1 in supplementary files. The measured sound levels ranged from 30 dBA in quiet places to 61 dBA in some places where people were talking ((b)). Noise is one of the most commonly reported issues in an office environment, particularly in open-plan offices (Abbaszadeh et al., Citation2006; Kang et al., Citation2017). The results of this study confirm the reported results of previous studies. presents overall comfort, overall satisfaction and perceived productivity in their offices. As stated above, they were measured on a six-point Likert-type scale without a neutral position to force respondents to provide a response. It seems that the respondents felt comfortable and satisfied with their office environment and their office enabled them to work productively, reporting that the mean scores of overall comfort, overall satisfaction and perceived productivity were 4.16, 3.96 and 4.30 respectively ().
Figure 5. Occupant perception of indoor condition parameters.
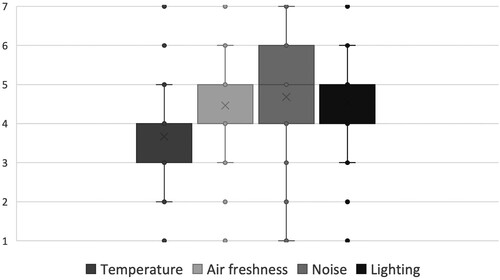
Figure 6. Overall comfort and satisfaction and perceived productivity.
Figures S1 and S2 demonstrate the frequencies of the occupant responses across indoor environmental quality including spatial comfort and amenities in detail. With respect to thermal sensation, the respondents generally felt comfortable, reporting that 41.3% of them voted neutral (response for 4) for air temperature, 11.8% and 19.2% felt slightly hot and slightly cold respectively (Figure S1). Some concerns were however raised from the occupants of Building F (Type 2) for the office environment to be too cold, reporting that ‘biggest issues in the building are constant lift outages and temperature – always too cold’ (Respondent from Building F). It is supported by the PMV/PPD calculation presented earlier that two offices in Building F (F06 and F09) did not comply with the ASHRAE Standard 55, reporting 12% of PPD (). The perception of IAQ was assessed across air freshness (fresh to stale), humidity (dry to humid), air movement (still to draughty) and odour (odourless to smelly). While an overall 21.8% of the occupants found the air of their offices to be relatively fresh (responses for 1–3), about half of the respondents (47.3%) found it relatively stale (responses for 5–7). The rest of the respondents expressed a neutral condition, neither fresh nor stale (30.9%). While 42.6% of the respondents felt neither dry nor humid (response for 4), about half of the respondent felt dry in their office (49.7%, responses 1–3). This can be explained that the measured RH was relatively low ranged between min. RH of 24.2–33.7% and max. RH of 38.2–48.1%. In regard to the overall quality of lighting, approximately 45% of the respondents voted neutral (response for 4), reporting neither very dark nor very bright. It is also noteworthy that the respondents received more illuminance through artificial light than natural light, reporting that they had less natural light (48.4%, responses for 1–3) and more artificial light (47.4%, responses for 5–7). Although the respondents expressed overall spatial comfort including the amount of individual workspace, furniture, office equipment and other amenities, the amount of spaces, particularly team space, personal and shared storage, did not seem to be sufficient (Figure S2). Furthermore, they expressed less satisfaction with visual privacy, general décor, plants/greenery and views to outside. This will be further analysed and interpreted by physical building conditions.
Correlations between occupant perception and measured indoor environmental conditions
To evaluate the size and direction of the relationships between subjective and objective assessments of the indoor conditions, Pearson’s product-moment correlation coefficient (r) was calculated (). Pearson’s correlation coefficient (r) is a measure of the strength and direction of a relationship between two continuous variables, and it ranges from −1 (a perfect negative relationship) to +1 (a perfect positive relationship). Any probability falls below 0.05 (p < 0.05) is usually considered as being statistically meaningful and indicative of genuine effect in the population (Field, Citation2018). The descriptors used in the correlation analysis are those provided by de Vaus (Citation2002): Trivial (0.01–0.09); Low to moderate (0.10–0.29); Moderate to substantial (0.30–0.49); Substantial to very strong (0.50–0.69); Very strong (0.70–0.89) and Near perfect (0.90–0.99). demonstrates the correlations between subjective and objective assessments in the indoor environment. Occupants’ thermal sensation showed low to moderate correlations with measured ‘air temperature’ (r = 0.198, p < 0.001) and ‘CO2 concentration’ (r = 0.265, p < 0.001). The occupant perception of temperature stability also showed a low to moderate correlation with ‘air velocity’ (r = 0.122, p < 0.01). Interestingly, the measured CO2 concentration did not show any statistically significant correlations with the occupant perception of the air quality variables such as air freshness and odour. Rather, measured RH showed a low to moderate correlation with the occupant perception of odour (r = 0.121, p < 0.01). The occupant perception of noise showed a low to moderate correlation with measured sound level (r = 0.127, p < 0.01).
Table 5. Correlations between subjective and objective assessments.
Difference between the building types
In order to detect any differences existed in the occupant perception according to the three building types, one-way analysis of variance (ANOVA) test was conducted using SPSS Statistics. For a comparison of more than two groups, ANOVA can be the appropriate method rather than directly comparing many group means (Kim, Citation2014). One-way ANOVA assumes that data is normal and all groups share a common standard deviation even if they have different means. Normal distributions of the data were confirmed including normality within groups (building types), however, it was found that a number of variables did not meet the assumption of equal variance (Levene’s test). When group sizes are unequal, violations of the assumption of homogeneity of variance can cause serious consequences (Field, Citation2018). Due to the unequal sample size of each group and the fact that the assumption of homogeneity of variance was questionable, Welch’s F test was selected as an alternative of the traditional one-way ANOVA as it can be used regardless of the homogeneity of variance.
Indoor environment
demonstrates the Welch’s F-statistic for the occupant perception of indoor environment by three building types. Larger F-statistic implies that means of the groups are largely different from each other, accordingly, reporting lower p-values. The respondents reported statistically significant difference in ‘thermal sensation’, F(2, 77.8) = 7.160, p = 0.001, ‘air movement’, F(2, 66.9) = 4.752, p = 0.012, ‘air freshness’, F(2, 68.5) = 3.574, p = 0.033, ‘odour’, F(2, 69) = 6.985, p = 0.002 ‘noise overall’, F(2, 66.2) = 4.925, p = 0.010, ‘noise from inside the building’, F(2, 68.2) = 4.744, p = 0.012, ‘noise from outside the building’, F(2, 69.6) = 6.633, p = 0.002 and ‘lighting from natural light’, F(2, 70.9) = 9.935, p = 0.000, among at least one of the three building types. An adjusted omega squared (est. ω2) was calculated to measure the effect size for the ANOVA tests. It has been suggested that omega squared (ω2) values of 0.01, 0.06 and 0.14 represent small, medium and large effects respectively (Field, Citation2018; Kirk, Citation1996). The effect sizes for the overall ANOVA were between 0.01 and 0.03 in the indoor environment.
Table 6. Welch’s F test for indoor environment by three building types.
To find out where the differences between groups lie, post hoc tests were carried out to compare every group mean to all others. The Games-Howell post hoc test was selected to identify significant differences between groups. Like Welch’s F test, the Games-Howell post hoc test does not require each group to have equal variance and it is accurate when sample sizes are unequal (Field, Citation2018). demonstrates the mean scores of each building type. Type 2 reported statistically significant difference in ‘thermal sensation’ between other two types, reporting that the respondents felt slightly colder than neutral (M = 3.58). As stated in the indoor environmental conditions section, although the measured air temperature was likely to fall within the recommended temperature ranges, the PMV/PPD calculations indicated that some offices in the type 2 buildings did not meet the thermal compliance, which could explain this result. Type 2 and Type 3 showed statistically significant differences in several indoor environment variables, ‘air movement’, ‘air freshness’, ‘odour’ and ‘noise overall’, while Type 1 did not show any statistically significant difference between other two types. Although the responses from both Type 2 and Type 3 were towards the same direction from the neutral point, Type 2 reported ‘less still’ (Md = 0.523), ‘more stuffy’ (Md = 0.446), ‘less odourless’ (Md = 0.732) in indoor air quality, ‘more noisy’ (Md = 0.414) and ‘less natural light’ (Md = .−0.796) compared to Type 3. Overall, Type 2 presented lower levels of indoor air and acoustic quality than Type 3. Surprisingly, despite the difference identified in Welch’s F test (), the post hoc test was not able to find out any statistically significant difference in noise from inside the building among those three types. However, Type 3 was likely to be quieter from outside noise (M = 2.86) than the other two types.
Table 7. Post hoc results for indoor environment by three building types.
Spatial comfort and amenity
demonstrates the Welch’s F-statistic for the spatial comfort and amenities by three building types. As stated above, larger F-statistic indicates that means of the groups are greatly different from each other, accordingly, reporting lower p-values. Interestingly, most of the variables related to spatial comfort and amenities showed statistically significant difference among three building types. To be specific, the respondents reported high significance (p < 0.001) in ‘spatial comfort overall’, F(2, 73.4) = 15.968, p = 0.000, ‘general décor’, F(2, 70.1) = 16.694, p = 0.000, ‘amenities overall’, F(2, 72.1) = 46.601, p = 0.000, ‘views to outside’, F(2, 67.0) = 49.754, p = 0.000, ‘internal signage’, F(2, 61.2) = 15.120, p = 0.000, ‘refreshment facilities’, F(2, 66.3) = 22.174, p = 0.000, ‘security’, F(2, 69.1) = 26.008, p = 0.000, ‘safety provision’, F(2, 67.3) = 22.190, p = 0.000, ‘general tidiness’, F(2, 66.0) = 13.995, p = 0.000, ‘general cleanliness’, F(2, 67.6) = 17.597, p = 0.000. The effect sizes for the overall ANOVA (est. ω2) were between 0.02 and 0.16 in the spatial comfort and amenity, interestingly, those variables related to spatial comfort and amenities demonstrated statistically significant differences among the three groups with larger effects than the variables related to indoor environment.
Table 8. Welch’s F test for spatial comfort and amenities by three building types.
To find out where the differences among three building types lie, post hoc tests were carried out to compare every group mean to all others. demonstrates the mean scores of each building type. In general, statistically significant differences were found between Type 2 and Type 3, reporting that Type 3 expressed higher levels of comfort and satisfaction in the workplace than Type 2, ‘spatial comfort overall’ (Md = 0.836), ‘personal storage’ (Md = 0.453), ‘chair’ (Md = 0.559), ‘plant/greenery’ (Md = 0.706), ‘internal signage’ (Md = 0.908), ‘security’ (Md = 1.129) and ‘general tidiness’ (Md = 0.895). Type 1 did not show any statistically significant difference in those variables between the two groups, being in the in-between status. Type 2 showed less satisfaction with amenities including ‘general décor’ (M = 3.37), ‘amenities overall’ (M = 3.61) and ‘general cleanliness’ (M = 4.08) and Type 3 presented high level of satisfaction with ‘refreshment facilities’ (M = 5.15) and ‘safety provision’ (M = 5.45). More interestingly, every group demonstrated statistically significant difference in ‘views to outside’. Type 3 expressed the most satisfaction (M = 5.66), followed by Type 1 (M = 4.60) and Type 2 showed the least satisfaction (M = 3.54). This can be interpreted by the window to wall ratio and building depth. Type 3 shows the largest glazing area (88%) and Type 1 presents the shallow building depth of 3–5 m from perimeter to core.
Table 9. Post hoc results for spatial comfort and amenities by three building types.
Overall comfort, satisfaction and perceived productivity
To examine if there is any difference in overall comfort, overall satisfaction and perceived productivity in the workplace among three building types, the Welch’s F test was conducted (). The Welch’s F-statics was significant in all three variables, ‘overall comfort’, F(2, 74.1) = 16.407, p = 0.000, ‘overall satisfaction’, F(2, 72.9) = 22.248, p = 0.000 and ‘perceived productivity’, F(2, 74.7) = 6.608, p = 0.002, meaning that the respondents reported statistically significant difference in these variables among at least one of the three building types. Not surprisingly, Type 2 showed less overall comfort (M = 4.04) and overall satisfaction (M = 3.82) than Type 1 and Type 3 (), being consistent with the results of thermal sensation, general décor, amenities overall, views to outside and general cleanliness (refer to and ). Furthermore, Type 3 reported higher perceived productivity (M = 4.68) than the other two types. The effect sizes for the overall ANOVA (est. ω2) were between 0.02 and 0.08 in the overall comfort, satisfaction and perceived productivity.
Table 10. Welch’s F test for overall comfort and satisfaction in the workplace.
Table 11. Post hoc results for overall comfort and satisfaction by three building types.
Discussion
There has been increasing effort to understand the discrepancy between objective IEQ data and subjective occupant evaluations in the field study. Researchers identified a number of reasons such as lower requirements in the technical standards than occupant expectation (Fanger, Citation2000), less consideration of individual differences and preferences (de Dear & Brager, Citation1998; Humphreys, Citation2005) and combined effects between IEQ factors and building design (Pellerin & Candas, Citation2003, Citation2004). Technical standards and guidelines for building performance have been developed based on average values for large population and derived from experiments undertaken in climate chambers. Although these early standards and guidelines have gradually shifted from universal acceptability towards adaptability, there seem to be interactions between IEQ factors that are simultaneously present in real life. The results of this study demonstrated no clear association between measured IEQ and occupant evaluation. Although the subjective evaluations are likely to be consistent with the objective measurements, the occupant perceptions of the indoor environment seem to be not always correlated to the corresponding indoor environmental parameters of the buildings (Refer to ). Furthermore, some subjective evaluations tend to show stronger correlations with other environmental parameters (e.g. thermal sensation – CO2 concentration, odour – RH). Lou and Ou (Citation2019) found no significant differences in the subjective evaluation between two types of open-plan offices despite significant difference in the physical measurements of personal space and temperature. The discrepancy between subjective and objective evaluations can be further supported by more recent research aimed to test the relationship between objective IEQ and subjective experiences of comfort (Roskams & Haynes, Citation2020). The authors reported that predicted associations between measured IEQ and occupant environmental satisfaction were not supported except temperature and thermal comfort. They, however, found a strong association between environmental satisfaction and self-rated productivity, reporting acoustic comfort had the strongest impact on self-rated productivity (Roskams & Haynes, Citation2020). The differences between objective measurements and subjective evaluations have long been supported by literature, stressing that occupant perceptions are influenced by not only physical environment but also other factors such as social and cultural impacts, organizational aspects and individual factors (de Dear, Citation2004; Gupta et al., Citation2020; Roskams & Haynes, Citation2020; Vischer, Citation2005).
It is also noteworthy that measured indoor conditions did not show a significant fluctuation across the selected buildings, reporting that they fell within the acceptable ranges. It is because of the centralized mechanical HVAC systems that can maintain a universally acceptable condition. In addition, the uniformity of the physical conditions was observed in large open-plan offices where the occupants had less control over their environment due to the centrally controlled mechanical ventilation systems, lighting schemes and standardized workstations. This could lead to less difference in the occupant perception, thus no clear association between measured IEQ and occupant evaluation. Despite the uniform lighting scheme, some variations in lighting levels were observed during the field study. Additional spot measurements were taken in respect of the workspace area and configuration in each selected office to collect more reliable data. Previous studies pointed out that taking spot measurements of IEQ at indicative locations in combination with occupant questionnaires can be problematic as neither the IEQ measurements nor the respondents’ perceptions are spatio-temporally specific. Researchers have proposed to capture ‘right-here-right-now’ assessments of the workplace environment, conducting occupant survey multiple times with continuous IEQ measurements (Candido et al., Citation2016; Choi & Lee, Citation2018; Deuble & de Dear, Citation2014; Li et al., Citation2018; Roskams & Haynes, Citation2020). Despite the current techniques to collect accurate and reliable IEQ data such as a web-based survey along with a mobile IEQ assessment cart, energy management systems (EMS) and occupancy sensors, the IEQ assessment results do not seem to have been utilized in building management practice. The current practice of IEQ analysis and reporting is to use a ‘benchmark’ in order to compare individual building performance against a building-specific database in relation to best-practice sustainability and well-being certifications. The benchmark technique can provide an overall building performance, yet it is less realistic to expect to be used as a diagnostic or building management tool (Edirisinghe & Woo, Citation2021). The comprehensive IEQ assessment of this study could provide a sound understanding of the indoor environmental conditions and their interaction with building users in the field of the built environment research. Furthermore, it will offer a methodological guidance on IEQ assessment with facility managers who aim to fill the gap between physical building conditions and occupant feedback to seek effective building management and space planning decisions.
Indoor environmental quality (IEQ) research has been accelerated over the last two decades in the context of sustainable building rating systems. The early research of IEQ focused on a single aspect such as thermal comfort and ventilation to set standards and guidelines, and later specific IEQ factors and their association with overall comfort or satisfaction have been explored to determine more influential factors in the built environment. Although indoor environment encompasses a range of components including temperature, humidity, indoor air quality (IAQ), lighting, ventilation, noise and crowdedness of workspace (Clements-Croome & Baizhan, Citation2000), IEQ is largely characterized by four environmental categories including thermal comfort, IAQ, lighting and acoustics (Larsen et al., Citation2020) without taking into account the spatial comfort of the occupants in literature. It is understood that the four environmental categories are more fundamentally affected by building design and technical solutions such as building envelope and services. On the contrary, spatial comfort can be achieved by changes in internal layout and workspace arrangements, considering different work types, occupant behaviour and personal preferences. This research, focusing on work settings in a diverse range of buildings-in-use, has further specified the IEQ categories into two sections: (1) Indoor environment and (2) spatial comfort and amenities. As expected, it is likely that the newest building (Type 3 Modern) showed better performance than the other two building types with respect to thermal comfort, IAQ, noise and lighting. It is obvious that the physical conditions such as building envelope and services influence occupant perception and satisfaction in the indoor environment. The spatial comfort and amenities however demonstrated statistically significant difference in most of the variables among three building types. Although Type 3 generally showed the highest level of comfort and satisfaction among three building types, it is noteworthy that Type 1, the oldest buildings, demonstrated the in-between status (between high and low performance) which seems to have been improved by building renovation and regular maintenance over time. Particularly, Type 1 demonstrated high levels of satisfaction with ‘general décor’ and ‘general cleanliness’, which implies potential improvement regardless of building type (owner occupied or leased) and age.
Lastly, universities have a significant portion of building stock often with varied ages, with regular new projects and refurbishment of existing buildings. Moreover, diverse space requirements should be met for different types of building users such as students, academic and non-academic staff and visitors according to their occupancy in university buildings. In this research, it was found that ‘Modern’ (post 2000) building demonstrated higher performance than ‘Heritage listed’ (c.1880–1890s) and ‘Conventional’ (c.1960–1980s) buildings to support non-academic staff in the university. However, it also suggested that refurbishment of building envelope and services and interior space reconfiguration can improve indoor environmental quality including spatial comfort and amenities and subsequently contribute to occupant comfort, satisfaction and productivity in the workplaces. A recent study conducted in Singapore found that green-refurbished buildings reported levels of IEQ, satisfaction and health symptoms similar to green-certified buildings whose performance is expected to be higher than conventional buildings. Both categories of buildings had superior IEQ compared with non-green-certified buildings. Except façade-related parameters such as satisfaction with views and daylight, the study found that enhanced IEQ performance level as high as green-certified buildings can be achieved by converting existing conventional buildings to green-certified buildings through green refurbishment in the context of office buildings in Singapore (Lee et al., Citation2020).
Limitations
The current findings are restricted to seven office buildings with relatively good IEQ and may not generalize to other environments. Due to the heterogeneous nature, it was impractical to collect the equal size of samples from the three different types of buildings. Expectedly, a majority of the selected buildings were ‘Conventional’ buildings (Type 2)’ and subsequently a majority of the occupant responses were collected, which also influenced the selection of statistical analysis methods. Furthermore, this study did not explore individual factors such as age, gender, seat position and work activity that can influence the perception of occupants in their workplaces, further analysis on individual factors would help researchers to understand the gap between measured IEQ and occupant responses. Lastly, the measurements of the indoor environmental conditions were taken during winter, which could influence the interpretation of the results such as PMV/PPD calculations and correlations between occupant perception and measured indoor environmental conditions. Exploring summer conditions will be an opportunity for future research.
Conclusion
The present study demonstrates a comprehensive IEQ evaluation to seek effective building management to improve occupant comfort, satisfaction and productivity in an Australian university. A mix of objective and subjective assessments confirmed an acceptable level of IEQ in three types of buildings: ‘Heritage listed’ (c.1880–1890s), ‘Conventional’ (c.1960–1980s) and ‘Modern’ (post 2000) office buildings, which were predominantly used to accommodate professional (non-academic) staff. The PMV/PPD model indicated slightly cool in four offices in the conventional type buildings during winter, being consistent with the occupant perception of thermal sensation. Overall, the occupant perceptions of the indoor environment seemed to be consistent with the objective measurements, yet the discrepancy between objective and subjective evaluations was found. Subjective evaluations do not seem to be always correlated to the corresponding indoor environmental parameters, surprisingly, some subjective evaluations tend to show stronger correlations with other environmental parameters. This clearly indicates that combined effects between IEQ factors and building design exist and exploring them is an opportunity for future research. Expectedly, the modern type building designed with fully double-glazed façades showed the highest levels of overall comfort and satisfaction and perceived productivity, whereas the conventional type, notable for deep floor plates, had the lowest. Despite lower window to wall ratios, the heritage listed type demonstrated improved occupant comfort and satisfaction across all IEQ areas over the conventional type buildings. This research has implications for university campus planners and property managers who must ensure office provisions for professional staff are satisfactory and fit-for-purpose. The results support that regular building renovation, maintenance and fitout upgrades can improve occupant comfort and satisfaction with less concerning building age and help to develop retrofitting strategies that can provide more satisfactory IEQ to occupants in university buildings, particularly the stock of buildings constructed during the 1960s-1980s period.
Supplemental Material
Download PDF (803.3 KB)Disclosure statement
No potential conflict of interest was reported by the author(s).
Additional information
Funding
References
- Abbaszadeh, S., Zagreus, L., Lehrer, D., & Huizenga, C. (2006). Occupant satisfaction with indoor environmental quality in green buildings. Proceedings of Healthy Buildings 2006 (pp. 365–370). CBE.
- Al Horr, Y., Arif, M., Kaushik, A., Mazroei, A., Katafygiotou, M., & Elsarrag, E. (2016). Occupant productivity and office indoor environment quality: A review of the literature. Building and Environment, 105, 369–389. https://doi.org/https://doi.org/10.1016/j.buildenv.2016.06.001
- ANSI/ASHRAE 55. (2017). Thermal environmental conditions for human occupancy. ANSI/ASHRAE Standard 55-2017. ANSI
- AS/NZS 1680.1. (2006). Interior and workplace lighting. Part 1: General principles and recommendations. AS/NZS. SAI Global.
- AS/NZS 2107. (2016). Acoustics – recommended design sound levels and reverberation times for building interiors. AS/NZS. SAI Global.
- ASTM D6245. (2018). Standard guide for using indoor carbon dioxide concentrations to evaluate indoor air quality and ventilation. ASTM International.
- Bae, S., Martin, C. S., & Asojo, A. O. (2020). Indoor environmental quality factors that matter to workplace occupants: An 11-year-benchmark study. Building Research & Information, 1–16. https://doi.org/https://doi.org/10.1080/09613218.2020.1794777.
- Baldry, C., & Barnes, A. (2012). The open-plan academy: Space, control and the undermining of professional identity. Work, Employment & Society, 26(2), 228–245. https://doi.org/https://doi.org/10.1177/0950017011432917
- Bernstein, E. S., & Turban, S. (2018). The impact of the ‘open’ workspace on human collaboration. Philosophical Transactions of the Royal Society B: Biological Sciences, 373(1753). https://doi.org/https://doi.org/10.1098/rstb.2017.0239
- Bluyssen, P. M., Roda, C., Mandin, C., Fossati, S., Carrer, P., Kluizenaar, Y., Mihucz, V. G., Oliveira Fernandes, E., & Bartzis, J. (2016). Self-reported health and comfort in ‘modern’ office buildings: First results from the European OFFICAIR study. Indoor Air, 26(2), 298–317. https://doi.org/https://doi.org/10.1111/ina.12196
- Braat-Eggen, E. (2020). Auditory distraction in open-plan study environments in higher education [PhD, Technical University of Eindhoven]. https://research.tue.nl/en/publications/auditory-distraction-in-open-plan-study-environments-in-higher-ed
- Braat-Eggen, E., Reinten, J., Hornikx, M., & Kohlrausch, A. (2019). The influence of background speech on a writing task in an open-plan study environment. Building and Environment, Article 106586. https://doi.org/https://doi.org/10.1016/j.buildenv.2019.106586
- Brennan, A., Chugh, J. S., & Kline, T. (2002). Traditional versus open office design a longitudinal field study. Environment and Behavior, 34(3), 279–299. https://doi.org/https://doi.org/10.1177/0013916502034003001
- Candido, C., Kim, J., De Dear, R., & Thomas, L. (2016). BOSSA: A multidimensional post-occupancy evaluation tool. Building Research & Information, 44(2), 214–228. https://doi.org/https://doi.org/10.1080/09613218.2015.1072298
- Castilla, N., Llinares, C., Bravo, J. M., & Blanca, V. (2017). Subjective assessment of university classroom environment. Building and Environment, 122, 72–81. https://doi.org/https://doi.org/10.1016/j.buildenv.2017.06.004
- Chen, C.-F., Yilmaz, S., Pisello, A. L., De Simone, M., Kim, A., Hong, T., Bandurski, K., Bavaresco, M. V., Liu, P.-L., & Zhu, Y. (2020). The impacts of building characteristics, social psychological and cultural factors on indoor environment quality productivity belief. Building and Environment 185, Article 107189. https://doi.org/https://doi.org/10.1016/j.buildenv.2020.107189
- Choi, J.-H., & Lee, K. (2018). Investigation of the feasibility of POE methodology for a modern commercial office building. Building and Environment, 143, 591–604. https://doi.org/https://doi.org/10.1016/j.buildenv.2018.07.049
- Clements-Croome, D. (2018). Creating the productive workplace: Places to work creatively (3rd ed.). Routledge.
- Clements-Croome, D., & Baizhan, L. (2000). Productivity and indoor environment. Proceedings of Healthy Buildings 2000 (Vol. 1, pp. 629–634).
- Davis, J. A., III, & Nutter, D. W. (2010). Occupancy diversity factors for common university building types. Energy and Buildings, 42(9), 1543–1551.
- Davis, M., Leach, D., & Clegg, C. (2020). Breaking out of open-plan: Extending social interference theory through an evaluation of contemporary offices. Environment and Behavior, 52(9), 945–978. https://doi.org/https://doi.org/10.1177/0013916519878211
- de Dear, R. J. (2004). Thermal comfort in practice. Indoor Air, 14(7), 32–39. https://doi.org/https://doi.org/10.1111/j.1600-0668.2004.00270.x
- de Dear, R. J., & Brager, G. S. (1998). Developing an adaptive model of thermal comfort and preference. ASHRAE Transactions, 104, 1–18.
- de Vaus, D. (2002). Analyzing social science data: 50 key problems in data analysis. Sage.
- Deuble, M. P., & de Dear, R. J. (2014). Is it hot in here or is it just me? Validating the post-occupancy evaluation. Intelligent Buildings International, 6(2), 112–134. https://doi.org/https://doi.org/10.1080/17508975.2014.883299
- Edirisinghe, R., & Woo, J. (2021). BIM-based performance monitoring for smart building management. Facilities, 39(1/2), 19–35. https://doi.org/https://doi.org/10.1108/F-11-2019-0120
- Fanger, P. O. (2000). Indoor air quality in the 21st century: Search for excellence. Indoor Air, 10(2), 68–73. https://doi.org/https://doi.org/10.1034/j.1600-0668.2000.010002068.x
- Field, A. P. (2018). Discovering statistics using IBM SPSS (5th ed.). Sage.
- Fisk, W. J., Mirer, A. G., & Mendell, M. J. (2009). Quantitative relationship of sick building syndrome symptoms with ventilation rates. Indoor air, 19(2), 159–165. https://doi.org/https://doi.org/10.1111/j.1600-0668.2008.00575.x
- Frontczak, M., Schiavon, S., Goins, J., Arens, E., Zhang, H., & Wargocki, P. (2012). Quantitative relationships between occupant satisfaction and satisfaction aspects of indoor environmental quality and building design. Indoor Air, 22(2), 119–131. https://doi.org/https://doi.org/10.1111/j.1600-0668.2011.00745.x
- Gupta, R., Howard, A., & Zahiri, S. (2020). Defining the link between indoor environment and workplace productivity in a modern UK office building. Architectural Science Review. https://doi.org/https://doi.org/10.1080/00038628.2019.1709788.
- Haynes, B., Haynes, B., Suckley, L., Suckley, L., Nunnington, N., & Nunnington, N. (2017). Workplace productivity and office type: An evaluation of office occupier differences based on age and gender. Journal of Corporate Real Estate, 19(2), 111–138. https://doi.org/https://doi.org/10.1108/JCRE-11-2016-0037
- Haynes, B. P. (2007). Office productivity: A shift from cost reduction to human contribution. Facilities, 25(11/12), 452–462. https://doi.org/https://doi.org/10.1108/02632770710822562
- Hedge, A., Miller, L., & Dorsey, J. (2014). Occupant comfort and health in green and conventional university buildings. Work, 49(3), 363–372. https://doi.org/https://doi.org/10.3233/WOR-141870
- Heerwagen, J. (2000). Green buildings, organizational success and occupant productivity. Building Research & Information, 28(5), 353–367. https://doi.org/https://doi.org/10.1080/096132100418500
- Hill, N., Brierley, J., & MacDougall, R. (2017). How to measure customer satisfaction (2nd ed.). Routledge.
- Hua, Y., Göçer, Ö, & Göçer, K. (2014). Spatial mapping of occupant satisfaction and indoor environment quality in a LEED platinum campus building. Building and Environment, 79, 124–137. https://doi.org/https://doi.org/10.1016/j.buildenv.2014.04.029
- Huizenga, C., Abbaszadeh, S., Zagreus, L., & Arens, E. (2006). Air quality and thermal comfort in office buildings: Results of a large indoor environmental quality survey. Proceedings of Healthy Buildings 2006 (Vol. 3, p. 5). CBE.
- Humphreys, M. A. (2005). Quantifying occupant comfort: Are combined indices of the indoor environment practicable? Building Research & Information, 33(4), 317–325. https://doi.org/https://doi.org/10.1080/09613210500161950
- Jones, A. P. (1999). Indoor air quality and health. Atmospheric Environment, 33(28), 4535–4564. https://doi.org/https://doi.org/10.1016/S1352-2310(99)00272-1
- Kang, S., Ou, D., & Mak, C. M. (2017). The impact of indoor environmental quality on work productivity in university open-plan research offices. Building and Environment, 124, 78–89. https://doi.org/https://doi.org/10.1016/j.buildenv.2017.07.003
- Kärnä, S., Julin, P., & Dalrymple, J. (2015). A framework for measuring student and staff satisfaction with university campus facilities. Quality Assurance in Education, 23(1), 47–66. https://doi.org/https://doi.org/10.1108/QAE-10-2013-0041
- Kim, H.-Y. (2014). Analysis of variance (ANOVA) comparing means of more than two groups. Restorative Dentistry & Endodontics, 39(1), 74–77. https://doi.org/https://doi.org/10.5395/rde.2014.39.1.74
- Kim, J., & de Dear, R. (2012). Nonlinear relationships between individual IEQ factors and overall workspace satisfaction. Building and Environment, 49, 33–40. https://doi.org/https://doi.org/10.1016/j.buildenv.2011.09.022
- Kim, J., & de Dear, R. (2013). Workspace satisfaction: The privacy-communication trade-off in open-plan offices. Journal of Environmental Psychology, 36, 18–26. https://doi.org/https://doi.org/10.1016/j.jenvp.2013.06.007
- Kirk, R. E. (1996). Practical significance: A concept whose time has come. Educational and Psychological Measurement, 56(5), 746–759. https://doi.org/https://doi.org/10.1177/0013164496056005002
- Lansdale, M., Parkin, J., Austin, S., & Baguley, T. (2011). Designing for interaction in research environments: A case study. Journal of Environmental Psychology, 31(4), 407–420. https://doi.org/https://doi.org/10.1016/j.jenvp.2011.05.006
- Larsen, T. S., Rohde, L., Jønsson, K. T., Rasmussen, B., Jensen, R. L., Knudsen, H. N., Witterseh, T., & Bekö, G. (2020). IEQ-Compass – a tool for holistic evaluation of potential indoor environmental quality. Building and Environment, 172, Article 106707. https://doi.org/https://doi.org/10.1016/j.buildenv.2020.106707
- Lawrence, R., Elsayed, M., & Keime, C. (2019). Evaluation of environmental design strategies for university buildings. Building Research & Information, 47(8), 883–900. https://doi.org/https://doi.org/10.1080/09613218.2019.1652551
- Lawrence, R., & Keime, C. (2016). Bridging the gap between energy and comfort: Post-occupancy evaluation of two higher-education buildings in Sheffield. Energy & Buildings, 130(C), 651–666. https://doi.org/https://doi.org/10.1016/j.enbuild.2016.09.001
- Lee, J.-Y., Wargocki, P., Chan, Y.-H., Chen, L., & Tham, K.-W. (2020). How does indoor environmental quality in green refurbished office buildings compare with the one in new certified buildings? Building and Environment, 171. https://doi.org/https://doi.org/10.1016/j.buildenv.2020.106677
- Lee, M. C., Mui, K. W., Wong, L. T., Chan, W. Y., Lee, E. W. M., Cheung, C. T. (2012). Student learning performance and indoor environmental quality (IEQ) in air-conditioned university teaching rooms. Building and Environment, 49(0), 238–244. https://doi.org/https://doi.org/10.1016/j.buildenv.2011.10.001
- Li, P., Froese, T. M., & Brager, G. (2018). Post-occupancy evaluation: State-of-the-art analysis and state-of-the-practice review. Building and Environment, 133, 187–202. https://doi.org/https://doi.org/10.1016/j.buildenv.2018.02.024
- Lou, H., & Ou, D. (2019). A comparative field study of indoor environmental quality in two types of open-plan offices: Open-plan administrative offices and open-plan research offices. Building and Environment, 148, 394–404. https://doi.org/https://doi.org/10.1016/j.buildenv.2018.11.022
- Motalebi, G., Sal Moslehian, A., & Hasanzadeh, E. (2019). The most effective indoor environmental quality factors related to worker satisfaction and performance: A case of the administrative office building at Ferdowsi University of Mashhad. International Journal of Occupational Safety and Ergonomics, 1–13. https://doi.org/https://doi.org/10.1080/10803548.2019.1582886.
- Parkin, J. K., Austin, S. A., Pinder, J. A., Baguley, T. S., & Allenby, S. N. (2011). Balancing collaboration and privacy in academic workspaces. Facilities, 29(1/2), 31–49. https://doi.org/https://doi.org/10.1108/02632771111101313
- Pellerin, N., & Candas, V. (2003). Combined effects of temperature and noise on human discomfort. Physiology and Behavior, 78(1), 99–106. https://doi.org/https://doi.org/10.1016/S0031-9384(02)00956-3
- Pellerin, N., & Candas, V. (2004). Effects of steady-state noise and temperature conditions on environmental perception and acceptability. Indoor Air, 14(2), 129–136. https://doi.org/https://doi.org/10.1046/j.1600-0668.2003.00221.x
- Pierrette, M., Parizet, E., Chevret, P., & Chatillon, J. (2015). Noise effect on comfort in open-space offices: Development of an assessment questionnaire. Ergonomics, 58(1), 96–106. https://doi.org/https://doi.org/10.1080/00140139.2014.961972
- Preiser, W. F., Rabinowitz, H. Z., & White, E. T. (1988). Post-occupancy evaluation. Van Nostrand Reinhold Company.
- Preiser, W., & Vischer, J. (2006). Assessing building performance. Routledge.
- Rasheed, E. O., Khoshbakht, M., & Baird, G. (2019). Does the number of occupants in an office influence individual perceptions of comfort and productivity? New evidence from 5000 office workers. Buildings, 9(3), 73. https://doi.org/https://doi.org/10.3390/buildings9030073
- Richardson, A., Potter, J., Paterson, M., Harding, T., Tyler-Merrick, G., Kirk, R., Reid, K., & McChesney, J. (2017). Office design and health: A systematic review. New Zealand Medical Journal, 130(1467), 39.
- Roskams, M. J., & Haynes, B. P. (2020). Testing the relationship between objective indoor environment quality and subjective experiences of comfort. Building Research & Information, 1–12. https://doi.org/https://doi.org/10.1080/09613218.2020.1775065
- Rudnick, S., & Milton, D. (2003). Risk of indoor airborne infection transmission estimated from carbon dioxide concentration. Indoor Air, 13(3), 237–245. https://doi.org/https://doi.org/10.1034/j.1600-0668.2003.00189.x
- Sakellaris, I. A., Saraga, D. E., Mandin, C., Roda, C., Fossati, S., de Kluizenaar, Y., Carrer, P., Dimitroulopoulou, S., Mihucz, V. G., Szigeti, T., Hänninen, O., de Oliveira Fernandes, E., Bartzis, J. G., & Bluyssen, P. M. (2016). Perceived indoor environment and occupants’ comfort in European ‘modern’ office buildings: The OFFICAIR study. International Journal of Environmental Research and Public Health, 13(5), 444. https://doi.org/https://doi.org/10.3390/ijerph13050444
- Sarbu, I., & Pacurar, C. (2015). Experimental and numerical research to assess indoor environment quality and schoolwork performance in university classrooms. Building and Environment, 93(2), 141–154. https://doi.org/https://doi.org/10.1016/j.buildenv.2015.06.022
- Sensharma, N. P., Woods, J. E., & Goodwin, A. K. (1998). Relationships between the indoor environment and productivity: A literature review. ASHRAE Transactions, 104, 686.
- Seppänen, O. A., & Fisk, W. (2006). Some quantitative relations between indoor environmental quality and work performance or health. HVAC&R Research, 12(4), 957–973. https://doi.org/https://doi.org/10.1080/10789669.2006.10391446
- Tanabe, S.-I., Kobayashi, K., Kiyota, O., Nishihara, N., & Haneda, M. (2009). The effect of indoor thermal environment on productivity by a year-long survey of a call centre. Intelligent Buildings International, 1(3), 184–194. https://doi.org/https://doi.org/10.3763/inbi.2009.0005
- Tartarini, F., Schiavon, S., Cheung, T., & Hoyt, T. (2020). CBE thermal comfort tool: Online tool for thermal comfort calculations and visualizations. SoftwareX 12, Article 100563. https://doi.org/https://doi.org/10.1016/j.softx.2020.100563
- Van Marrewijk, A., & Van den Ende, L. (2018). Changing academic work places: The introduction of open-plan offices in universities. Journal of Organizational Change Management, 31(5), 1119–1137. https://doi.org/https://doi.org/10.1108/JOCM-02-2017-0039
- Veitch, J. A., Charles, K. E., Farley, K. M., & Newsham, G. R. (2007). A model of satisfaction with open-plan office conditions: COPE field findings. Journal of Environmental Psychology, 27(3), 177–189. https://doi.org/https://doi.org/10.1016/j.jenvp.2007.04.002
- Vischer, J. C. (2005). Space meets status. Routledge.
- Vischer, J. C., & Wifi, M. (2015). The effect of workplace design on quality of life at work. In G. Fleury-Bahi, E. Pol, & O. Navarro (Eds.), Handbook of environmental psychology and quality of life research (pp. 387–400). Springer.
- Wargocki, P., Wyon, D. P., Baik, Y. K., Clausen, G., & Fanger, P. O. (1999). Perceived air quality, sick building syndrome (SBS) symptoms and productivity in an office with two different pollution loads. Indoor air, 9(3), 165–179. https://doi.org/https://doi.org/10.1111/j.1600-0668.1999.t01-1-00003.x
- Wilhoit, E. D., Gettings, P., Malik, P., Hearit, L. B., Buzzanell, P. M., & Ludwig, B. (2016). STEM faculty response to proposed workspace changes. Journal of Organizational Change Management, 29(5), 804–815. https://doi.org/https://doi.org/10.1108/JOCM-04-2015-0064
- Yoshida, Y., Shimoda, Y., & Ohashi, T. (2017). Strategies for a sustainable campus in Osaka University. Energy and Buildings, 147, 1–8. https://doi.org/https://doi.org/10.1016/j.enbuild.2017.04.020
- Zagreus, L., Huizenga, C., Arens, E., & Lehrer, D. (2004). Listening to the occupants: A web-based indoor environmental quality survey. Indoor Air, 14(8), 10. https://doi-org.ezproxy.lib.rmit.edu.au/https://doi.org/10.1111/j.1600-0668.2004.00301.x