
 ?Mathematical formulae have been encoded as MathML and are displayed in this HTML version using MathJax in order to improve their display. Uncheck the box to turn MathJax off. This feature requires Javascript. Click on a formula to zoom.
ABSTRACT
One of the most widely available technologies to clean the air in homes of particulate matter of less than 2.5 µm in diameter (PM2.5), known to have negative health impacts, are portable home air purifiers (HAPs). This paper presents research which (1) explored the effectiveness of HAPs in real-world conditions in 57 homes in three European cities; (2) examined if HAPs affect users’ perceptions of the indoor air quality (IAQ) at home; and (3) considered the motivations for occupants’ operation of HAPs. Results from this study found that PM2.5 concentrations in bedrooms were reduced by 45% to 69%; perceptions of IAQ were not correlated with measured high PM2.5 levels; occupants reported the HAPs to have a ‘cooling’ effect, which may explain why the predominant driver of HAP use was thermal comfort, rather than IAQ, in all three cities. The latter finding was supported by a statistically significant increase in the probability of HAP use with increasing indoor temperatures. If the operation of HAPs can be managed, or fully automated, to reflect indoor air pollution levels rather than thermal conditions, better pollutant reduction would be feasible and their use to reduce PM2.5 may help mitigate the negative health effects of exposure whilst at home.
Introduction
Particulate matter of less than 2.5 µm in diameter (PM2.5) is known to have negative health effects (Pope et al., Citation2020), and 9 million deaths globally are estimated to be associated with indoor exposure (WHO, Citation2019). Exposure to PM2.5 may be especially high at home because (1) it is where people spend most of their time, (2) there are many indoor sources (e.g. cooking, smoking, cleaning) in addition to the contribution from outdoors, and (3) people have not been found to perceive PM2.5 and therefore may not act to mitigate unhealthy levels. Additionally, home is different from most other indoor settings as it is where people sleep. Sleep being a time of special vulnerability because people cannot take action to remedy poor air quality. It is therefore important to understand ways to improve the IAQ in homes, and the occupant behaviours that impact IAQ.
Substantial research has been published on the effectiveness of air purifiers in reducing indoor PM2.5, in laboratory settings and computer models, as well as short-term monitoring in homes (e.g. Allen et al., Citation2011; Barn et al., Citation2018; Zhan et al., Citation2018). However, little evidence is available that explains the actual use of the equipment by occupants, or what the motivations are for HAP use. This work aimed to explore the impact of commercially available home air purifiers (HAPs) used in bedrooms on indoor PM2.5 concentration and perceived indoor air quality. As well as, to better understand how and why portable air purifiers are used by occupants in three European cities (Eindhoven, NL, Helsinki, FL, and London, UK).
This research focusses on PM2.5 indoors for two main reasons. First, it is widely recognized in the literature as having a negative impact on health outcomes, as is presented in the next section. Secondly, air purifiers such as the type used in this study are designed to filter particles in this size range and have a limited impact on gaseous pollutants. Therefore, other indoor air pollutants, such as nitrogen dioxide (NO2) and volatile organic compounds (VOCs), are not included in the scope of this work.
The work presented here provides new results and analysis, from more residences in more countries, and expands upon the initial findings regarding occupants’ use of HAPs presented for the case of flats in London (Cooper et al., Citation2021). The current work provides a comparison between three different cities in the effectiveness of HAPs, the perception of air quality, and the HAP operational behaviour of occupants. The aim of this work is to better understand the conditions which influence the effectiveness of HAPs to reduce PM2.5 in residences.
Background and literature review
Building standards have changed to meet requirements for energy efficiency and carbon reduction which has lowered infiltration rates, making intentional ventilation paramount to the dilution of indoor generated pollutants to provide acceptable indoor air quality (Shrubsole et al., Citation2014). According to a 2012 review article by Dimitroulopoulou (Citation2012) ventilation rates in Europe often fall below 0.5 h−1 (a common regulatory standard) which can lead to an accumulation of indoor generated air pollutants, and consequently increased pollutant exposure risks. Although there are several ways to achieve the required air change rate, including continuous mechanical extract, or supply and extract with heat recovery, residences in many places have relied primarily, or entirely, upon natural ventilation (i.e. windows and doors) and uncontrolled ventilation has been common.
In the UK background ventilators (e.g. trickle-ventilators) remain a common approach but, as with other types of natural ventilation, they do not have filtration capacity, and leave the indoor air quality heavily dependent upon the quality of the outdoor air. In addition to the reliance upon good outdoor air quality, for events of high indoor pollutant generation (e.g. cooking), ventilation through natural ventilation alone may be inadequate. The results of a BRE (Building Research Establishment) study found that 68% of homes had a whole house ventilation rate below the minimum design value of 0.5 h−1 in the winter, and in summer 30% of homes failed to reach this standard (Dimitroulopoulou et al., Citation2005). As more than two-thirds of the homes in the work presented here (and all of those located in London and Helsinki) were apartments it is notable that, in the same BRE study (Dimitroulopoulou et al., Citation2005), flats performed even more poorly than other types of homes monitored.
In cold climates, like Finland, airtightness of buildings is critical in maintaining thermal comfort efficiently, and as a consequence mechanical ventilation is essential in providing acceptable indoor air quality in the heating season. However, occupant behaviour, like opening windows and doors, cooking, burning candles, etc. will influence the ultimate indoor to outdoor ratio. Flats monitored in this study were equipped with MVHR, and although their performance was not measured in the work presented here, previous studies in Finnish homes found that the recommended ventilation rate (>0.5 h−1) was achieved by only 57% of newly constructed dwellings with MVHR (Kurnitski et al., Citation2007).
By decree, the required ventilation rate in Dutch homes is 300 m3/h, and studies have reported that this is often achieved (van der Wal et al., Citation1991). However, low-energy homes, monitored in another study, which primarily used mechanical ventilation had lower ventilation rates than those required by the Dutch Building Code (Balvers et al., Citation2012).
Levels of outdoor air pollution, cultural and behavioural patterns, and perhaps even perceptions of wellbeing, vary widely across Europe. However, home, for most people, is a place of comfort and safety, and people spend up to 65% of their time there (Klepeis & Ott, Citation2001). Therefore, it is important to understand place-specific differences in the quality of the air in homes, people’s responses to it and how best to mitigate it when it is poor.
Indoor air quality and health
Air pollution concentrations, including particulate matter, can, in many locations, exceed health-based guidelines developed by the World Health Organization (WHO) for both chronic and acute exposure (Logue et al., Citation2012; WHO, Citation2006). Prior studies have demonstrated the contribution of indoor air pollution to total exposure (Samet, Citation1993; Weisel et al., Citation2005), as well as the negative health impacts associated with exposure. Atmospheric particulate matter less than 2.5 µm in aerodynamic diameter has been explicitly implicated in multiple health outcomes including; cardiovascular diseases (Ostro & Rothschild, Citation1989), asthma (Schwartz et al., Citation1993), bronchitis (Anderson et al., Citation2012), premature mortality (Crouse et al., Citation2012; Laden et al., Citation2006; Pope & Dockery, Citation2006) and lung cancer (Pope et al., Citation2002).
Home air purifiers: technologies and impact
Previous studies have considered the health benefits of different methods of particulate filtration (Batterman et al., Citation2012; Fisk, Citation2018; Fisk & Chan, Citation2017b), and the adoption of technologies to mitigate indoor air pollution is increasingly common (‘Global Residential Air Purifiers Market: Growth, Trends, COVID-19 Impact and Forecasts’, Citation2021). Home air purifiers (HAPs) which utilize HEPA (high efficiency particulate air) filtration as the primary mechanism of air cleaning are one of the most common devices currently available for in-home use. Simple installation without the requirement of a central air handling system, flexibility in location and the lack of harmful by-products give these devices a number of advantages over other air cleaning methods.
Substantial reductions in PM2.5 in spaces using these devices, from as much as 82.7% (Zhan et al., Citation2018) to as little as 29% (Barn et al., Citation2018), were reported in previous studies, with most studies finding reductions of around 50% (e.g. McNamara et al., Citation2017; Shao et al., Citation2017). A crossover study in Denmark reported a reduction in PM2.5 of 54.5% (median value) in locations using HEPA filtration (Spilak et al., Citation2014). A 43% reduction in PM2.5 was shown in an intervention study in the United States when HEPA filtration was used (Park et al., Citation2017). In a modelling study by Fisk and Chan (Fisk & Chan, Citation2017a) a number of scenarios were simulated, including using portable air purifiers in homes without forced air systems, which closely resembles many of the dwellings monitored in the work presented here. The results of models of homes with continuously operating portable air purifiers showed a reduction of 45% in PM2.5 concentrations (Fisk & Chan, Citation2017a).
However, past research was, for the most part, not inclusive of typical ambient air quality conditions and healthy adults. Rather, outdoor pollution events, such as wildfires, and occupants with specific health conditions, like lung disease, and children were the focus of the studies (Brugge et al., Citation2017; Maestas et al., Citation2019; Park et al., Citation2017; Spilak et al., Citation2014; Vyas et al., Citation2016; Weichenthal et al., Citation2013).
Perception of air quality
There is little evidence that indicates people readily perceive poor air quality due to PM2.5. The perception of air quality has been shown to be most strongly influenced by the thermal conditions and relative humidity of a space (Fang et al., Citation2004). A study by Rotko et al. (Citation2002) found that, although people expressed annoyance with air pollution, there was poor association between annoyance and measured PM2.5 concentrations. A study in France assessed the perception of air quality in homes and found that there was little correlation between occupants’ perceived air quality and the measured parameters (including particulate matter) (Langer et al., Citation2017). In the Langer et al. study, occupants generally described their home more favourably than visitors, who did a better job of assessing air quality, as compared to measured pollutants such as volatile organic compounds. However, neither occupants’ nor visitors’ perceptions were strongly associated with PM2.5.
Thermal comfort
Thermal stimuli affect the way that occupants experience comfort and control of their environment indoors. A review by Day et al. (Citation2020) provides a good description of the way in which occupants interact with different components of the built environment and the drivers behind those behaviours. Thermal comfort is explored as an occupant motivation for window operations and thermostat use in the Day et al. review, and is further explored in work by Calì et al. (Citation2016) and by Jeong et al. (Citation2016), among others. Very little work was found that included occupant interactions with building environmental controls other than windows and thermostats. One study by Rijal et al. (Citation2008) developing adaptive algorithms that included the operation of fans to predict thermal comfort, and noted that increased mean globe temperatures were associated with more fan use.
Use of HAPs
As with indoor air quality perception, there is a paucity of research available on occupant use of HAPs. Factors affecting indoor air quality, as well as the performance of HAPs, such as, building ventilation systems, building infiltration rates, personal behaviour (e.g. window/door opening, smoking, etc.) and location of the air purifier in the residence (Novoselac & Siegel, Citation2009; Shaughnessy & Sextro, Citation2006; Whitby et al., Citation1983), have been documented, there exists little work in the literature that describes how or why people use HAPs, or how that might affect their performance.
A study in China by Pei et al. (Citation2019) found that of 43 households provided with portable air purifiers more than 80% did not use the device at all, and the rest used them only intermittently. These patterns of use, they concluded, would be insufficient to adequately reduce indoor PM2.5 levels. A study from the California Air Resources Board (Piazza et al., Citation2006) found very different use patterns to those in China. Although the devices in this study were not monitored, in surveys conducted by the researchers, 57% of owners of air purifiers claimed to use them continuously every day. Little evidence is available to explain the significant difference between these two studies, but the authors speculated that the motivation of participants in California for frequent air purifier use was due to the perceived health benefits of their use. It seems unlikely, however, that owners of HAPs in China would be unaware of similar potential health benefits of cleaner air. Any differences in air purifier use across countries, cultures and climates have the potential to be important factors in the effectiveness of HAPs.
Kaviany et al. (Citation2021) reported on the use of HAPs in an intervention study in homes of asthmatic children in the USA. This study monitored not only the utilization of HAPs (i.e. power ON or OFF), but also the fan speed, to determine adherence to the intervention’s protocol. The authors reported that participants used the purifiers 80% of the time, with adherence to the fan settings 60% of the time. However, this study used financial incentives (US$50) and weekly reminder calls to participants to encourage adherence to the air purifier regime that was prescribed. Higher rates of HAP use are therefore not unexpected. Interestingly, in their multivariable analysis model, winter season was found to be the main driver of HAP use. There was a 21% decrease in adherence to the high and turbo fans speeds in winter which the authors attribute to the cold draught produced by the devices (Kaviany et al., Citation2021).
Schweiker et al. (Citation2020) reviewed multi-domain approaches to investigate indoor environment behaviour and found that studies remain limited despite recognition by many that the stimuli that influence occupants’ behaviour and perception are multi-factorial and varied (e.g. thermal, visual, indoor air quality (IAQ)). In the work presented here physical (i.e. IAQ measurements, temperature and relative humidity), contextual (i.e. country and season) and personal (i.e. thermal sensation, IAQ preferences, perception of control over environmental variable) variables were included in the analysis of HAP operating behaviour. This method yielded new insights into occupants’ perceptions of their homes, and behaviours that may impact air quality.
Methods
Context
The study utilized a convenience sample for both the cities and monitored households with a target of 20 households in each of three cities, Eindhoven, The Netherlands, Helsinki, Finland, and London, UK Participants had to be adults, and no specific health status (e.g. healthy, asthma, etc.) was required. Children or pets in the home were both allowed, as was smoking or wood-burning stoves. Demographic information for all participants can be found in . After some exclusions and drop-out of participants, there were 18 households in London, 19 households in Eindhoven, and 20 households in Helsinki (a total of 57 dwellings). Both Eindhoven and London are located in the Cfb Köppen Climate Classification subtypes (marine west coast climate) with winter temperatures between 2°C and 6°C, and summer temperatures between 17°C and 20°C. Helsinki is located in the Dfb subtype (warm-summer, humid continental climate) with a coldest month average temperature of −3°C, and the warmest month average of approximately 17°C. Heating Degree Days (HDD) at 15.5°C are 1,973, 1,724 and 3,504 for Eindhoven, Helsinki and London respectively.
Table 1. Demographics of participating households in each city.
Eindhoven dwellings included in the work were the most varied in size, type, location, and construction. Participants were selected from throughout the city, and housing types included ten (10) townhouse/terraced-houses, three (3) apartments/flats, three (3) semi-detached, and two (2) detached houses. The smallest home was a flat of approximately 90 m2 and the largest were detached houses of about 270 m2. Seven were classified as being located in a ‘town with or without a small garden’, four were described as ‘city centre, densely packed housing’ and the other were reported as ‘suburban with larger garden’. Nine of the homes utilized mechanical ventilation whilst the other ten relied upon natural ventilation alone. Bedrooms ranged in volume from approximately 23–60 m3. None of the homes provided social or subsidized housing.
In Helsinki, the monitored site was in Jätkäsaari, a new urban district next to the city centre by the sea. All 20 residences were flats located in a recently constructed high-rise apartment building in the southeast part of the city, described as ‘city centre, densely packed housing’. Light vehicular traffic, building construction and harbour traffic was noted in the immediate area. Flats used mechanical ventilation with heat recovery, as well as window openings, for ventilation, and bedrooms were typically 30–40 m3 in volume. As with Eindhoven, none of the housing was subsidized.
In the UK, the 18 residences were located within three high-rise apartment buildings at two sites (Sites A and B) in east London. Site A in London included eleven (11) units, all of which had some level of social housing subsidy. Both buildings were constructed within the last 15 years and relied primarily upon natural ventilation in the non-heating season. At Site B trickle-ventilators provided ventilation in the heating months. Site A used mechanical ventilation with heat recovery (MVHR) during the heating season with a by-pass mode for use in non-heating times. However, most residents reported that the MVHR was turned off during the warmer months. The units were decentralized, one unit per flat, with fan efficiencies between 75% and 77%, and heat exchanger performance compliance of 92–93%. Filtration with the MVHR was minimal (ISO Coarse 45%), and filter changing, and maintenance was intermittent, at best. None of the flats had any air conditioning systems. Previous work at Site A included a pressure test which found an air permeability of 2–3 m3/ (h.m2) at 50 Pa. Given the age and characteristics of the other building, the infiltration rate is estimated to also be less than 5 m3/ (h.m2) at 50 Pa. Bedrooms in which the HAPs were located, ranged in size from approximately 28–34 m3, and typically had one operable window approximately 1.6 m2.
Philips, a study partner, loaned each household a Philips AC5659/10 home air purifier for use in the main bedroom during the study period (at no cost to the occupants). The HAPs used in this study had a pre-filter, an activated carbon filter, and a HEPA filter with a clean air delivery rate (CADR) of 500 m3/hour with a 0.3 µm particle removal efficiency of 99.97%, for room sizes up to 130 m2. Many similar products are available from other manufacturers (e.g. Panasonic, Dyson), and the results presented here are expected to be comparable across devices with similar specifications. Each HAP had a built-in sensor for measuring PM2.5 (µg m−3) and sent information via the cloud to the manufacturer regarding ON/OFF status, operation mode (e.g. fan speed), and PM2.5 levels. Surveys were conducted of the households to gather information about occupancy, physical characteristics of the dwelling (e.g. area, carpeted, etc.), and occupancy patterns and behaviours.
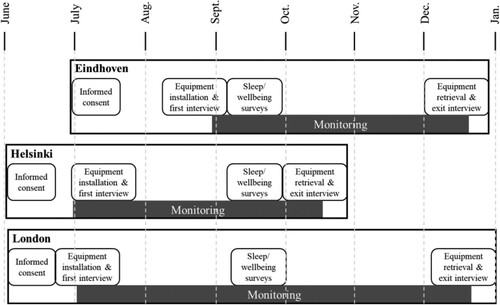
Flats in Eindhoven and London were monitored for six months, from July until the end of December, to measure conditions across three seasons, and Helsinki was monitored from July through October. Informed consent was obtained from all individual participants included in the study. A diagram of the study timeline is shown in .
Figure 1. Diagram of study dates and timeline at each city.
Air quality monitoring
Air quality data in Eindhoven was collected using bespoke sensors developed by IMEC. The sensor box consisted of commercially available environmental (temperature, relative humidity) and air quality (PM2.5, PM10 and NO2) sensors on custom developed sensor boards and the OCTA prototype platform. The particulate matter sensor (Alphasense OPC-N3) was an optical particle counter (OPC). It had a fan-based sampling flow rate of 1.2 L/min, it optically (658 nm laser scattering) quantified particles within the 0.38–17 µm particle size range, defined in 16 different size bins (Mie scattering theory). From these particle counts, particle mass concentrations of PM1, PM2.5 and PM10, were consequently calculated from the particle size spectra and concentration data, assuming a particle density of 1.65 g ml−1 and refractive index (RI) of 1.5. An electrochemical sensor for NO2 (Alphasense NO2-A43F) was included as well. The Alphasense NO2 sensors were capable of detecting NO2 concentrations at ppb (outdoor) level. As low-cost air quality sensors are sensitive to ambient atmospheric temperature (°C) and relative humidity (%), a Farnell SHT31 environmental sensor was included in the sensor boxes. According to the technical specifications, this sensor exhibits a typical accuracy tolerance of 2% for relative humidity and 0.2°C for air temperature. The raw sensor data were collected at a 1/7 Hz temporal resolution and BLE-transmitted to an Ethernet connected gateway (raspberry pi) at a 1/30 Hz resolution and subsequently averaged to 5-minute readings. Sensor measurements were compensated for temperature (°C) and relative humidity (%) and subsequently calibrated online against the regulatory reference monitoring stations of the Dutch National Institute for Public Health and the Environment (RIVM).
In Helsinki, the air quality sensors were the AQBurk, a self-contained, compact setup monitoring box. These monitors collected data on temperature, relative humidity (RH), PM10 and PM2.5. Boxes incorporate two sensor units, one unit for particles (Nova Fitness SDS011) and one for temperature (°C) and relative humidity (%) (Bosch BME280). The AQBurk were installed inside and outside a bedroom of each monitored flat. The AQBurk connected to existing Wi-Fi networks and sent data via MQTT to a server in one second intervals. Data were held in an Influx database and 5 min average was delivered to an Azure installation. The apparatus had previously been deployed in several unpublished air quality studies. Compensation parameters for the sensors were computed on the basis of data collected during a calibration session at Helsinki Region Environmental Services Authority measurement site at Mäkelänkatu in Helsinki.
Indoor and outdoor air quality sensors in London were Eltek TU1082 – AQ110/112. This device is equipped with Alphasense PM (OPC-N2) and gas (NO2-A43F) sensors (similar to the units used in Eindhoven). Overall, 18 living rooms, 17 bedrooms, and 60 opening areas (18 doors and 42 windows) were monitored by sensors which worked in a clustered sensor network. After testing the onsite transmission signal strength, all 18 flats were allocated to 11 Eltek Squirrel SRV250 data loggers. This architecture enabled real-time data collection from each flat to be sent and stored to an online server every 5 mins using available 3G networks. Due to the availability of a constantly updated database, a core part of data quality assurance work was automated to check for power-off, signal loss, or other issues. Problems were quickly identified, and the appropriate action was taken to minimize data loss to the greatest extent. The Eltek indoor air quality transmitters, AQ110/112, were placed at a height of 1.5–1.7 m above the finished floor in the living room of each flat to avoid disruptions in occupants’ use of their homes. Eltek GD47B sensors were located at the same height in the bedroom where the HAP was used to measure air temperature, relative humidity, and CO2. An AQ110/112 sensor was deployed outside of each building to measure the real-time outdoor environmental pollutant level. The buildings were all located in relatively dense urban mixed-use areas adjacent to high traffic roads.
Full specifications for all the sensors used in the study can be found in the Supplemental Materials.
Crossover study design
The cross-over structure of the study was developed to answer research questions regarding the performance of the home air purifier with respect to PM2.5 indoors, its relationship to outdoor concentrations, and to people’s perceptions of air quality in their homes. The World Health Organization Air Quality Guidelines (2008) were used as a reference for both outdoor and indoor air in this study. This recommendation is for a short-term exposure limit of 25 µg/m3 24-hour mean, and long-term limit of 10 µg/m3 annual mean (WHO, Citation2006). The home air purifier turned on to fan speed 1, 2, 3 or turbo (HAP ON) was compared with respect to using no purification device (HAP OFF) as well as using the HAP always ON but on the lowest fan speed setting (HAP BACKGROUND).
Pollutant levels, and operational status of the HAP, were collected and recorded every 5 min. In addition to the data on use collected from the devices themselves, use was evaluated through interviews when installing (baseline) and when collecting the HAPs at the end of the study (final). The cohorts in each city were divided into four (4) roughly equal tracks, three with alternating configurations of HAP use: always off, always on at the lowest fan speed, or freely operated for the duration of the study. Each phase of the crossover period lasted a minimum of three weeks. For one week of each phase, participants were sent short surveys each day that asked them about the quality of their sleep and wellbeing during the previous day.
Semi-structured interviews
Semi-structured interviews were conducted at the first site visit to establish a baseline of the occupants’ overall satisfaction with the dwelling, their general health and wellbeing, and sleep quality. A part of the Building Users’ Survey Methodology (BUS) (Arup, Citation2020) was used to determine the occupants’ opinions on various aspects of their home, including air quality, thermal comfort and control of the environment (Cohen et al., Citation2001). The Short Form health survey (SF-12) was employed to assess the self-reported mental and physical health of the participants (Jenkinson et al., Citation1997). Additionally, participants were asked about their sleep quality using the Pittsburgh Sleep Quality Index (PSQI) (Buysse et al., Citation1989). At this first interview, the monitoring equipment was installed and participants were introduced to the use of the air purifier. After the 9-week crossover period, another semi-structured interview was performed in an effort to determine if there were any changes to participants’ sleep and wellbeing, as well as to understand how the air purifiers were perceived and utilized. Some of the households in London and Eindhoven agreed to continue with monitoring after the cross-over study period to the end of the calendar year. This extension allowed the capturing of data during the heating season. Due to agreements with study participants in Helsinki, data were collected only until mid-October.
Statistical analysis
Summary statistics (means, medians, ranges) were generated for PM2.5, indoor and outdoor temperature and relative humidity (RH) using the open source statistical software R (R Core Team, Citation2018). The tests of statistical significance and correlations that were used in the analysis are specified in the results. BUS survey results were analysed through The Usable Buildings Trust, information about which can be found at the BUS Methodology website (Arup, Citation2020).
A logistic regression model was used to explore correlations between environmental parameters and HAP use. This type of model has been used to describe occupant behaviour related to window operations, and is a reasonable approach to discerning operational behaviour of binary actions (ON/OFF), and in this example in relation to temperature (Andersen et al., Citation2013). In this model, outdoor temperature was used as an explanatory variable to simulate whether the HAP was ON or not. The coefficients for this model are represented by the following expressions, and are significant to the level of 0.05:
Results
Indoor air quality
This work focussed on indoor PM2.5 in homes that use air purifiers. Homes monitored during the study period had good air quality when compared against WHO guidelines. Indeed, there were few times or days during the study period where indoor or outdoor air exceeded the limits (10 and 25 µg m−3). It is worth noting however, no safe exposure limits have been established for PM2.5 (WHO, Citation2013), and as almost two-thirds of our time is spent at home, even small reductions in concentrations are expected to be impactful. Indoor PM2.5 concentrations across the entire study period can be found in the Supplemental Materials (online).
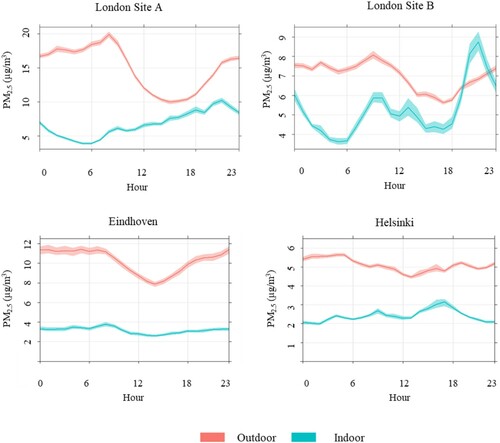
The typical daily patterns of PM2.5 concentrations indoors and outdoors illustrate the daily dynamics between indoor and outdoor sources, as well as when the internal generation of pollutants may occur. shows average hourly values across a day, aggregated for all days and all homes for the three cities (four sites). In London, particulate matter levels outside at both sites show a peak around 8 am, most likely associated with road traffic, before dropping in the afternoon. Indoor levels at London site B show a morning peak correlated with outdoor levels, and a large evening peak attributable to cooking activities. London Site A concentrations are relatively flat throughout the day with a small increase in the evening. PM2.5 concentrations outdoors in Eindhoven have relatively equivalent levels in the morning and evenings, with a drop midday, once again most likely reflecting traffic conditions. Indoor levels in Eindhoven remain very constant throughout the day. In Helsinki, outdoor levels are relatively flat across the day, illustrating that the building is located in a low-traffic area. Indoor levels in Helsinki show a small rise in the evenings, most likely coinciding with the preparation of evening meals. Although the average indoor air quality is consistently better than what is experienced outside, short-lived peak events occasionally far exceed outdoor concentrations.
Figure 2. Typical daily patterns of outdoor and indoor PM2.5 at all sites in three cities.
When measurements from participants’ bedrooms are combined, clear decay curves can be seen from the onset of HAP use to 100 min run time (). The decay curves represent the aggregated performance of the HAP; however, it is important to note that not all run cycles resulted in the same reduction pattern, particularly in the presence of continued internal sources, re-suspension, etc. In Eindhoven after 90 min of operation, PM2.5 concentrations were reduced by a mean of 69%. In Helsinki after 90 min of operation, PM2.5 concentrations were reduced by a mean of 68%. In London after 90 min of operation, PM2.5 concentrations were reduced by a mean of 45%. Differences between sites may be attributable to differing use in regard to fan speed, different window operations and ventilation, and differing indoor source generation.
Figure 3. Change in the mean concentration of PM2.5 in bedrooms using home air purifiers. Start measurements at time 0, with minutes of run time shown. Top: Eindhoven, Middle: Helsinki, Bottom: London.
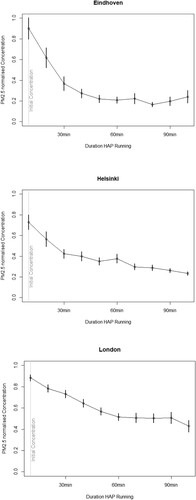
Normalized concentrations were used for the decay curves because data from the internal HAP sensors were used in this analysis. This was to avoid conflicts or differences between the different types of external sensors deployed in each city. The HAP sensors could not be fully calibrated however, calibrated sensors collocated with the HAPs were in strong agreement with the levels measured by the air purifiers (R2 = 0.9, RMSE = 4.5 µg/m3, MBE = −0.16 µg/m3). Technical specifications that include CADR by fan speed are shown in . Hourly patterns indicated that the concentration of particulate matter is correlated with fan speed. That is, the higher the fan speeds the lower the concentration of PM2.5.
Table 2. Air purifier flow rate and clean air delivery rate (CADR) by mode.
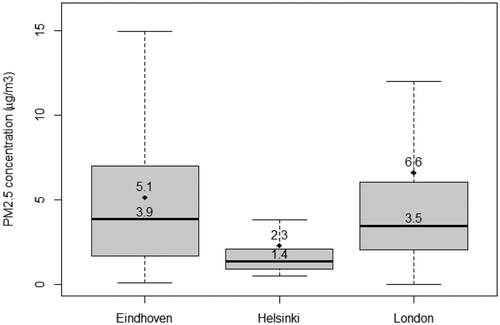
Indoor concentrations of PM2.5 were typically below WHO guidelines in all cities (measured by outdoor and indoor instruments), with the homes in Helsinki exhibiting the lowest outdoor and indoor (mean: 2.3 µg/m3) PM2.5 levels, London and Eindhoven had very similar median PM2.5 concentrations, however, the range in Eindhoven was greater. This difference could be explained as Eindhoven included 19 different locations, and London had only two sites. Whilst the mean in London was higher 6.6 µg/m3, compared with 5.1 µg/m3 in Eindhoven ().
Figure 4. Measured indoor PM2.5 concentration range in each of the partner cities, mean (diamonds), median (horizontal lines), and range for all three sites.
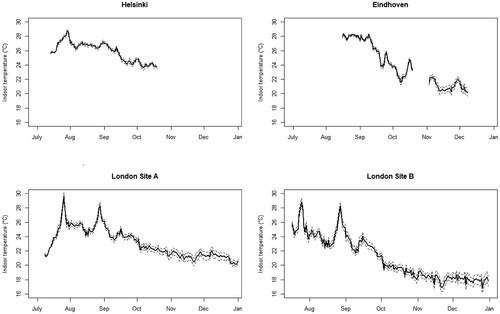
Indoor temperatures in all three cities ranged from a high near 30°C (in London) to a low of nearly 17°C (). Relative humidity (RH) in all locations remained within an acceptable range for occupant comfort (40–60%, see Supplemental Materials), and results from the BUS survey indicate that there was general satisfaction with the humidity of the homes in winter. There were no reports of problems with condensation, and no visible moisture or mould in any of the residences at the baseline or exit interviews. Correlations between temperature, or relative humidity, and PM2.5 were generally very weak, with Pearson's correlation factors all below +/- 0.5.
Figure 5. Indoor daily mean temperature is shown by the solid lines for each site. Dashed lines are 95% confidence intervals. (Missing temperature data in Eindhoven due to a server failure.)
Perceived indoor air quality
Sections of the Building Users’ Survey (Arup, Citation2020) were used to assess the satisfaction of occupants on a number of indoor environmental factors. Of the 22 factors that were scored, 5 were considered satisfactory in all cities: stillness of the air in winter, overall condition of the air in winter, control over lighting and noise, and the stability of the temperature in winter. Ten factors were marginal including: Odour of the air in summer and winter, overall condition of the air in summer, dryness of the air in winter, freshness of the air in winter, overall comfort, control over heating, stability of the temperature in summer, overall winter temperature, and the coldness of the winter temperature. Notably, seven factors were unsatisfactory including: humidity of the air in summer, stuffiness of the air in summer, stillness of the air in summer, control over cooling and ventilation, temperature in summer (too hot), and the overall comfort of temperature. A list of parameters and aggregate scores is shown in .
Table 3. A summary of parameters and scores (upper and lower limits) from the Building Users’ Survey (BUS).
Generally, occupants rated the indoor air quality poorer in the summer with a very high rate of dissatisfaction with the temperature, stuffiness and stillness of the air, as well as control over the cooling and ventilation.
HAP operation behaviour
Given that residents across all sites expressed some dissatisfaction with the warmth of the temperatures in their homes in summer, and that many felt that there was inadequate control over cooling and ventilation, and that the HAPs’ internal fans generate a ‘cooling’ effect, the pattern of use displayed below () is perhaps not surprising. A clear correlation between increasing temperatures and increasing HAP use is shown in the logistic regression model (). As there was no mechanical cooling available in the homes, the correlation between the outdoor and indoor temperatures was strong, suggesting that it is actually indoor temperature that influences HAP use.
Figure 6. Probability of air purifier use in relation to mean outdoor temperature (p < 0.05).
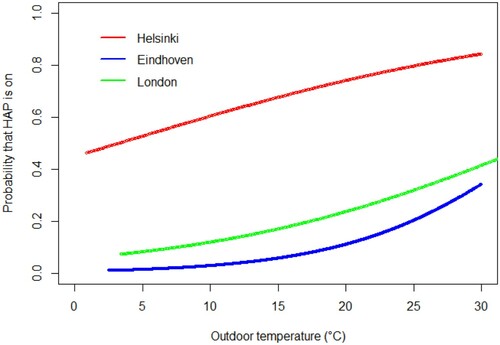
It is clear that the probability that the HAP was operating was greater with increasing outdoor temperatures, although the degree of use differed across the sites irrespective of temperature. For example, the predicted probability that the HAP was ON in London was approximately 0.42 when it was 30°C outside, whilst in Eindhoven at the same temperature the predicted probability was only about 0.35, but in Helsinki at 30°C the probability that the HAP was ON was nearly 0.82. The model provides good statistical evidence for the anecdotal finding that participants’ HAP use is driven by the perceived cooling effects of the devices. However, it does not provide insights into why the use, or temperature thresholds for use, differ between cities.
From interviews, people in all three cities generally expressed more satisfaction with the overall air quality and comfort in the cooler months which could contribute to a decline in the perceived utility of an air purifier, and decreased utilization. For participants in the group that was allowed to use the HAP in any manner they pleased during the entirety of the study period mean hours per day the HAP was ON (any speed) was 7.5, 14.1 and 10.4 for Eindhoven, Helsinki and London respectively. These usage means are also reflected in the logistic regression model shown in .
Another possible motivation for HAP use could include the health status of occupants. Healthy adults were recruited, however having specific health conditions did not prevent people from participating. Thirty-three (58%) of the participants reported having allergies, 10 (18%) reported having asthma, 12 (21%) reported frequent respiratory infections, and 3 (5%) participants had been diagnosed with COPD. Only 13 participants reported no symptoms of allergies, asthma, frequent respiratory infections, or COPD. However, no statistical associations between frequency of use, or duration of use, of the devices and any of the health conditions were found.
Discussion
Principal findings
The results of the work presented here demonstrate the effectiveness of HEPA air purifiers to reduce indoor PM2.5 concentrations. Although reductions are reported for running times of 90 min, it is worth noting that the actual running time of air purifiers was typically much longer. This was the case especially in warmer weather, which could lead to larger reductions for longer periods of time. However, there were also many conditions and times, either due to thermal comfort or perceived air quality, in which residents did not use their HAPs at all.
The participants in this study generally reported dissatisfaction with several aspects of their indoor environment, in particular during the warmer months. The combination of the residents’ opinions that the quality of the indoor environment of their homes was better in the cooler months and that the air purifiers had a cooling effect, may lead residents to use the air purifier less often, or inconsistently, in the heating months, irrespective of the actual air quality.
Many of the standards of practice for ventilation are based upon what is perceived as acceptable air quality by occupants, however, there is little evidence that people’s perception correlates with actual air quality. The evidence presented here indicates it does not. Notably, although Helsinki had the lowest median daily PM2.5 concentration (1.4 µg/m3), they had the highest daily mean HAP use (14.1 h), with London use at 10.4 and Eindhoven occupants using HAPs only 7.5 h daily. The perception of indoor air quality is influenced by many factors including relative humidity, noise, and most importantly, temperature. Those participants in the work presented here who reported their motivations for HAP use did not, in large measure, use the HAPs for their intended benefit of reduction in particulate matter.
In The Netherlands, the types of homes in this study varied widely; flats, semi-detached, and detached houses with mechanical and natural ventilation systems were included in the monitoring campaign. Perhaps as a consequence of this variety, the median PM2.5 concentrations spanned a larger range, and the use of the air purifiers also varied more widely, than in the flats in Helsinki or London. Due to the heterogeneity of the Dutch cohort, as well as different monitoring setup in The Netherlands, interpreting the results of this study presents some challenges. However, given the recognized shortcomings of some ventilation strategies, the measured indoor PM2.5 concentration and the effectiveness of the HAPs is noteworthy.
Relation to similar research
The reduction in PM2.5 seen in the work presented here, with means of 45% to 69% after 90 min, is in line with reductions found in other studies. This study differed from many previous studies in the length of the studied period of approximately six months. Most other research on HAPs monitored for only days or weeks, no other similar work was found that monitored for more than 21 days.
There is very little published research on occupants’ operation of air purifiers and the two studies that were found differed substantially in their findings. Personal health motivations were suggested by one study (Pei et al., Citation2019) as the reason for the substantial difference in the use patterns found in their study and those reported by Piazza et al. (Citation2006). The findings from the work presented here do not support that supposition. No correlation between reported health conditions and HAP use was seen, despite many of the participants saying in the baseline interviews that they were concerned about the impact of air pollution on their personal health.
Limitations
Due to the agreements and coordination between the different sites and cities, the monitoring times and durations were not the same (see ). As a result, unlike in London and Eindhoven, data in Helsinki was only collected from July until the middle of October. Therefore, information for occupant use of HAPs during the coldest time of the year is missing for Helsinki. Patterns still emerge, however, that are consistent across all three sites.
Another potential limitation of this study was the lack of a sham device. Participants were aware when the HAP was off and therefore may have believed that the air quality was poor when it was not. An additional limitation of the work presented here was that the devices used to measure the indoor air quality were not the same in all three cities. The difference between the sensors could lead to differences in absolute concentrations. Some of this limitation was overcome in the analysis of the PM2.5 decay through the use of the sensors internal to the HAPs, which were all the same make and model. It should also be noted that this study used only one type of HAP from one manufacturer (Philips), however similar results are expected from devices with equivalent specifications from other manufacturers.
A potential factor that should be considered in HAP utilization, and may be a limitation in this study, was the cost of operating the device. Participants were provided with the HAPs for the duration of the study at no cost, but electricity to operate the device was paid for by the occupants. Although operational costs were relatively low, at approximately €2–4 per month, they were not negligible for some participants, and remain a limitation in our understanding of the motivations that could influence occupant behaviour. Additionally, the first-time cost of purchasing an air purifier may also be beyond the financial capacity of many people.
Implications and impact
CO2 was monitored in this study in London (both living room and bedroom) The London data were presented in a previous publication (Cooper et al., Citation2021). Those findings showed typical patterns of CO2 concentrations for the bedrooms of naturally ventilated buildings, that is, lower concentrations in the non-heating season and higher concentrations in the heating season, due to window operations. These findings support the conclusion that because occupants’ use of HAPs is positively correlated with temperature, as is window opening, the benefits of reduced PM2.5 from indoor sources using HAPs may be reduced, especially in the heating season. The winter period is typically associated with (1) higher outdoor air pollution levels, (2) lower natural ventilation rates (i.e. opening of windows) and (3) potential additional indoor emissions (e.g. wood stoves, candles). There is therefore a greater risk that low rates of HAP utilization in the heating season could lead to unacceptable indoor air quality when ventilation rates from natural ventilation are typically very low. If users prioritize thermal comfort over indoor air quality, they may not respond appropriately to the actual risk of PM2.5 exposure.
In the rooms in which they are located, commercially available home air purifiers utilizing HEPA filtration, do a good job of reducing PM2.5 levels in the indoor air. However, if occupants fail to use them because of a misperception of risk, or due to a misunderstanding of their utility, solutions that automate functionality are one reasonable approach to ensure the devices are working as intended and to their full capacity. Recommendations to provide internal sensors (a feature that is currently available), default ON (user must opt-out of HAP use), and integration with outdoor air quality data are also options that could allow the HAPs to function more effectively to reduce PM2.5.
The present study collected evidence on indoor and outdoor PM2.5 dynamics at different households in each of the partner cities. Generally, indoor PM2.5 levels were much lower than outdoor levels. Nevertheless, indoor concentrations reflected outdoor concentrations and recurrent events of indoor PM2.5 generation could often be observed that exceeded outdoor concentrations (e.g. cooking). The timing, size and periodicity of these events were found to be household specific. Participants reported dissatisfaction with many of the conditions in their homes in summer, in particular high temperatures, stillness and stuffiness of air, and insufficient control over cooling. These conditions may be affected by the use of air purifiers due to the fan-driven air. However, poor air quality persists throughout the year, and may increase in the non-heating season in naturally ventilated homes due to reduced window opening. Therefore, it is important to consider other motivations of air purifier use, or other control solutions, if air purifiers are to be used for year-round removal of particulate matter.
If occupant behaviour towards the air purifiers could be better managed to reflect indoor air pollution levels rather than thermal conditions, better HAP performance (higher and more consistent PM2.5 reductions) is achievable, ultimately aiding in the mitigation of the negative health effects of exposure whilst at home.
Conclusions
Unanswered questions and future work
This study included questions on sleep and wellbeing at both the baseline and exit interviews to try to better understand the impact the HAPs might have. Although there were trends that indicated reported improvement in sleep quality, they did not reach statistical significance in most cases (see Supplemental Materials). Questions regarding associations between sleep quality and wellbeing remain important areas of inquiry and future work should be undertaken in this area.
As with the questions of sleep and wellbeing, additional work should be done to understand any connections between home air purifier use and perceived improvements in health, as the evidence found in the literature remains weak. The level of reduction found in this work, and reported elsewhere, suggests that health outcomes of conditions such as asthma, lung cancer, stroke, ischemic heart disease, and chronic lung disease could be improved with consistent and long-term use of HAPs in homes. More work should be done to understand the impact of HAP use on population health and mortality.
COVID-19 has brought wider attention to issues of indoor air quality, and the use of HAPs has been an area of new interest for airborne infection control. Future research will likely include a greater focus on the design and operation of buildings that reduce the risk of infection, and HAPs could play a role in the mitigation of this risk. More research should be done across multiple settings (e.g. offices, schools) with different building ventilation system types. The work presented here could contribute to this work and provide insights into why or when people choose to operate HAPs. Indoor operating temperature should be considered when specifying any occupant-controlled device, especially when part of a critical infection control system.
This study had one of the longest study periods of any found in the literature, however additional research would benefit from a longer study period (a full year), with a greater number of participants, and a range of measured pollutants (e.g. NO2 and TVOCs). That being said, the results presented here remain important due to the demonstrated adverse health impacts of PM2.5. This paper considered a study with air purifiers in homes with already low outdoor and indoor PM2.5 levels and it is not known that the reported findings on air quality perception and device use hold true for areas or homes where PM2.5 levels are very high. Additional studies in locations with high ambient PM2.5 concentrations, as well as different climatological conditions (e.g. in Southern Europe, North America, and South Asia), should be undertaken to better understand these relationships.
As was noted earlier in this paper, although the HAPs in this study were lent to the participants at no cost, they were still responsible for the cost of electricity. Given that even this relatively small monthly financial outlay presented a nonnegligible burden for some, the cost of acquiring a new device along with maintenance and operation may be too much of a barrier to adoption for many people. This economic reality may be especially true for areas of the world that have the worst outdoor air conditions which impact indoor air. Therefore, although these devices may provide health benefits to those that have them, a reliance upon expensive devices to mitigate poor indoor air quality could exacerbate existing inequalities globally.
Supplemental Material
Download MS Word (192.1 KB)Acknowledgements
The authors would like to acknowledge the contributions of Kimmo Raivio and Johanna Lönnqvist with Forum Virium Helsinki. All aspects of the work involving human participants were in accordance with, and approved by, the ethical standards of the institution (University College London) and with the 1964 Helsinki declaration and its later amendments or comparable ethical standards.
Disclosure statement
The authors from UCL, imec, and Forum Virium declare that they have no known competing financial interests or personal relationships that could have appeared to influence the work reported in this paper. The authors affiliated with Philips declare the following financial interests/personal relationships which may be considered as potential competing interests: Philips manufactures portable home air purifiers and supplied the HAPs for this study.
Additional information
Funding
References
- Allen, R., Carlsten C., Karlen, B., Leckie, S., van Eeden, S., Vedal, S., Wong, I., & Brauer, M. (2011). The impact of portable air filters on indoor air pollution and cardiovascular health in a woodsmoke-impacted community in British Columbia, Canada. Epidemiology, 22. https://doi.org/https://doi.org/10.1097/01.ede.0000392248.67402.2c
- Andersen, R., Fabi, V., Toftum, J., Corgnati, S. P., & Olesen, B. W. (2013). Window opening behaviour modelled from measurements in Danish dwellings. Building and Environment, 69, 101–113. https://doi.org/https://doi.org/10.1016/j.buildenv.2013.07.005
- Anderson, J. O., Thundiyil, J. G., & Stolbach, A. (2012). Clearing the air: A review of the effects of particulate matter air pollution on human health. Journal of Medical Toxicology, 8(2), 166–175. https://doi.org/https://doi.org/10.1007/s13181-011-0203-1
- Arup. (2020). Occupant satisfaction evaluation. https://busmethodology.org.uk/
- Balvers, J., Bogers, R., Jongeneel, R., van Kamp, I., Boerstra, A., & van Dijken, F. (2012). Mechanical ventilation in recently built Dutch homes: Technical shortcomings, possibilities for improvement, perceived indoor environment and health effects. Architectural Science Review, 55(1), 4–14. https://doi.org/https://doi.org/10.1080/00038628.2011.641736
- Barn, P., Gombojav, E., Ochir, C., Laagan, B., Beejin, B., Naidan, G., & Allen, R. W. (2018). The effect of portable HEPA filter air cleaners on indoor PM2.5 concentrations and second hand tobacco smoke exposure among pregnant women in Ulaanbaatar, Mongolia: The UGAAR randomized controlled trial. Science of the Total Environment, 615, 1379–1389. https://doi.org/https://doi.org/10.1016/j.scitotenv.2017.09.291
- Batterman, S., Du, L., Mentz, G., Mukherjee, B., Parker, E., Godwin, C., & Lewis, T. (2012). Particulate matter concentrations in residences: An intervention study evaluating stand-alone filters and air conditioners. Indoor Air, 22(3), 235–252. https://doi.org/https://doi.org/10.1111/j.1600-0668.2011.00761.x
- Brugge, D., Simon, M. C., Hudda, N., Zellmer, M., Corlin, L., Cleland, S., & Durant, J. L. (2017). Lessons from in-home air filtration intervention trials to reduce urban ultrafine particle number concentrations. Building and Environment, 126, 266–275. https://doi.org/https://doi.org/10.1016/j.buildenv.2017.10.007
- Buysse, D., Reynolds, C., Monk, T., Berman, S., & Kupfer, D. (1989). The Pittsburgh sleep quality index: A new instrument for psychiatric practice and research. Psychiatry Research, 28(2), 193–213. https://doi.org/https://doi.org/10.1016/0165-1781(89)90047-4
- Calì, D., Andersen, R. K., Müller, D., & Olesen, B. W. (2016). Analysis of occupants’ behavior related to the use of windows in German households. Building and Environment, 103, 54–69. https://doi.org/https://doi.org/10.1016/j.buildenv.2016.03.024
- Cohen, R., Standeven, M., Bordass, B., & Leaman, A. (2001). Assessing building performance in use 1: The probe process. Building Research & Information, 29(2), 85–102. https://doi.org/https://doi.org/10.1080/09613210010008018
- Cooper, E., Wang, Y., Stamp, S., Burman, E., & Mumovic, D. (2021). Use of portable air purifiers in homes: Operating behaviour, effect on indoor PM2.5 and perceived indoor air quality. Building and Environment, 191, Article 107621. https://doi.org/https://doi.org/10.1016/j.buildenv.2021.107621
- Crouse, D. L., Peters, P. A., van Donkelaar, A., Goldberg, M. S., Villeneuve, P. J., Brion, O., & Burnett, R. T. (2012). Risk of nonaccidental and cardiovascular mortality in relation to long-term exposure to low concentrations of fine particulate matter: A Canadian national-level cohort study. Environmental Health Perspectives, 120(5), 708–714. https://doi.org/https://doi.org/10.1289/ehp.1104049
- Day, J. K., McIlvennie, C., Brackley, C., Tarantini, M., Piselli, C., Hahn, J., & Kjærgaard, M. B. (2020). A review of select human-building interfaces and their relationship to human behavior, energy use and occupant comfort. Building and Environment, 178, Article 106920. https://doi.org/https://doi.org/10.1016/j.buildenv.2020.106920
- Dimitroulopoulou, C. (2012). Ventilation in European dwellings: A review. Building and Environment, 47, 109–125. https://doi.org/https://doi.org/10.1016/j.buildenv.2011.07.016
- Dimitroulopoulou, C., Crump, D., Coward, S., Brown, B., Squire, R., Mann, H., & Ross, D. (2005). Ventilation, air tightness and indoor air quality in new homes. BR477, BRE Bookshop.
- Fang, L., Wyon D. P., Clausen, D., & Fanger, G. (2004). Impact of indoor air temperature and humidity in an office on perceived air quality, SBS symptoms and performance. Indoor Air, 14(s7), 74–81. https://doi.org/https://doi.org/10.1111/j.1600-0668.2004.00276.x
- Fisk, W. J. (2018). How home ventilation rates affect health: A literature review. Indoor Air, 28(4), 473–487. https://doi.org/https://doi.org/10.1111/ina.12469
- Fisk, W. J., & Chan, W. R. (2017a). Effectiveness and cost of reducing particle-related mortality with particle filtration. Indoor Air, 27(5), 909–920. https://doi.org/https://doi.org/10.1111/ina.12371
- Fisk, W. J., & Chan, W. R. (2017b). Health benefits and costs of filtration interventions that reduce indoor exposure to PM2.5 during wildfires. Indoor Air, 27(1), 191–204. https://doi.org/https://doi.org/10.1111/ina.12285
- Global residential air purifiers market: Growth, trends, COVID-19 impact and forecasts. (2021, July 7). Business Wire.
- Jenkinson, C., Layte, R., Jenkinson, D., Lawrence, K., Petersen, S., Paice, C., & Stradling, J. (1997). A shorter form health survey: Can the SF-12 replicate results from the SF-36 in longitudinal studies? Journal of Public Health, 19(2), 179–186. https://doi.org/https://doi.org/10.1093/oxfordjournals.pubmed.a024606
- Jeong, B., Jeong, J.-W., & Park, J. (2016). Occupant behavior regarding the manual control of windows in residential buildings. Energy and Buildings, 127, 206–216. https://doi.org/https://doi.org/10.1016/j.enbuild.2016.05.097
- Kaviany, P., Brigham, E. P., Collaco, J. M., Rice, J. L., Woo, H., Wood, M., & Koehler, K. (2021). Patterns and predictors of air purifier adherence in children with asthma living in low-income, urban households. Journal of Asthma, 1–10. https://doi.org/https://doi.org/10.1080/02770903.2021.1893745
- Klepeis, N. N. W., & Ott, W. (2001). The National Human Activity Pattern Survey (NHAPS): A resource for assessing exposure to environmental pollutants. Journal of Exposure Analysis and Environmental Epidemiology, 11(3), 231–252. https://doi.org/https://doi.org/10.1038/sj.jea.7500165
- Kurnitski, J., Eskola, L., Palonen, J., & Seppänen, O. (2007). Use of mechanical ventilation in Finnish houses. In Proceedings of 2. Europäisches BlowerDoor-Symposium, Kassel, 16–17 March 2007, 152–161. Kassel, Germany: European BlowerDoor-Symposium.
- Laden, F., Schwartz, J., Speizer, F. E., & Dockery, D. W. (2006). Reduction in fine particulate air pollution and mortality: Extended follow-up of the Harvard six cities study. American Journal of Respiratory and Critical Care Medicine, 173(6), 667–672. https://doi.org/https://doi.org/10.1164/rccm.200503-443OC
- Langer, S., Ramalho, O., Le Ponner, E., Derbez, M., Kirchner, S., & Mandin, C. (2017). Perceived indoor air quality and its relationship to air pollutants in French dwellings. Indoor Air, 27(6), 1168–1176. https://doi.org/https://doi.org/10.1111/ina.12393
- Logue, J. M., Price, P. N., Sherman, M. H., & Singer, B. C. (2012). A method to estimate the chronic health impact of air pollutants in U.S. residences. Environmental Health Perspectives, 120(2), 216–222. https://doi.org/https://doi.org/10.1289/ehp.1104035
- Maestas, M. M., Brook, R. D., Ziemba, R. A., Li, F., Crane, R. C., Klaver, Z. M., & Morishita, M. (2019). Reduction of personal PM2.5 exposure via indoor air filtration systems in Detroit: An intervention study. Journal of Exposure Science and Environmental Epidemiology, 29(4), 484–490. https://doi.org/https://doi.org/10.1038/s41370-018-0085-2
- McNamara, M. L., Thornburg, J., Semmens, E. O., Ward, T. J., & Noonan, C. W. (2017). Reducing indoor air pollutants with air filtration units in wood stove homes. Science of the Total Environment, 592, 488–494. https://doi.org/https://doi.org/10.1016/j.scitotenv.2017.03.111
- Novoselac, A., & Siegel, J. A. (2009). Impact of placement of portable air cleaning devices in multizone residential environments. Building and Environment, 44(12), 2348–2356. https://doi.org/https://doi.org/10.1016/j.buildenv.2009.03.023
- Ostro B. D., & Rothschild, S. (1989). Air pollution and acute respiratory morbidity: An observational study of multiple pollutants. Environmental Research, 50(2), 238–247. https://doi.org/https://doi.org/10.1016/S0013-9351(89)80004-0
- Park, H. K., Cheng, K. C., Tetteh, A. O., Hildemann, L. M., & Nadeau, K. C. (2017). Effectiveness of air purifier on health outcomes and indoor particles in homes of children with allergic diseases in Fresno, California: A pilot study. Journal of Asthma, 54(4), 341–346. https://doi.org/https://doi.org/10.1080/02770903.2016.1218011
- Pei, J., Dong, C., & Liu, J. (2019). Operating behavior and corresponding performance of portable air cleaners in residential buildings, China. Building and Environment, 147, 473–481. https://doi.org/https://doi.org/10.1016/j.buildenv.2018.08.009
- Piazza, T. L., Lee, R. H., & Hayes, J. (2006). Survey of the use of ozone-generating air cleaners by the California public.
- Pope, C. A., Burnett, R., Thun, M., Calle, E., Krewski, D., Ito, K., & Thurston, G. (2002). Lung cancer, cardiopulmonary mortality, and long-term exposure to fine particulate air pollution. JAMA, 287, 1132–1141. https://doi.org/https://doi.org/10.1001/jama.287.9.1132
- Pope, C. A., Coleman, N., Pond, Z. A., & Burnett, R. T. (2020). Fine particulate air pollution and human mortality: 25+ years of cohort studies. Environmental Research, 183, Article 108924. https://doi.org/https://doi.org/10.1016/j.envres.2019.108924
- Pope, C. A., 3rd, & Dockery, D. W. (2006). Health effects of fine particulate air pollution: Lines that connect. Journal of the Air and Waste Management Association, 56(6), 709–742. https://doi.org/https://doi.org/10.1080/10473289.2006.10464485
- R Core Team. (2018). R: A language and environment for statistical computing. R Foundation for Statistical Computing. https://www.R-project.org/
- Rijal, H. B., Tuohy, P., Humphreys, M. A., Nicol, J. F., Samuel, A., Raja, I. A., & Clarke, J. (2008). Development of adaptive algorithms for the operation of windows, fans, and doors to predict thermal comfort and energy use in Pakistani buildings. American Society of Heating Refrigerating and Air Conditioning Engineers (ASHRAE) Transactions, 114(2), 555–573.
- Rotko, T. O. L., Kunzli, N., Carrer, P., Nieuwenhuijsen, M., & Jantunen, M. (2002). Determinants of perceived air pollution annoyance and association between annoyance scores and air pollution (PM2.5, NO2) concentrations in the European EXPOLIS study. Atmospheric Environment, 36(29), 4593–4602. https://doi.org/https://doi.org/10.1016/S1352-2310(02)00465-X
- Samet, J. (1993). Indoor air pollution: A public health perspective. Indoor Air, 3(4), 219–226. https://doi.org/https://doi.org/10.1111/j.1600-0668.1993.00002.x
- Schwartz J., Slater D., Larson, T., Pierson, L., & Koenig, J. (1993). Particulate air pollution and hospital emergency room visits for asthma in Seattle. American Review of Respiratory Disease, 147(4), 826–831. https://doi.org/https://doi.org/10.1164/ajrccm/147.4.826
- Schweiker, M., Ampatzi, E., Andargie, M. S., Andersen, R. K., Azar, E., Barthelmes, V. M., & Zhang, S. (2020). Review of multi-domain approaches to indoor environmental perception and behaviour. Building and Environment, 176, Article 106804. https://doi.org/https://doi.org/10.1016/j.buildenv.2020.106804
- Shao, D. Q., Du, Y. P., Liu, S., Brunekreef, B., Meliefste, K., Zhao, Q., & Huang, W. (2017). Cardiorespiratory responses of air filtration: A randomized crossover intervention trial in seniors living in Beijing. Science of the Total Environment, 603–604, 541–549. https://doi.org/https://doi.org/10.1016/j.scitotenv.2017.06.095
- Shaughnessy, R. J., & Sextro, R. G. (2006). What is an effective portable air cleaning device? A review. Journal of Occupational and Environmental Hygiene, 3(4), 169–181. https://doi.org/https://doi.org/10.1080/15459620600580129
- Shrubsole, C., MacMillan, A., Davies, M., & May, N. (2014). 100 unintended consequences of policies to improve energy efficiency of the UK housing stock. Indoor and Built Environment, 23(3), 340–352. https://doi.org/https://doi.org/10.1177/1420326X14524586
- Spilak, M. P., Karottki, G. D., Kolarik, B., Frederiksen, M., Loft, S., & Gunnarsen, L. (2014). Evaluation of building characteristics in 27 dwellings in Denmark and the effect of using particle filtration units on PM2.5 concentrations. Building and Environment, 73, 55–63. https://doi.org/https://doi.org/10.1016/j.buildenv.2013.11.020
- van der Wal, J. F., Moons, A. M., & Cornelissen, H. J. (1991). Indoor air quality in renovated Dutch homes. Indoor Air, 1(4), 621–633.
- Vyas, S., Srivastav, N., & Spears, D. (2016). An experiment with air purifiers in Delhi during winter 2015–2016. PLoS One, 11, 12. https://doi.org/https://doi.org/10.1371/journal.pone.0167999
- Weichenthal, S., Mallach, G., Kulka, R., Black, A., Wheeler, A., You, H., & Sharp, D. (2013). A randomized double-blind crossover study of indoor air filtration and acute changes in cardiorespiratory health in a first nations community. Indoor Air, 23(3), 175–184. https://doi.org/https://doi.org/10.1111/ina.12019
- Weisel, C. P., Zhang, J., Turpin, B. J., Morandi, M. T., Colome, S., Stock, T. H., & Shendell, D. (2005). Relationship of indoor, outdoor and personal air (RIOPA) study: Study design, methods and quality assurance/control results. Journal of Exposure Science and Environmental Epidemiology, 15(2), 123–137. https://doi.org/https://doi.org/10.1038/sj.jea.7500379
- Whitby, K. T., Anderson, G. R., & Rubow, K. L. (1983). Dynamic model for evaluating room-sized air cleaners. ASHRAE Transactions, 89-2A, 172–182.
- WHO. (2006). Air quality guidelines: Global update 2005: Particulate matter, ozone, nitrogen dioxide, and sulfur dioxide. World Health Organization.
- WHO. (2013). Health effects of particulate matter: Policy implications for countries in Eastern Europe, Caucasus and Central Asia. Retrieved March from www.euro.who.int>pdf_file>Health-effects-of-particulate-matter-final-Eng
- WHO. (2019). Global burden of disease. https://www.who.int/data/gho/data/themes/mortality-and-global-health-estimates
- Zhan, Y., Johnson, K., Norris, C., Shafer, M. M., Bergin, M. H., Zhang, Y., & Schauer, J. J. (2018). The influence of air cleaners on indoor particulate matter components and oxidative potential in residential households in Beijing. Science of the Total Environment, 626, 507–518. https://doi.org/https://doi.org/10.1016/j.scitotenv.2018.01.024