
 ?Mathematical formulae have been encoded as MathML and are displayed in this HTML version using MathJax in order to improve their display. Uncheck the box to turn MathJax off. This feature requires Javascript. Click on a formula to zoom.
ABSTRACT
Laser scanning 3D technology is gaining prominence in Architecture, Engineering and Construction, aiming to organize space and shape the human environment. Main advantages of laser scanning, such as efficiency, high accuracy and precision, low time consumption, safety, and non-invasiveness, provide technological support for sustainable development goals. Obtaining a point cloud using laser scanning and creating 3D models allows producing a highly detailed computer image of a measuring facility. The resulting spatial model of the building makes it possible to prepare inventory documentation, conduct construction analyses, and widely support technical facility management. The use of detailed data about a single building is becoming possible to enrich BIM (Building Information Modelling) or GEOBIM (geospatial environment with BIM). The present paper discusses the measurement and modelling of buildings using both terrestrial laser scanning. As an auxiliary method, close-range photogrammetry was carried out from an unmanned aerial vehicle. For this purpose, models were created of three facilities located in Poland. Particular attention was drawn to analysing potential errors in mapping. Direct geometry measurements were performed, and statistical analyses, deviations of actual lengths were specified. The results obtained have indicated that the measurement accuracy of existing buildings and its digital model is better than ±1 cm.
Introduction
Scan-to-BIM technology: a brief overview
Laser scanning technology has been in use since the 1980s, and its most common applications are various types of measurement (Suchocki & Katzer, Citation2018). Current fields of application of 3D laser scanning include mining (Wang et al., Citation2018), structural geological mapping (Török et al., Citation2020), topographic mapping (Li et al., Citation2019), underground objects (Bieda et al., Citation2020), archaeological works (Bochenska et al., Citation2019), civil infrastructures and city management (Ye et al., Citation2019). Major benefits are noted in architecture and construction. The use of 3D laser scanning technology for building measurement allows us to obtain a point cloud and, subsequently, generate digital documentation that would make it possible to create a BIM (Building Information Modelling) model of a scanned object. The BIM technology holds enormous potential for improving the level of automation in the Architecture, Engineering, and Construction (AEC) sector and is increasingly becoming a standard in many countries (Biolek et al., Citation2019; Hamma-adama & Kouider, Citation2019; Park & Lee, Citation2017; Vilutiene et al., Citation2019). The benefits of using the BIM approach are widely discussed in the literature; however, they may be hard to achieve if appropriate attention is not minimizing the barriers to implementing this technology (Leśniak et al., Citation2021). The advantages range from faster design combined with early-stage automatic collision detection; through 3D visualizations combined with a higher quality of technical documentation, cloud-based information access in every stage of a project, enhancement of work and communication efficiency; to the possibility of BIM model used within the entire life cycle of a structure. The research (Leśniak et al., Citation2021) indicates the most common barriers to BIM implementation are, among others, lack of knowledge and experience, lack of experts, lack of government regulation about BIM and legislative barriers. It is worth mentioning that Poland follows typical phases of BIM implementation – from cautious interest (grassroots initiatives in the private sector, associations and foundations), through technology implementation in major foreign-owned design and engineering companies, pilot programmes initiated by public investors (especially infrastructure investors), to the elaboration of the 2020 Polish BIM standard (‘BIM Standard PL, Citation2020’) with the aim of universal adoption of the BIM approach in the Polish construction industry.
Combining modern technologies, such as laser scanning, with BIM can be a powerful tool to optimize the process, providing accurate data in less time (Qiu et al., Citation2021; Utica et al., Citation2017). The benefits of employing BIM in land engineering relate to alternative design and calculation analyses, material analyses, data management, operational plans, and information exchange between various entities (Brumana et al., Citation2020; Rocha et al., Citation2020). It is worth underscoring that in the publication by Sepasgozaara et al. (Citation2017), key factors influencing the scanner acceptance were identified, and the scanner technology acceptance model was developed to evaluate the performance of these technologies for 3D building modelling in BIM. These factors include scanner performance expectancy, effort expectancy, organization self-efficacy and user efficacy. Field experiments allowed identifying two additional factors: implementation facilitating support and maintenance support.
Many recent publications on laser scanning in civil engineering have considered the preparation step of the development process. During its making, problems may arise related to performing mapping and topographic measurements at future construction sites, especially rugged and inaccessible areas. It can cause danger and trouble measurements to make. When planning construction projects, it is essential to have the most recent and accurate data about the development site. The data may be obtained by scanning the future construction site (Yin et al., Citation2019). This is also important if one takes into account the use of BIM for sustainable building management within the entire life cycle of a structure, with the consideration of digital data storing and sharing, information analyses, energetic efficiency in particular stages of the life cycle and green certification systems (Liu et al., Citation2021). According to Carvalho, utilizing the potential of BIM platforms could significantly contribute to creating a more sustainable urban environment (Carvalho et al., Citation2021).
The next stage of the development process concerns the execution of construction works and verifying construction progress. Appropriate planning and effective control and monitoring are important for a construction project's successful execution (Konior & Szóstak, Citation2020). The publication by Shih (Citation2002) proposed a method for representing the construction site through the data retrieved from a 3D scanner. Using a long-range 3D laser scanner to collect information about the events that occur at the construction site, the building's construction process can be described. The obtained point clouds may be stored as records or may be initialized as geometry shapes for analysis and visualization. Monitoring construction progress and controlling dimensional integrity is necessary for enabling the decision-makers to identify the discrepancies between the project's as-planned and as-built state. In engineering practice, monitoring, measurement and evaluation of construction progress are frequently performed manually, making it time-consuming, labour-intensive and prone to errors, especially in large-scale projects (Maalek & Sadeghpour, Citation2013).
Furthermore, according to Maalek et al. (Citation2018), supervisory staff dedicates 30–50% of their time to these tasks. The current limitations related to the practice of manual monitoring can be overcome by employing laser scanning (TLS – terrestrial laser scanning, ALS – airborne laser scanning, MLS – mobile laser scanning) for obtaining 3D point clouds from the construction site. Maalek et al. (Citation2018) propose an innovative approach towards collecting and analysing data necessary to monitor the construction process. The authors indicated that the point clouds obtained in a dynamic and complex environment, such as a construction site, contain outliers. The robust, complete linkage sectionation algorithm was thus proposed to obtain a point cloud using the sectionation method, which ensures results that are not a function of a subjectively predefined threshold or a similarity threshold. Other examples and analyses of monitoring progress at a construction site may be found, i.e. in the publications by Moon et al. (Citation2019), Nowogońska (Citation2019), Rebolj et al. (Citation2017), Wang et al. (Citation2020).
By analysing the project's operational stage, one may observe multiple examples of employing the 3D laser scanning technology in existing buildings. Since the subject of TLS and photogrammetric measurement application is a broad one and was discussed in numerous articles, the present paper does not aim to provide a comprehensive analysis but an overview of the prevailing trends. Notwithstanding, it should be underscored that TLS and photogrammetric measurement has found their use in visualization and modelling of steel structures (Chacón et al., Citation2021); inventory of complex industrial, residential and historical buildings (Achakir et al., Citation2021; Baik et al., Citation2021; Wang et al. Citation2020); monitoring the state of structures, and measuring displacements and deformations (Korumaz et al., Citation2017) and automatic classification of construction materials (Moyano et al., Citation2021). Reverse engineering with 3D laser scanning and photogrammetry survey processes is becoming a standard procedure (Bartoli et al., Citation2020; Volk et al., Citation2014). Particularly is applied when there is a need to prepare missing project documentation, or where the documentation had been prepared many years earlier in the traditional form, and creating a BIM model is necessary as part of the building's renovation. This approach can be briefly called ‘Scan-to-BIM’ (survey, 3D modelling and BIM implementation) (Antón et al., Citation2018; Bruno & Roncella, Citation2019). The application of Scan-to-BIM in architecture and construction is becoming increasingly common. Examples include bridges (Lõhmus et al., Citation2018), tunnels (Cacciari & Futai, Citation2017), dams (Xu et al., Citation2019), industrial plant facilities (Kim et al., Citation2020), buildings and their indoors (Erdélyi et al., Citation2018) and historical buildings (Angulo-Fornos & Castellano-Román, Citation2020; Bruno & Roncella, Citation2019; Remondino, Citation2011). It is worth underscoring the benefits of the BIM model in the construction project's cost estimation in terms of quick extraction of information and data necessary as input for the developed predictive models. One example is the paper by Juszczyk et al. (Citation2019), where the input data use both quantitative variables (areas, volumes and lengths of particular elements) and categorical variables (applied materials, technology, expected construction quality). In Davidson et al. (Citation2020), it is argued that BIM gives great potential savings in cost and time and gives the BoQ (Bill of Quantities) newfound importance in future construction processes.
Despite the availability of multiple technological solutions, adjusting the scanner's position to scanned objects introduces certain limitations due to the geometry of the scanner-object system. As indicated in Warchoł, (Citation2015), aerial scanning in a given time interval allows for capturing a larger area and increases the speed of data collection, but with less precision and less accurate mapping of vertical surfaces. Next, terrestrial scanning is characterized by high accuracy and density but does not allow gathering certain information (e.g. the roof shape) and remains relatively time-consuming for larger areas. In contrast, mobile scanning and scanning from a mobile platform (e.g. a vehicle) increase the speed of data collection but does not eliminate other limitations of terrestrial scanning.
Two methods that may help resolve the above problems are 3D laser scanning and close-range photogrammetry using unmanned aerial vehicles (UAVs), which are increasingly applied in construction, architecture, land surveying and spatial planning. The obtained images and point clouds are used to create orthophoto that can become a basis for developing numerical terrain models (Anderson & Gaston, Citation2013), zone monitoring (Burdziakowski, Citation2017), an inspection of the hydrotechnical equipment technical condition and structures, updating information on agricultural and forest areas (Duffy et al., Citation2018) and investigating the pollutant distribution (Zheng et al., Citation2021). Further point clouds use is checking property tax declarations and determining road traffic intensity (Helman et al., Citation2018). In construction, architecture and spatial planning, low-altitude photogrammetry images acquired by drones are used during the construction and operation of engineering structures to capture difficult-to-reach surfaces and capacity objects, e.g. for record-keeping of roofs (including asbestos), cooling towers, tower blocks, dumping grounds and landfills (Khan et al., Citation2018). The images provide information used in sustainable spatial planning and land development for investment projects (Reinoso et al., Citation2018). As-built and inventory documentation prepared based on measurements taken using scanner and UAV, vector graphics, 2D projections, views, CAD (Computer-Aided Design) models and BIM models can be represented. The created BIM model (created from a point cloud obtained as a result of scanning and processed with the use of specialist software) allows aims to conduct construction analyses, renovation planning and efficient management of the object and its parameters.
The use of laser scanning and 3D models prepared in such an approach became more popular in various local, sustainable development aspects in the last decade. Studies show that this technology effectively supports monitoring of natural processes which influence the safety of human settlements (Dąbek et al., Citation2018), cultural heritage protection (Klapa et al., Citation2017; Sánchez-Aparicio et al., Citation2018), preventing climate change with the consideration of geological and hydrogeological conditions (Mielby & Sandersen, Citation2017; Price et al., Citation2018), hierarchization of sustainable development indicators for residential housing with the use of 3D models (Xu & Coors, Citation2012), air protection through optimal planning of urban ports (Casazza et al., Citation2019; Sztubecka & Sztubecki, Citation2016) or development of renewable energy (Grygierek et al., Citation2020; Mitka et al., Citation2019), contributing in that way to create the more sustainable built environment.
Building geometry and facade documentation is the primary use of scanning to BIM in buildings’ operation and maintenance phase. The building's shape undoubtedly has an impact on its costs but also has a significant impact on the environment (Feng et al., Citation2021; Huang et al., Citation2020) and energy performance (Iqbal & Chan, Citation2016). Data sets on the parameters of the geometry of a building object can help determine the relationship between the shape and the energy load of the building: lighting, heating and cooling. The authors of the works (Al-Anzi, Citation2009; Depecke et al., Citation2001) researched the relationship between the energy performance of buildings and their geometric configuration. Studies (van Eldik et al., Citation2020) have also been carried out to analyse the shape effect simultaneously in three aspects of the energy load: heating, air conditioning/cooling and lighting. The BIM model and properly designed geometry also make it possible to determine the coefficients of building compactness (total internal capacity divided by the total external surface), shape (total external surface divided by the total internal capacity),or other factors relating to the total wall surface divided by the total internal capacity and the total roof surface divided by the total internal capacity. In the early stages of refurbishment and renovation, the developed BIM building's model, geometry and shape can positively influence and minimize the energy load and negative environmental impact.
Presenting the options for developing a BIM model based on data obtained with the use of modern survey technologies led to defining the following study objectives:
Conducting a survey of three buildings: A – utility building, B – sports facility and C – sports hall, with the use of TLS as a basic inventory method for assessing building geometry, close-range photogrammetry via UAV, and physical measurement.
Performing a quantitative analysis (physical length measurements and statistical analyses) to determine the actual deviation of measured values in relation to the developed model, and evaluate the obtained results.
Identifying potential errors in the objects’ representation. Discussing applications and limitations of the proposed approach.
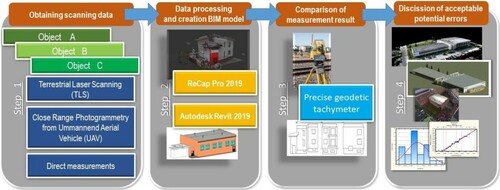
The article is organized as follows: the Materials and methods section describes how to obtain data using photogrammetric methods and verify their usefulness and accuracy. The Results and discussion section presents the results and discussion. The Conclusions section contains essential findings and conclusions and identifies various research trends. The conduct of the study for Scan-to-BIM approach as presented in the paper is illustrated in .
Figure 1. Research flow – Scan-to-BIM approach for the selected buildings.
Materials and methods
Many Polish buildings represent the typical post-communist architecture of uncomplicated geometric design, with no original or current design documentation available. The buildings are managed by public institutions that can apply for financial assistance in grants for renovation and modernization, additional equipment or adaptation to new functions. The preparation of each grant application involves preparing documentation and cost estimate, which is why it is essential to quickly and effectively obtain information on the geometry and properties of the buildings, and thus gain sufficient geometric parameters. Performed control measurements and statistical analyses aimed to verify the accuracy of the real objects’ geometric representation. They were conducted in the absence of domestic guidelines for conducting these types of assessments for the purpose of reverse BIM and construction inventory.
To estimate the geometric accuracy and utility of the 3D model, field measurements were performed for selected objects. The obtained models were verified via high-accuracy tacheometric measurements, and the results were subjected to basic statistical evaluation.
The Scan-to-BIM process () was performed for the following three illustrative building facilities located in south-eastern Poland, on the campus of Rzeszów University of Technology:
Object A – utility/laboratory building. Constructed using reinforced concrete technology, with three aboveground floors. Total surface area: 680 m2; cubic capacity: 8000 m3.
Object B – sports facility. A small gymnastics hall with additional rooms, i.e. changing rooms and staff rooms. A single-storey building constructed using traditional technology, with no underground floor. Total surface area: 235 m2; cubic capacity: 1650 m3.
Object C – sports hall. The building is composed of two main areas. The first area is a one-storey building constructed using traditional technology, comprising a gymnastics hall and staff rooms. The second area consists of a hall, a central section with changing rooms and staff rooms, and a gym. The building has two aboveground floors, with administrative offices on the upper floor. Constructed using steel frame technology, with laminated wall panels. Total surface area: 4200 m2; cubic capacity: 37,000 m3.
The measurement of each of the three building facilities involved applying various combinations of the following measurement technologies:
TLS using Faro Focus 3D laser scanner with a range up to 120 m and distance measurement accuracy of 2 mm with w in the range of 25 m. Angular measurement accuracy is not defined by the manufacturer;
supplementary close-range photogrammetry with a DJI Phantom 4 Advanced UAV. This system has GPS/GLONASS location capability and is equipped with a 1″ 20MP CMOS sensor, with 3-axis stabilizer;
supplementary direct measurements with the use of a handheld laser rangefinder.
Object reconstruction by merging and editing point clouds and data collected from other types of measurements was carried out using ReCap Pro 2019 and Autodesk Revit 2019 software.
For each of the buildings, reference values were measured using a Trimble M3 total station which allows acquiring discrete points with an angular precision of 2″ and distance precision of 2 mm + 2 ppm. Spatial distances between characteristic, easily identifiable points were designated as reference values. Distances were calculated based on tacheometric measurements of two endpoints of a section performed from the same measurement stand. The measurement stands were deliberately selected for the reference sections to include the elements modelled from different scans.
Subsequently, to estimate the accuracy of the representation, the results of control measurements were compared with the values obtained from the model created based on the point cloud.
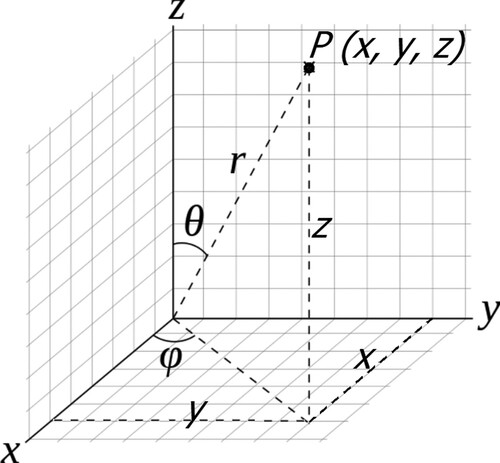
To estimate the accuracy of the representation, it is necessary first to determine the positions of the reference points. The positions of the reference points in a local, three-dimensional coordinate system, derived from total station measurements (), can be determined using the formulae:
(1)
(1)
(2)
(2)
(3)
(3) where r is the measured slope distance between the total station and the measuring point, φ the measured horizontal angle, θ the measured vertical angle.
Figure 2. The position of a point in space based on total station measurements.
As indicated in Ku (Citation1966), with the known measurement uncertainties characteristic of a given measuring device, the uncertainty of setting the coordinates of the measured point (mX, mY, mZ) will amount to
(4)
(4)
(5)
(5)
(6)
(6) where mr is the distance measurement uncertainty, mφ the horizontal angle measurement uncertainty and mθ the vertical angle measurement uncertainty.
For the total stations used to perform control measurements, the measurement uncertainties were as follows: mr = ±2 mm, mφ = mϴ = ±2″. Field tests carried out with these measuring instruments confirm the achievable accuracy in line with the manufacturers’ data (Beshr & Elnaga, Citation2011; Godek & Krupiński, Citation2012). The adopted values gave the following results for the maximally unfavourable measurement configuration for all three buildings: mX ≈ mY ≈ mZ ≈ ±1.2 mm.
From the coordinates of thus measured points, mutual distances between them were calculated based on the following formulae:
(7)
(7)
(8)
(8)
(9)
(9)
(10)
(10) where xA, yA, zA and xB, yB, zB are the coordinates of reference points at the ends of a section for which the length is calculated.
Each pair of points between which the control distance was determined was measured from the same instrument position to avoid centring and measurement orientation errors.
By applying the law of propagation of uncertainty, the measurement uncertainty of the differences of particular coordinates may be calculated
(11)
(11) Due to the comparable accuracy of setting all three coordinates, the following simplification is possible: mΔx ≈ mΔy ≈ mΔz ≈ mΔ ≈ ±1.7 mm.
Therefore, the uncertainty (mD) of length D will amount to:
(12)
(12) Due to the lack of precise information about measurement uncertainty for the laser scanner, measurement uncertainty data for the point cloud were assumed to be at a level of the results obtained from the tests carried out for this model of laser scanner (Chow et al., Citation2012), which were later indirectly confirmed during other independent tests (Hlotov & Kh, Citation2019; López F. et al., Citation2014). According to the results of these tests, the uncertainty of determining the 3D position of a point measured using the Faro Focus 3D laser scanner amounts to m3D = ±8 mm for the maximally unfavourable measurement configuration that occurred for all three buildings. If
(13)
(13) then, assuming equal uncertainty of coordinate determination
(14)
(14) The uncertainty of length d obtained from the laser-scan model, by analogy to the section regarding analysis of the total station measurements, can be determined at a level of
(15)
(15) In contrast, the uncertainty of difference of compared lengths (D – d) will amount to:
(16)
(16) Finally, the lengths D, calculated from the coordinates of reference points measured using the total station, were compared with the corresponding lengths d obtained from a model created in Autodesk Revit, and measurement differences were determined.
For the adopted assumptions, one may expect that in the entire population of the obtained differences between reference section lengths (D) and the corresponding lengths read from the created models (d), the standard deviation will be equal to the estimated value of mD-d. The expected value for this population of results would thus be 0. Due to a certain simplification of the point cloud during the process of fitting it to the model, deviations will apppear that will influence the mean value. The obtained mean value may indirectly indicate the accuracy of the model’s fitting to the point cloud. For the performed analyses, it is important to achieve the conformity of the obtained value of standard deviation estimator for the calculated values D−d, which the F-test confirmed.
Results and discussion
The process of developing 3D models of the examined objects
As already mentioned, for the experimental investigation, measurements were performed for three selected objects: A, B and C. The measurement methods for each object were as follows:
Object A – the measurements from both outside and inside the building were performed using a Faro Focus 3D laser scanner, whereas some measurements inside the smallest rooms were carried out with the use of a handheld laser rangefinder;
Object B – the measurements from both outside and inside the building were performed using a Faro Focus 3D laser scanner, whereas some measurements inside the smallest rooms were carried out with the use of a handheld laser rangefinder;
Object C – the measurements were performed using a Faro Focus 3D terrestrial scanner and a DJI Phantom 4 Advanced UAV to facilitate the modelling of the roof of the building.
The scanning for all objects was performed with a resolution of 7 mm/10 m for about 7 min at each site. Below are presented the measurements results performed for objects A, B and C, along with the visual representations of the results of BIM modelling.
Object A
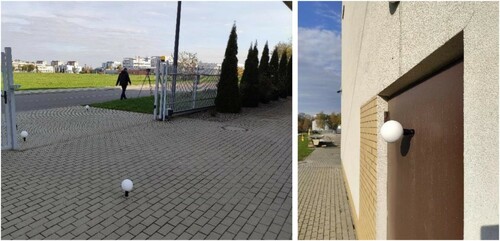
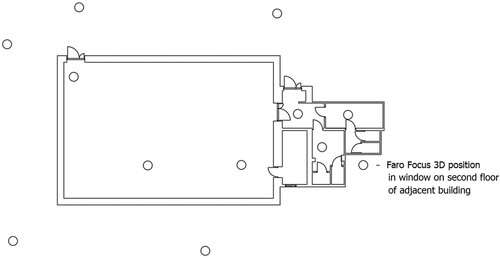
For Object A, outdoor measurements were performed using a Faro Focus 3D laser scanner. Outdoor scanning was carried out at six measuring sites (). The arrangement of measuring sites and adjustment points was planned to make it possible to merge individual scans. The adjustment points were arranged to allow them to be visible from as many sites as possible. To merge point clouds, a method was employed that consisted of matching common points in adjacent scans. Reference spheres () served as the common points.
Figure 3. Scanner sites to Object A. Only some of the inside scanner sites are visible.
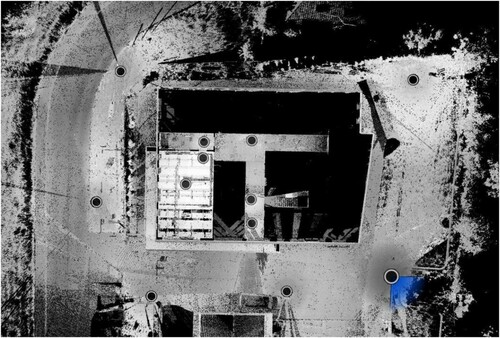
Figure 4. Reference spheres used for merging point clouds from individual scans into a single point cloud for an entire scanned object.
Indoor measurements were performed using both, Faro Focus 3D laser scanner and handheld laser rangefinder. Manual measurements were carried for the smallest rooms for shortening the time of taking the rooms out of use. The measurement result obtained following the merging of the point clouds is presented in .
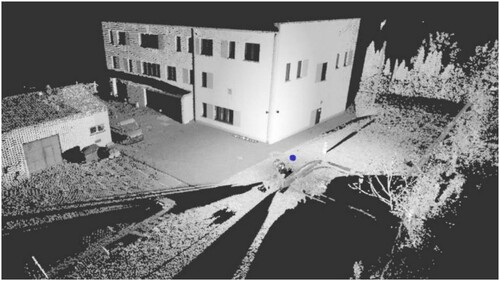
Figure 5. Point cloud for the entire site as viewed in Autodesk ReCap Pro.
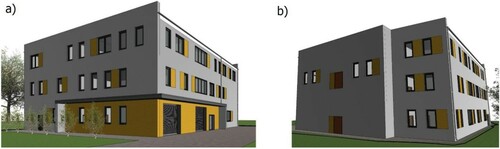
The final 3D model of the building, as obtained by merging scan data and additional manual measurements and modelled in Autodesk Revit software, is presented in .
Figure 6. The final model as viewed in Autodesk Revit: (a) north and west elevation, (b) south and east elevation.
In conformity with the earlier described procedure, control measurements were performed using a precise geodetic total station. The field sketch of the measured control points is presented in and .
Figure 7. Field sketch of the measured control points outside the building.
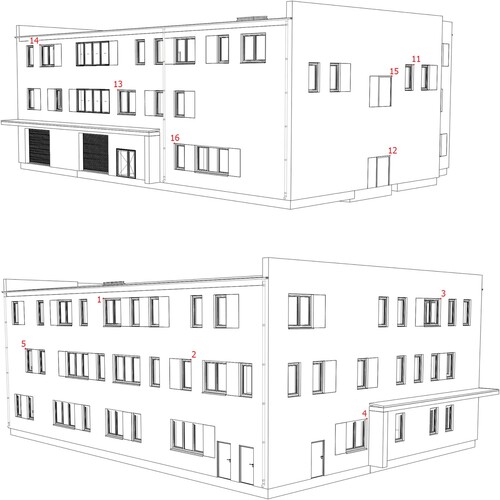
Figure 8. Field sketch of the measured control points inside the building.
presents the results of control measurements for Object A as a comparison between the total station measurements and the measurement data obtained from the building model.
Table 1. Control measurement results for Object A.
The difference between the total station measurements D and the measurements obtained from the 3D model d was calculated for the selected sections. The absolute minimum difference between the D and d measurements for Object A amounted to 0.000 m, whereas the maximum absolute difference amounted to 0.013 m.
Object B
For Object B, both the outdoor and indoor measurements were performed using Faro Focus 3D scanner, except for the two smallest rooms, for which the handheld laser rangefinder was used. presents the arrangement of the laser scanner site outside and inside Object B.
Figure 9. Arrangement of the scanner sites for Object B.
The measurement result obtained following the merging of the point clouds is presented in . Spheres visible in show the position of the scanner's head at the individual sites. The final 3D model of object B, as modelled in the Autodesk Revit software, is presented in .
Figure 10. Merged point cloud as viewed in ReCap Pro (a) for the performed scanning; (b) cut to the inventoried object.
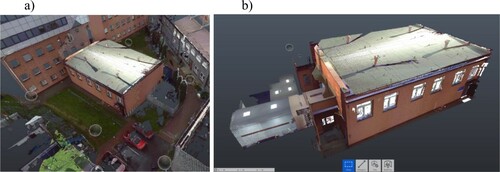
Figure 11. Complete model of Object B as viewed in Autodesk Revit.
For Object B, control measurements were also performed using a precise geodetic total station. The field sketch of the control points measured outside and inside the building is presented in .
Figure 12. Field sketch of measured control points: (a) outside the building; (b) inside the building.
presents the results of control measurements for Object B as a comparison between the total station measurements and the measurements obtained from the building model.
Table 2. Control measurement results for Object B
The investigation results are once again the difference between the total station measurements D and the measurements obtained from the 3D model d was calculated for the selected sections. The absolute minimum difference between the D and d measurements amounted to 0.000 m, whereas the maximum absolute difference amounted to 0.009 m.
Object C
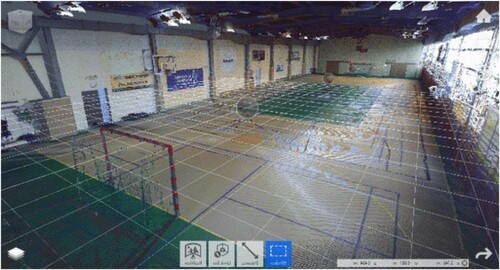
For Object C, the measurements were performed using a terrestrial scanner and, to facilitate the modelling of the roof of the building, the DJI Phantom 4 Advanced UAV. The UAV flight and the elaboration of results were completed automatically in DroneDeploy software. To ensure high resolution, the flight took place at a height of 20 m (ground sample distance = 1 cm). Image processing was completed on external servers, and the final result in the form of a point cloud was downloaded following the automatic calculations. The point cloud representing the roof of the building was combined with the point clouds created in ReCap by indicating the identified common points. The point cloud obtained from the UAV measurement is presented in , whereas the point cloud acquired from scanning the indoor sports hall is shown in .
Figure 13. Point cloud obtained from a UAV flight.
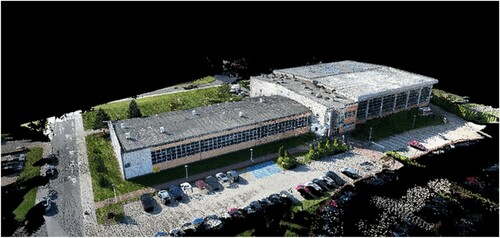
Figure 14. Point cloud obtained from indoor laser scanning.
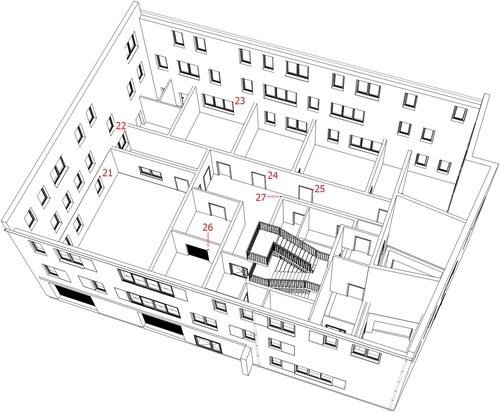
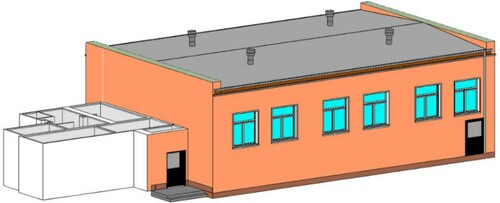
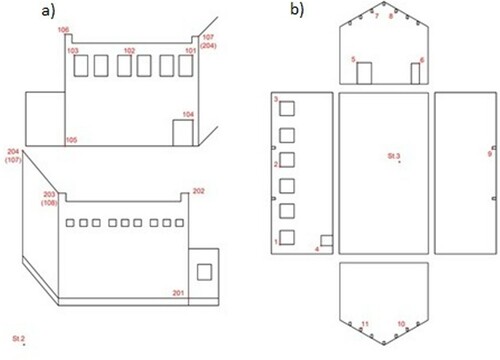
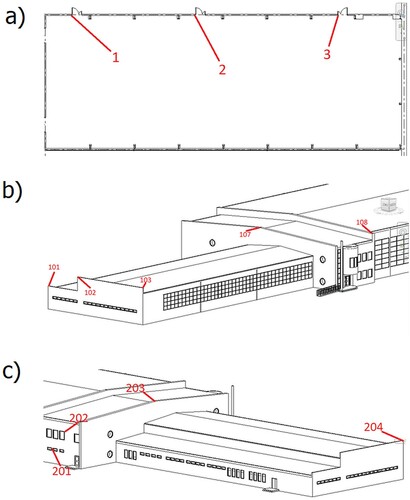
The UAV point cloud merging with the TLS point cloud determined common characteristic points in both clouds. The 3D model of Object C produced in Autodesk Revit is presented in . The field sketch of the control points measured inside and outside the building is presented in .
Figure 15. Three-dimensional model: (a) north and west elevation, (b) south and east elevation.
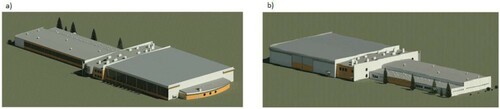
Figure 16. Field sketch of control points measured: (a) inside the building; (b,c) outside the building.
presents the results of control measurements for Object C as a comparison between the total station measurements and the measurement data obtained from the building model.
Table 3. Control measurement results for Object C
The investigation results show that the difference between the total station measurements D and the measurements obtained from the 3D model d was calculated for the selected sections. The absolute minimum difference between the D and d measurements amounted to 0.004 m, whereas the maximum absolute difference amounted to 0.012 m.
Discussion of the results
Distances D, calculated from the coordinates of the control points measured using the total station, were compared with the corresponding distances d obtained from the model produced in Autodesk Revit to determine measurement differences ().
Table 4. The results of the reference value comparison for the examined objects.
In the first stage of the analyses concerning the measurement uncertainty, the normal distribution was assumed; in conformity with the adopted assumptions and performed calculations, the expected value from the entire population should amount to 0.0, whereas the standard deviation should amount to ±6.8 mm. For the sample size 60, considered in the present investigation, the mean value amounted to −1.6 mm, whereas the standard deviation amounted to ±6.5 mm.
Since the calculated value for the employed F-test (Fcalc = 0.914) is lower than the acceptable F statistic for statistical significance 0.05 and 59 degrees of freedom (F0.05=1.540), there is no basis for rejecting the hypothesis of equality of standard deviation obtained based on the sample of size 60 and the theoretical value, which confirms the correctness of the adopted assumptions. We have no grounds to reject the hypothesis of the standard deviation equality, which confirms the correctness of the assumptions made. It can, therefore, be assumed that the average accuracy of a 3D BIM measurement for inventory purposes will amount to ±6.8 mm.
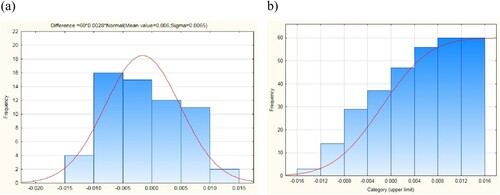
Differences in the results can be caused by inaccuracies arising when modelling an object from a point cloud. Since the mean value is different from the default value of 0 mm, the value of the skewness coefficient was determined. The obtained skewness is positive and amounts to 0.42, which indicates that the values for elements of the structure or elements introduced into the structure (walls, pillars, partitions, beams, ceilings, door and window openings etc.) are overstated concerning essential elements measured using the total station (). As for other positional parameters, the median was determined at −2 mm, and the mode was determined at −2 mm.
Figure 17. Histogram, adjusted density function of the normal distribution (a), and empirical and theoretical distribution (b). Source: Own elaboration with the use of Statistica software.
The next stage of the analyses consisted of checking whether the obtained values of the differences between the data from the Revit model and the reference measurement (the total station measurement) have a normal distribution. To this end, probability plots (quantile–quantile plots) were generated ().
Figure 18. Normal plots: (a) probability plot and (b) quantile–quantile plot. Source: Own elaboration with the use of Statistica software.
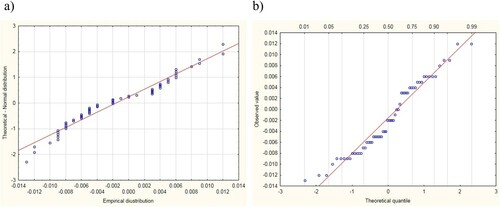
The received values do not lie in the proximity of the straight line obtained based on the arrangement of point distributions on the probability plot and the quantile–quantile plot. The points are not evenly distributed along the straight line. One can also notice deviations in the middle, on the top and the bottom of the plots. To ensure the normal distribution of the analysed data (), the χ2 statistical test and the Kolmogorov–Smirnov, Lilliefors and Shapiro–Wilk tests were performed (). Sturges’ formula was used to determine the number of class intervals to adjust the normal distribution function to the empirical distribution function and create a histogram:
(17)
(17) where k is the number of class intervals,
, n the sample size n=50.
Table 5. Probability values for testing normal distribution hypotheses
All of the received probability values are higher than 0.05, which is a limit value in the performed statistical tests; therefore, the obtained differences can be considered normal distribution samples (according to software Statistica). According to the performed analyses to testing hypotheses regarding the normality of distribution, the analysed data can be described by normal distribution. The χ2 test results are influenced by final small-size class intervals (histogram). Finally, standard measures of accuracy evaluation were adopted for the analysis: mean error (μ), root mean square error (RMSE) and standard deviation (σ). The obtained values are presented in .
Table 6. Measures of accuracy estimation
As noted, the accuracy of dimensional identification of the existing object and its digital model, created following the inventory using a laser scanner, can be better than ±1 cm. Under favourable conditions, following the instruction and the capabilities of the measuring equipment, accuracy may amount up to ±0.5 mm.
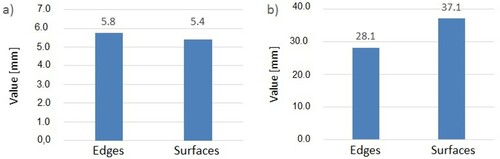
Depending on the type of works and the type of building, creating a 3D model of the entire object is not always necessary for construction purposes. Some examples include emergency works, partial modernization works or small renovations, which may not require complete technical documentation (). The measurements performed based on individual scans are more accurate than merged scans (). A minor error is noted with measurements for individual scans (standard deviation at a level of ±5.8 mm for edges and ±5.4 mm for surfaces).
Figure 19. Standard deviation for (a) individual scans; (b) merged scans.
At this stage of the investigation and the analysis, it can be stated that the created digital models meet recommended requirements for dimensional tolerances of structure elements for buildings constructed in Poland. According to these recommendations, the x, y, z the actual location tolerances of an element to the normal plot and the dimensions between two axes are determined by the formula 0.05 (d is the distance or size (cm) of the elements being compared or measured), and thus amount to 0.5 cm/m and are no higher than 2 cm/m.
The total station measurements and readings from the Revit model were carried out or the examined buildings, divided into exterior and interior measurements. In the case of object A, the measured distances ranged from 6.847 to 30.258 m, for object B from 8.697 to 23.343 m and for object C from 5.200 to 66.854 m. Differences and absolute values of the differences were calculated per 1 m of measuring length. Analysing the received results shows that for Object A and outdoor laser-scan measurements, the mean accuracy amounted to 0.059 cm; after rejecting the differences deviating significantly from the average value, the mean accuracy amounted to 0.048 cm. For Object B, the mean difference amounted to 0.029 cm for outdoor measurements and 0.027 cm for indoor measurements. In contrast, for Object C, the mean difference amounted to 0.038 cm for outdoor measurements and 0.030 cm for indoor measurements. The results are comparable, and accuracy is similar for indoor and outdoor measurements, regardless of the measurement method. The received results are much lower than the value mentioned above of 0.5 cm/m. The investigation has proved that the results of the laser-scan measurements may significantly enhance basic inventory, control and diagnostic activities performed for buildings of both complex and straightforward structure and surface area.
Among the limitations of the Scan-to-BIM technology, one may name external factors that impact the scanner’s performance and the measurement process. These include (Faltýnová et al., Citation2016; Valença et al., Citation2017): temperature (optimal temperature ranges from 0 to 30°C), humidity, unstable ground and intense lightning, which may cause measurement inaccuracies. Performed measurements may also be influenced by the reflectance of the scanned object. Furthermore, one should take into consideration the human factor, since it is the survey team that will be responsible for adopting correct assumptions, e.g. establishing the geodetic control network, the number and situation of measurement stands and appropriate choice of software tools for the best final result.
It is worth mentioning that case studies using standards and guidelines dedicated to applying laser scanning in construction, to the Scan-to-BIM approach for existing buildings, in practice can be found in the literature. Nevertheless, in some countries, contractors also apply internal procedures to control and ensure quality in the entire process, from acquiring data, through data processing, to creating a building model (Janicka et al., Citation2020). The recipients’ requirements and expectations play a crucial role here, as the accuracy criteria and the scope of the investigation are usually adjusted to the recipients’ needs. This situation is characteristic of Poland and other countries with no universal guidelines for employing laser scanning in construction (Smaczyński & Horbiński, Citation2021). In the United States, on the initiative of specific recipients, documents were developed containing guidelines and recommendations for MLS measurements. The first document of that type was a chapter of the California Department of Transportation (Caltrans). Entitled ‘Terrestrial Laser Scanning Specifications’, it was published in January 2011. Based on the chapter, the Florida Department of Transportation (FDOT) released a document entitled ‘Terrestrial Mobile LiDAR Surveying & Mapping Guidelines’. Other documents, varying in terms of particular guidelines and their scope, were published, i.e. by the Texas Department of Transportation, the Missouri Department of Transportation and the American Society of Photogrammetry and Remote Sensing (ASPRS) (Mikrut & Głowienka, Citation2015; Olsen et al., Citation2013). In Poland, the requirements relating to the development and use of BIM models only concern public contracts, and take the form of optional guidelines. In 2020, the Polish BIM standard, ‘BIM Standard PL, Citation2020’, was published on the website of the Public Procurement Office. For laser scanning, there remain no specific requirements, with the only limitation being competence, whereas for UAV photogrammetry, authorization and permission are required.
Such a 3D model may enrich the environmental performance of buildings in life cycle assessment, where technological factors of a building and combined with external and internal drivers influence carbon emissions (Galiano-Garrigós et al., Citation2019; Grygierek et al., Citation2020). Such an approach was challenging for decades due to the problem of data integration. However, with the development of big data and machine learning (Kaczmarek et al., Citation2020), the use of detailed data about every single building is becoming possible enhanced by BIM or GEOBIM (integration of geospatial environment with BIM) and additional variables (Luttun & Krijnen, Citation2020; Noardo et al., Citation2019). Examples of good practices and the use of data by GEOBIM may be three-dimensional modelling of cities for urbanistic and architectural design, analysis of microclimate in cities, taking into account individual buildings, scheduling of construction works or property management (Gil et al., Citation2010; Jusuf et al., Citation2017; Rua et al., Citation2013; Souza & Bueno, Citation2022). Standard Open BIM should be mentioned here – an approach supporting a transparent and open flow of information ensuring interoperability between various software used in analyses in various industries and disciplines. Thanks to the Open BIM standards, it is possible to exchange models (e.g. the IFC standard), comments or remarks assigned to specific elements of the model (e.g. BCF format) and standardize information about resources provided as part of a construction project (e.g. the COBie standard in the form of a spreadsheet). As highlighted by Olsson and Wang, integrating BIM data with GIS spatial data facilitates data transfer between the systems, allows for multi-level integration of spatial information and makes design and builing management more efficient, rational and standardized (Olsson et al., Citation2018; Wang et al., Citation2019). Such an approach stands in line with Bieda et al. (Citation2020), who see 3D technologies as a future direction of information development in holistic urban structure systems.
Conclusions
An adequate approach towards automation and optimization of data collection and integration into the model's environment frequently determines the quality and accuracy of the analyses. BIM models are developed for different purposes, depending on the character of a particular project – from the most default category of newly designed capacity objects, through the adjacent existing buildings (modelling for context, analysis, reconstruction, regeneration or modernization), to models created for the management of facilities in operation.
The measurement accuracy analyses performed in the present paper have proved the usefulness of BIM models developed via laser scanning. The most evident benefit for the construction industry is the possibility to obtain accurate measurements and visual data in a more efficient way than with the use of conventional methods. The use of scanners reduces time and costs of data collection. Other significant advantages include high-quality 3D documentation and remote access to photos and images. Surveying difficult and inaccessible areas via laser scanning proves to be safer, since direct human participation is not required. The obtained BIM models are useful for managing the construction process (bill of quantities, cost estimation, variation and adjustment analysis), particularly modernization and renovation of existing buildings. More importantly, such documentation can be updated and enhanced for the purpose of planned assessments and periodical inspections within the entire life cycle of a building.
By summarizing the research results, the following conclusions can be drawn:
The measurement accuracy analyses, performed for the selected buildings, proved that the results of laser scanner measurements can significantly enhance basic inventory and diagnostic surveys for buildings and structures.
The obtained results showed that, with the employment of particular measurement technologies, the measurement accuracy for existing buildings and their digital models is higher than ±1 cm. It is also worth noting that the basic condition for accuracy should be the RMSE value, which should not exceed project requirements. Following EN 1990 (EN 1990: 2002 / A1: 2005 / AC: 2010 Eurocode, Citation2010) – Basis of structural design), the value should remain at a 95% CI level.
Following the performed analyses, it can be stated that the created digital models of the selected buildings meet the recommended requirements for structures constructed in Poland. According to these recommendations, the x, y, z tolerances of an element’s actual situation in relation to the normal plot, and the dimensions between two axes are determined by the formula 0.05
(d is the distance or size (cm) of the elements being compared or measured), and thus amount to 0.5 cm/m and are no higher than 2 cm/m.
The absence of standards and guidelines relating to the application of TLS technology in the Scan-to-BIM process has been noted. The accuracy criteria and the scope of research are generally defined by the customer.
The measurements performed and discussed herein can be used for further analysis and comparison of measurements conducted via different methods. This will allow to assess the usefulness of tools employed in the Scan-to-BIM process.
The process of scanning and developing a 3D model is relatively simpler, safer and more efficient in comparison with conventional method (particularly for difficult and inaccessible areas).
Employing the Scan-to-BIM process in construction for the existing construction assets has numerous advantages. However, it is not without disadvantages. Particular attention needs to be paid to external factors that can negatively impact the scanning process, and the human factor (measurement assumptions, data processing, control and interpretation of results).
Author contributions
All authors had an equal contribution to the creation of this article.
Disclosure statement
No potential conflict of interest was reported by the author(s).
References
- Achakir, F., Fkihi, S. E., & Mouaddib, E. M. (2021). Non-model-based approach for complete digitization by TLS or mobile scanner. ISPRS Journal of Photogrammetry and Remote Sensing, 178, 314–327. https://doi.org/10.1016/j.isprsjprs.2021.06.014
- Al-Anzi, N. M. (2009). Workplace environment and its impact on employee performance [MBA thesis, submitted to Open University of Malaysia for the Degree of Master of Business Administration]. Open University of Malaysia.
- Anderson, K., & Gaston, K. J. (2013). Lightweight unmanned aerial vehicles will revolutionise spatial ecology. Frontiers in Ecology and the Environment, 11(3), 138–146. https://doi.org/10.1890/120150
- Angulo-Fornos, R., & Castellano-Román, M. (2020). HBIM as support of preventive conservation actions in heritage architecture. Experience of the renaissance quadrant facade of the cathedral of Seville. Applied Sciences, 10(7), 2428. https://doi.org/10.3390/app10072428
- Antón, D., Medjdoub, B., Shrahily, R., & Moyano, J. (2018). Accuracy evaluation of the semi-automatic 3D modeling for historical building information models. International Journal of Architectural Heritage, 12(5), 790–805. https://doi.org/10.1080/15583058.2017.1415391
- Baik, A., Almaimani, A., Al-Amodi, M., & Rahaman, K. R. (2021). Applying digital methods for documenting heritage building in Old Jeddah: A case study of hazzazi house. Digital Applications in Archaeology and Cultural Heritage, 21, e00189. https://doi.org/10.1016/j.daach.2021.e00189
- Bartoli, G., Betti, M., Bonora, V., Conti, A., Fiorini, L., Kovacevic, V. C., Tesi, V., & Tucci, G. (2020). From TLS data to FE model: A workflow for studying the dynamic behavior of the Pulpit by Giovanni Pisano in Pistoia (Italy). Procedia Structural Integrity, 29, 55–62. https://doi.org/10.1016/j.prostr.2020.11.139
- Beshr, A. A. A., & Elnaga, I. M. A. (2011). Investigating the accuracy of digital levels and reflectorless total stations for purposes of geodetic engineering. Alexandria Engineering Journal, 50(4), 399–405. https://doi.org/10.1016/j.aej.2011.12.004
- Bieda, A., Bydłosz, J., Warchoł, A., & Balawejder, M. (2020). Historical underground structures as 3D cadastral objects. Remote Sensing, 12(10), 1547. https://doi.org/10.3390/rs12101547
- BIM PL standard. (2020). Polish association of construction employers (in Polish). https://www.uzp.gov.pl/__data/assets/pdf_file/0024/43449/BIM-Standard-wersja-opublikowana-2.0.pdf
- Biolek, V., Hanak, T., & Hanak, M. (2019). Proposed interconnecting database for BIM models and construction-economic systems in the Czech Republic. IOP Conference Series: Materials Science and Engineering, 471(11), 112079. https://doi.org/10.1088/1757-899x/471/11/112079
- Bochenska, A., Markiewicz, J., & Łapiński, S. (2019). The combination of the image and range-based 3d acquisition in archaeological and architectural research in the royal castle in Warsaw. The International Archives of the Photogrammetry, Remote Sensing and Spatial Information Sciences, XLII-2/W15, 177–184. https://doi.org/10.5194/isprs-archives-XLII-2-W15-177-2019
- Brumana, R., Oreni, D., Barazzetti, L., Cuca, B., Previtali, M. & Banfi, F. (2020). Survey and Scan to BIM Model for the Knowledge of Built Heritage and the Management of Conservation Activities. In: Daniotti, B., Gianinetto, M., Della Torre, S. (Eds.), Digital transformation of the design, construction and management processes of the built environment. research for development (pp. 391–400). Springer. https://doi.org/10.1007/978-3-030-33570-0_35
- Bruno, N., & Roncella, R. (2019). HBIM for conservation: A new proposal for information modeling. Remote Sensing, 11(15), 1751. https://doi.org/10.3390/rs11151751
- Burdziakowski, P. (2017). Evaluation of open drone map toolkit for geodetic grade aerial drone mapping – case study. 17th International Multidisciplinary Scientific GeoConference SGEM Photogrammetry and Remote Sensing, 23, 101–109. https://doi.org/10.5593/sgem2017/23/s10.013
- Cacciari, P. P., & Futai, M. M. (2017). Modeling a shallow rock tunnel using terrestrial laser scanning and discrete fracture networks. Rock Mechanics and Rock Engineering, 50(5), 1217–1242. https://doi.org/10.1007/s00603-017-1166-6
- Carvalho, J. P., Bragança, L., & Mateus, R. (2021). Sustainable building design: Analysing the feasibility of BIM platforms to support practical building sustainability assessmen. Computers in Industry, 127, 103400. https://doi.org/10.1016/j.compind.2021.103400
- Casazza, M., Lega, M., Jannelli, E., Minutillo, M., Jaffe, D., Severino, V., & Ulgiati, S. (2019). 3D monitoring and modelling of air quality for sustainable urban port planning: Review and perspectives. Journal of Cleaner Production, 231, 1342–1352. https://doi.org/10.1016/j.jclepro.2019.05.257
- Chacón, R., Puig-Polo, C., & Real, E. (2021). TLS measurements of initial imperfections of steel frames for structural analysis within BIM-enabled platforms. Automation in Construction, 125, 103618. https://doi.org/10.1016/j.autcon.2021.103618
- Chow, J. C. K., Lichti, D. D., & Teskey, W. F. (2012). Accuracy assessment of the Faro Focus3D and leica HDS6100 panoramic-type terrestrial laser scanners through point-based and plane-based user self-calibration. FIG Working Week.
- Davidson, J., Fowler, J., Pantazis, C., Sannino, M., Walker, J., Sheikhkhoshkar, M., & Rahimian, F. P. (2020). Integration of VR with BIM to facilitate real-time creation of bill of quantities during the design phase: A proof of concept study. Frontiers of Engineering Management, 7(3), 396–403. https://doi.org/10.1007/s42524-019-0039-y
- Dąbek, P. B., Żmuda, R., Szczepański, J., & Ćmielewski, B. (2018). Evaluation of water soil erosion processes in forest areas in the western sudetes using terrestrial laser scanning and GIS tools. E3S Web Conf. 10th Conference on Interdisciplinary Problems in Environmental Protection and Engineering EKO-DOK, 44, 00026. https://doi.org/10.1051/e3sconf/20184400026
- Depecke, P., Menezo, C., Virgone, J., & Lepers, S. (2001). Design of buildings shape and energetic consumption. Building and Environment, 36(5), 627–635. https://doi.org/10.1016/S0360-1323(00)00044-5
- Duffy, J. P., Pratt, L., Anderson, K., Land, P. E., & Shutler, J. D. (2018). Spatial assessment of intertidal seagrass meadows using optical imaging systems and a lightweight drone. Estuarine, Coastal and Shelf Science, 200, 169–180. https://doi.org/10.1016/j.ecss.2017.11.001
- EN 1990:2002/A1:2005/AC:2010 Eurocode. (2010). Basis of structural design. European Committee for Standardization.
- Erdélyi, J., Kopáčik, A., & Kyrinovič, P. (2018). Construction control and documentation of facade elements using terrestrial laser scanning. Applied Geomatics, 10(2), 113–121. https://doi.org/10.1007/s12518-018-0208-4
- Faltýnová, M., Matoušková, E., Šedina, J., & Pavelka, K. (2016). Building facade documentation using laser scanning and photogrammetry and data implementation into BIM. The International Archives of the Photogrammetry, Remote Sensing and Spatial Information Sciences, XLI-B3, 215–220. https://doi.org/10.5194/isprs-archives-XLI-B3-215-2016
- Feng, J., Luo, X., Gao, M., Abbas, A., Xu, Y. P., & Pouramini, S. (2021). Minimisation of energy consumption by building shape optimisation using an improved manta-Ray foraging optimization algorithm. Energy Reports, 7, 1068–1078. https://doi.org/10.1016/j.egyr.2021.02.028
- Galiano-Garrigós, A., García-Figueroa, A., Rizo-Maestre, C., & González-Avilés, Á. (2019). Evaluation of BIM energy performance and CO2 emissions assessment tools: A case study in warm weather. Building Research & Information, 47(7), 787–812. https://doi.org/10.1080/09613218.2019.1620093
- Gil, J., Beirão, J., Moutenegro, N., & Dunantie, J. (2010, September 15–18). Assessing computational tools for urban design: Towards a “city information model”. Future cities, 28th eCAADe conference (pp. 316–324).
- Godek, K., & Krupiński, W. (2012). Proposal for a comprehensive study of electronic total station. Infrastructure and Ecology of Rural Areas, 2/II/2012, 219–232.
- Grygierek, K., Ferdyn-Grygierek, J., Gumińska, A., Baran, Ł, Barwa, M., Czerw, K., Gowik, P., Makselan, K., Potyka, K., & Psikuta, A. (2020). Energy and environmental analysis of single-family houses located in Poland. Energies, 13(11), 2740. https://doi.org/10.3390/en13112740
- Hamma-adama, M., & Kouider, T. (2019). Comparative analysis of BIM adoption efforts by developed countries as precedent for new adopter countries. Current Journal of Applied Science and Technology, 36(2), 1–15. https://doi.org/10.9734/cjast/2019/v36i230224
- Helman, D., Bahat, I., Netzer, Y., Ben-Gal, A., Alchanatis, V., Peeters, A., & Cohen, Y. (2018). Using time series of high-resolution planet satellite images to monitor grapevine stem water potential in commercial vineyards. Remote Sensing, 10(10), 1615. https://doi.org/10.3390/rs10101615
- Hlotov, V. M., & Kh, M. (2019). Accuracy investigation of point clouds with Faro Focus 3d S120 terrestrial laser scanner. Republican Interdepartmental Scientific and Technical Collection. Geodesy, Cartography, and Aerial Photography, 90(90), 41–49. https://doi.org/10.23939/istcgcap2019.90.041
- Huang, J., Tang, Z., Liu, D., & He, J. (2020). Ecological response to urban development in a changing socio-economic and climate context: Policy implications for balancing regional development and habitat conservation. Land Use Policy, 97, 104772. https://doi.org/10.1016/j.landusepol.2020.104772
- Iqbal, Q. M. Z., & Chan, A. L. S. (2016). Pedestrian level wind environment assessment around group of high-rise cross-shaped buildings: Effect of building shape, separation and orientation. Building and Environment, 101, 45–63. https://doi.org/10.1016/j.buildenv.2016.02.015
- Janicka, J., Rapiński, J., Błaszczak-Bąk, W., & Suchocki, C. (2020). Application of the Msplit estimation method in the detection and dimensioning of the displacement of adjacent planes. Remote Sensing, 12(19), 3203. https://doi.org/10.3390/rs12193203
- Jusuf, S. K., Mousseau, B., Godfroid, G., & Hui, V. S. J. (2017). Integrated modeling of CityGML and IFC for city/neighborhood development for urban microclimates analysis. Energy Procedia, 122, 145–150. https://doi.org/10.1016/j.egypro.2017.07.329
- Juszczyk, M., Zima, K., & Lelek, W. (2019). Forecasting of sports fields construction costs aided by ensembles of neural networks. Journal of Civil Engineering and Management, 25(7), 715–729. https://doi.org/10.3846/jcem.2019.10534
- Kaczmarek, I., Iwaniak, A., Świetlicka, A., Piwowarczyk, M., & Harvey, F. (2020). Spatial planning text information processing with use of machine learning methods. ISPRS Annals of the Photogrammetry, Remote Sensing and Spatial Information Sciences, VI-4/W2-2020, 95–102. https://doi.org/10.5194/isprs-annals-VI-4-W2-2020-95-2020
- Khan, M. A., Ectors, W., Bellemans, T., Janssens, D., & Wets, G. (2018). Unmanned aerial vehicle-based traffic analysis: A case study for shockwave identification and flow parameters estimation at signalized intersections. Remote Sensing, 10(3), 458. https://doi.org/10.3390/rs10030458
- Kim, D., Kwon, S., Cho, C. S., de Soto, B. G., & Moon, D. (2020). Automatic space analysis using laser scanning and a 3D grid: Applications to industrial plant facilities. Sustainability, 12(21), 9087. https://doi.org/10.3390/su12219087
- Klapa, B., Mitka, B., & Zygmunt, M. (2017). Application of integrated photogrammetric and terrestrial laser scanning data to cultural heritage surveying. IOP Conference Series: Earth and Environmental Science, 95, 032007. https://doi.org/10.1088/1755-1315/95/3/032007
- Konior, J., & Szóstak, M. (2020). Methodology of planning the course of the cumulative cost curve in construction projects. Sustainability, 12(6), 2347. https://doi.org/10.3390/su12062347
- Korumaz, M., Betti, M., Conti, A., Tucci, G., Bartoli, G., Bonora, V., Korumaz, A. G., & Fiorini, L. (2017). An integrated terrestrial laser scanner (TLS), deviation analysis (DA) and finite element (FE) approach for health assessment of historical structures. A minaret case study. Engineering Structures, 153, 224–238. https://doi.org/10.1016/j.engstruct.2017.10.026
- Ku, H. H. (1966). Notes on the use of propagation of error formulas. Journal of Research of the National Bureau of Standards, 70C(4), 262.
- Leśniak, A., Górka, M., & Skrzypczak, I. (2021). Barriers to BIM implementation in architecture, construction, and engineering projects—the Polish study. Energies, 14(8), 2090. https://doi.org/10.3390/en14082090
- Li, J., Yang, B., Cong, Y., Cao, L., Fu, X., & Dong, Z. (2019). 3D forest mapping using a low-cost UAV laser scanning system: Investigation and comparison. Remote Sensing, 11(6), 717. https://doi.org/10.3390/rs11060717
- Liu, Z., Lu, Y., Shen, M., & Peh, L. C. (2021). Transition from building information modeling (BIM) to integrated digital delivery (IDD) in sustainable building management: A knowledge discovery approach based review. Journal of Cleaner Production, 291, 125223. https://doi.org/10.1016/j.jclepro.2020.125223
- López F., d. A., Ordóñez, C., Roca-Pardiñas, J., & García-Cortés, S. (2014). Point cloud comparison under uncertainty. Application to beam bridge measurement with terrestrial laser scanning. Measurement, 51, 259–264. https://doi.org/10.1016/j.measurement.2014.02.013
- Lõhmus, H., Ellmann, A., Märdla, S., & Idnurm, S. (2018). Terrestrial laser scanning for the monitoring of bridge load tests – two case studies. Survey Review, 50(360), 270–284. https://doi.org/10.1080/00396265.2016.1266117
- Luttun, J., & Krijnen, T. (2020, August 18–20). An approach for data extraction, validation and correction using geometrical algorithms and model view definitions on building models. International Conference on Computing in Civil and Building Engineering ICCCBE 2020: Proceedings of the 18th International Conference on Computing in Civil and Building Engineering (pp. 529–543). https://doi.org/10.1007/978-3-030-51295-8_38
- Maalek, R., Lichti, D. D., & Ruwanpura, J. Y. (2018). Robust segmentation of planar and linear features of terrestrial laser scanner point clouds acquired from construction sites. Sensors, 18(3), 819. https://doi.org/10.3390/s18030819
- Maalek, R., & Sadeghpour, F. (2013). Accuracy assessment of ultra-wide band technology in tracking static resources in indoor construction scenarios. Automation in Construction, 30, 170–183. https://doi.org/10.1016/j.autcon.2012.10.005
- Mielby, S., & Sandersen, P. B. E. (2017). Development of a 3D geological/hydrogeological model targeted at sustainable management of the urban water cycle in Odense City, Denmark. Procedia Engineering, 209, 75–82. https://doi.org/10.1016/j.proeng.2017.11.132
- Mikrut, S., & Głowienka, E. (2015). Fotogrametria i skaning laserowy w modelowaniu 3D. Wyższa Szkoła Inżynieryjno-Ekonomiczna z siedzibą w Rzeszowie, Rzeszów.
- Mitka, B., Klapa, P., & Gniadek, J. (2019). Use of terrestrial laser scanning for measurements of wind power stations. Geomatics and Environmental Engineering, 13(1), 39–49. https://doi.org/10.7494/geom.2019.13.1.39
- Moon, D., Chung, S., Kwon, S., Seo, J., & Shin, J. (2019). Comparison and utilisation of point cloud generated from photogrammetry and laser scanning: 3D world model for smart heavy equipment planning. Automation in Construction, 98, 322–333. https://doi.org/10.1016/j.autcon.2018.07.020
- Moyano, J., Nieto-Julián, J. E., Lenin, L. M., & Bruno, S. (2021). Operability of point cloud data in an architectural heritage information model. International Journal of Architectural Heritage, https://doi.org/10.1080/15583058.2021.1900951
- Noardo, F., Ohori, K. A., Biljecki, F., Krijnen, T., Ellul, C., Harrie, L., & Stoter, J. (2019). GeoBIM benchmark 2019: Design and initial results. The International Archives of the Photogrammetry, Remote Sensing and Spatial Information Sciences, XLII-2/W13, 1339–1346. https://doi.org/10.5194/isprs-archives-XLII-2-W13-1339-2019
- Nowogońska, B. (2019). Diagnoses in the aging process of residential buildings constructed using traditional technology. Buildings, 9(5), 1269. https://doi.org/10.3390/buildings9050126
- Olsen, M. J., Chen, Z., Hutchinson, T., & Kuester, F. (2013). Optical techniques for multiscale damage assessment. Geomatics, Natural Hazards and Risk, 4(1), 49–70. https://doi.org/10.1080/19475705.2012.670668
- Olsson, P. O., Axelsson, J., Hooper, M., & Harrie, L. (2018). Automation of building permission by integration of BIM and geospatial data. ISPRS International Journal of Geo-Information, 7(8), 307. https://doi.org/10.3390/ijgi7080307
- Park, J. H., & Lee, G. (2017). Design coordination strategies in a 2D and BIM mixed-project environment: Social dynamics and productivity. Building Research & Information, 45(6), 631–648. https://doi.org/10.1080/09613218.2017.1288998
- Price, S. J., Terrington, R. L., Busby, J., Bricker, S., & Berry, T. (2018). 3D ground-use optimisation for sustainable urban development planning: A case-study from earls court, London, UK. Tunnelling and Underground Space Technology, 81, 144–164. https://doi.org/10.1016/j.tust.2018.06.025
- Qiu, Q., Zhou, X., Zhao, J., Yang, Y., Tian, S., Wang, J., Liu, J., & Liu, H. (2021). From sketch BIM to design BIM: An element identification approach using industry foundation classes and object recognition. Building and Environment, 188, 107423. https://doi.org/10.1016/j.buildenv.2020.107423
- Rebolj, D., Pučko, Z., Babič, NČ, Bizjak, M., & Mongus, D. (2017). Point cloud quality requirements for scan-vs-BIM based automated construction progress monitoring. Automation in Construction, 84, 323–334. https://doi.org/10.1016/j.autcon.2017.09.021
- Reinoso, J. F., Gonçalves, J. E., Pereira, C., & Bleninger, T. (2018). Cartography for civil engineering projects: Photogrammetry supported by unmanned aerial vehicles. Iranian Journal of Science and Technology, Transactions of Civil Engineering, 42(1), 91–96. https://doi.org/10.1007/s40996-017-0076-x
- Remondino, F. (2011). Heritage recording and 3D modeling with photogrammetry and 3D scanning. Remote Sensing, 3(6), 1104–1138. https://doi.org/10.3390/rs3061104
- Rocha, G., Mateus, L., Fernández, J., & Ferreira, V. (2020). A scan-to-BIM methodology applied to heritage buildings. Heritage, 3(1), 47–67. https://doi.org/10.3390/heritage3010004
- Rua, H., Falcao, A. P., & Roxo, A. F. (2013, September 18–20). Digital modelsproposal for the interactive representation of urban centres the downtown Lisbon city engine model. Computation and performance, Proceedings of the 31st eCAADe conferencex, 1 (pp. 265–273).
- Sánchez-Aparicio, L. J., Del Pozo, S., Ramos, L. F., Arce, A., & Fernandes, F. M. (2018). Heritage site preservation with combined radiometric and geometric analysis of TLS data. Automation in Construction, 85, 24–39. https://doi.org/10.1016/j.autcon.2017.09.023
- Sepasgozaara, S. M. E., Shirowzhanb, S., & Wang, C. (2017). A scanner technology acceptance model for construction projects. Procedia Engineering, 180, 1237–1246. https://doi.org/10.1016/j.proeng.2017.04.285
- Shih, N. J. (2002, September 23–25). An application of a 3D scanner in the representation of building construction site. International symposium on Automation and robotics in construction, 19th (ISARC), proceedings, Gaithersburg (pp. 337–342). National Institute of Standards and Technology.
- Smaczyński, M., & Horbiński, T. (2021). Creating 3D model of the existing historical topographic object based on low-level aerial imagery. KN – Journal of Cartography and Geographic Information, 71(1), 33–43. https://doi.org/10.1007/s42489-020-00061-0
- Souza, L., & Bueno, C. (2022). City information modelling as a support decision tool for planning and management of cities: A systematic literature review and bibliometric analysis. Building and Environment, 207(A), 108403. https://doi.org/10.1016/j.buildenv.2021.108403
- Suchocki, C., & Katzer, J. (2018). Terrestrial laser scanning harnessed for moisture detection in building materials – problems and limitations. Automation in Construction, 94, 127–134. https://doi.org/10.1016/j.autcon.2018.06.010
- Sztubecka, M., & Sztubecki, J. (2016). Analysis of the acoustic climate of a spa park using the fuzzy set theory. Open Engineering, 6(1), 498–503. https://doi.org/10.1515/eng-2016-0068
- Török, Á, Bögöly, G., Somogyi, Á, & Lovas, T. (2020). Application of UAV in topographic modelling and structural geological mapping of quarries and their surroundings – delineation of fault-bordered raw material reserves. Sensors, 20(2), 489. https://doi.org/10.3390/s20020489
- Utica, G., Pinti, V., Guzzoni, L., Bonelli, S., & Brizzolari, A. (2017). Integrating laser scanner and BIM for conservation and reuse: ‘the lyric theatre of milan’. ISPRS Annals of the Photogrammetry, Remote Sensing and Spatial Information Sciences, IV-5/W1, 77–82. https://doi.org/10.5194/isprs-annals-IV-5-W1-77-2017
- Valença, J., Puente, I., Júlio, E. N. B. S., González-Jorge, H., & Arias-Sánchez, P. (2017). Assessment of cracks on concrete bridges using image processing supported by laser scanning survey. Construction and Building Materials, 146, 668–678. https://doi.org/10.1016/j.conbuildmat.2017.04.096
- van Eldik, M. A., Vahdatikhaki, F., dos Santos, J. M. O., Visser, M., & Doree, A. (2020). BIM-based environmental imapct assessment for infrastructure design projects. Automation in Construction, 120, 103379. https://doi.org/10.1016/j.autcon.2020.103379
- Vilutiene, T., Kalibatiene, D., Hosseini, M. R., Pellicer, E., & Zavadskas, E. K. (2019). Building information modeling (BIM) for structural engineering: A bibliometric analysis of the literature. Advances in Civil Engineering, 2019, 5290690. https://doi.org/10.1155/2019/5290690
- Volk, R., Stengel, J., & Schultmann, F. (2014). Building information modeling (BIM) for existing buildings—literature review and future needs. Automation in Construction, 38, 109–127. https://doi.org/10.1016/j.autcon.2013.10.023
- Wang, C., Wen, C., Dai, Y., Yu, S., & Liu, M. (2020). Urban 3D modeling with mobile laser scanning: A review. Virtual Reality & Intelligent Hardware, 2(3), 175–212. https://doi.org/10.1016/j.vrih.2020.05.003
- Wang, H., Pan, Y., & Luo, X. (2019). Integration of BIM and GIS in sustainable built environment: A review and bibliometric analysis. Automation in Construction, 103, 41–52. https://doi.org/10.1016/j.autcon.2019.03.005
- Wang, J., Qin, Q., & Bai, Z. (2018). Characterising the effects of opencast coal-mining and land reclamation on soil macropore distribution characteristics using 3D CT scanning. Catena, 171, 212–221. https://doi.org/10.1016/j.catena.2018.07.022
- Wang, M., Wang, C. C., Sepasgozar, S., & Zlatanova, S. (2020). A systematic review of digital technology adoption in off-site construction: Current status and future direction towards Industry 4.0. Buildings, 10(11), 204. https://doi.org/10.3390/buildings10110204
- Warchoł, A. (2015). Analysis of possibilities to registration TLS point clouds without targets on the example of the castle bridge in rzeszow. Proceedings of the 15th International Multidisciplinary Scientific GeoConference SGEM, 1, 737–742. https://doi.org/10.5593/SGEM2015/B11/S4.094
- Xu, H., Li, H., Yang, X., Qi, S., & Zhou, J. (2019). Integration of terrestrial laser scanning and nurbs modeling for the deformation monitoring of an earth-rock dam. Sensors, 19(1), 22. https://doi.org/10.3390/s19010022
- Xu, Z., & Coors, V. (2012). Combining system dynamics model, GIS and 3D visualization in sustainability assessment of urban residential development. Building and Environment, 47, 272–287. https://doi.org/10.1016/j.buildenv.2011.07.012
- Ye, C., Li, J., Jiang, H., Zhao, H., Ma, L., & Chapman, M. (2019). Semi-automated generation of road transition lines using mobile laser scanning data. IEEE Transactions on Intelligent Transportation Systems, 21(5), 1877–1890. https://doi.org/10.1109/TITS.2019.2904735
- Yin, X., Liu, H., Chen, Y., & Al-Hussein, M. (2019). Building information modelling for off-site construction: Review and future directions. Automation in Construction, 101, 72–91. https://doi.org/10.1016/j.autcon.2019.01.010
- Zheng, T., Li, B., Li, X. B., Wang, Z., Li, S. Y., & Peng, Z. R. (2021). Vertical and horizontal distributions of traffic-related pollutants beside an urban arterial road based on unmanned aerial vehicle observations. Building and Environment, 187, 107401. https://doi.org/10.1016/j.buildenv.2020.107401