
ABSTRACT
The UK government has committed to reducing its carbon emissions to net-zero by 2050. Higher education institutions (HEIs) are high energy users, with the largest proportion of their energy demand for space heating; an area still dominated by carbon-intensive fuels. This research addresses the UK HEI space temperature policy landscape, making direct links between space temperature policy and carbon management, advocating the development of evidence-based policies as a critical tool for reducing carbon emissions within the sector. Sixty-six space temperature policies were reviewed, and five experienced energy managers were interviewed to understand the range, development and use of space temperature policies in UK HEIs. The research identified a lack of consistency across these policies, leading to missed opportunities for making energy and carbon savings. The research highlights gaps in the available data and literature needed to connect policy to its effectiveness, and identifies the use of policy as a defensive tool against complaints rather than an active driver of energy reduction. A series of recommendations are proposed for national and institutional policymakers, suggesting areas for improvement and future research to facilitate effective development and practice in space temperature policy towards net-zero.
Introduction
This paper emerged from a desire to introduce an effective, evidence-based space temperature policy for a UK Higher Education Institution (HEI). Measuring the impact of policies on energy use is an under-researched area, and there is little work specifically on space temperature policies, or guidance on how to approach developing them. Despite Ward et al. highlighting the importance of integrating energy efficiency and wider sustainable development into policy and practice in 2008 (Ward et al., Citation2008), the continued lack of work in this area is worrying as the UK government has committed to reducing its carbon emissions to net-zero by 2050 (Gov.UK, June, Citation2019).
In this paper, the authors argue that a carefully devised space temperature policy has the potential to make a significant contribution to this reduction. In 2018 the UK service sector used over 20,000 ktoe (thousand tonnes of oil equivalent) of energy, excluding transport (Gov.UK, Citation2019). The education sector used 2314 ktoe, of which the most significant proportion (67%, 1548 ktoe) was used for heating and cooling (Gov.UK, Citation2019). The UK's (Citation2008) Climate Change Act committed the sector to reduce its carbon emissions by 34% by 2020 from the 1990 baseline (Gov.uk, Citation2008), and HEIs have an essential role in delivering carbon reductions within the sector (Wadud et al., Citation2019). As space heating is still largely dependent on fossil fuels, particularly natural gas (Gov.UK, Citation2019), reducing this end-use demand would positively impact carbon emissions reduction. In addition, rethinking the acceptable range of office temperatures may have other benefits for health and wellbeing (van Marken Lichtenbelt et al., Citation2017).
Buildings, energy use, temperature, and governance in UK HEIs
Space temperature and standards
Policy and standards have clear roles in establishing the bounds and parameters to be enforced by building management systems (BMS) and mechanical heating and cooling systems. UK office buildings indoor target temperatures are usually derived from national standards, including BS EN 12831 (Rhe/Citation24, Citation2017) and ASHRAE Citation55-Citation2020 (Citation2020). The Charted Institute of Building Service Engineers (CIBSE, Citation2015) guidance, typically used for the design of UK buildings, recommends indoor operative temperatures (combining air speed, air and mean radiant temperature) of 22–23°C for the living room of a dwelling, 19–21°C for educational teaching spaces, and 21–23°C for offices.
It should be noted that there are many factors aside from temperature which affect our thermal comfort in the spaces we occupy, the specifics of which are highly contested (Nicol & Parsons, Citation2002), but air temperature is the easiest to measure, and therefore most commonly used (Fanger, Citation1972). All of the reviewed space temperature policies focus solely on air temperature, therefore other thermal comfort factors such as radiant temperature, humidity and airspeed are not considered in this paper.
From a legal point of view, the Workplace (Health, Safety and Welfare) Regulations 1992 (Gov.UK, Citation1992) place an obligation on employers to provide a ‘reasonable’ temperature in the workplace, and the associated ‘Approved code of Practice’ (HSE, Citation2014) suggests the minimum temperature should usually be at least 16°C. Standards and guidance generally define target indoor air temperatures of around 21°C, however, no specific maximum or minimum is required. One reason for this lack of specificity is that any legal maximum or minimum temperatures would also apply to those working outdoors. Hence the obligation is on employers to individually assess the work environment and provide a ‘reasonable’ temperature.
Whilst there is no legal maximum working temperature in the UK, the Health and Safety Executive (HSE, Citation1992) recognize the potential adverse health aspects of working in uncomfortable temperatures. There is also a body of evidence on the effect of temperature on productivity and health, which is becoming more of a concern as climate change progresses (Hübler et al., Citation2008; Kjellstrom et al., Citation2016; van Marken Lichtenbelt et al., Citation2017). In January 2020, the Met Office reported that the last decade was the UK’s second hottest in the past 100 years, setting eight new high-temperature records (Met Office, Citation2020). Met Office predictions for the UK show an increased chance of warmer, wetter winters and hotter, drier summers so unless we can adapt our workspaces and practices, increases in external temperatures will result in higher indoor temperatures, and potential increases in energy demand for cooling (Met Office, Citation2021).
The policy landscape surrounding thermal comfort is also evolving. In 2014, Public Health England (PHE) revised its recommended minimum temperature levels in the home for good health from 21°C in living rooms to 18°C in all rooms, producing ‘minimal risk’ to the health of ‘a sedentary person wearing suitable clothing’ (Gov.UK, Citation2014). Jevons et al. (Citation2016) conducted a systematic search of peer-reviewed published literature on minimum indoor temperatures in the UK and countries with similar climates concluding ‘A threshold of 18°C was considered the evidence based and practical minimum temperature at which a home should be kept during winter in England’ (Jevons et al., Citation2016). Whilst these are recommendations for the home, it can be argued that there is no particular rationale for not applying this logic to the office. However, this policy evolution has not been mirrored in the workplace.
UK HEI building stock
Achieving the national recommendations and the perceived requirements of building occupants is particularly challenging within the HEI sector. Most HEIs have a mixture of building stock built at different times – over centuries in some cases. At one extreme, 20% of the buildings at the University of Oxford are listed – requiring special consentFootnote1 to make alterations (University of Oxford, Citation2021). Certified buildings, which require very little energy to heat, such as the University of Leicester's Centre for Medicine, and the Carnegie Village accommodation block at Leeds Metropolitan University (Passivhaus Trust), meet the Passivhaus standard, and represent the other extreme.
Energy consumption in UK HEIs
In 2008, Ward et al. reviewed UK HEI energy consumption, noting that whilst the sector as a whole was increasing its energy consumption, the increase was not equally spread across all institutions: research-intensive establishments were increasing their energy use, whilst smaller institutions were reducing theirs. The review looked for correlations with various factors, finding the highest correlation with the internal area, i.e. the space available inside buildings. This correlation could reasonably be assumed to be closely linked to the heating and cooling of that space. Perhaps more surprisingly, the age of the building correlated poorly with energy use, indicating that this has a limited impact overall. On the other hand, a strong correlation between the number of full-time research students and energy consumption was recorded, suggesting that research-intensive institutions may operate more energy-demanding equipment or practices (Ward et al., Citation2008). A later study by Wadud et al. (Citation2019) confirmed the correlations between internal area and research-intensity to energy consumption.
Goulden and Spence (Citation2015) highlight the role of the facilities manager as a key actor in managing energy consumption in organizations, due to the increasing reliance on BMS to remotely adjust a range of heating, lighting and ventilation systems. Along with energy managers, facilities managers are usually regarded as controlling estate thermal comfort. As Goulden and Spence (Citation2015) note, these can be ‘complex and conflicted’ roles, and there are often tensions between the needs of different stakeholders – see also Royston (Citation2016) and Clear et al. (Citation2017). Within UK HEIs, facilities managers take on various activities, including the cleaning, maintenance, performance, budgeting and management of the estates, including buildings and grounds. In contrast, an energy manager often focuses solely on monitoring and optimizing energy (and water) use within the organization. The two roles are closely linked and usually work together. Facilities managers select temperature ranges or target setpoint temperature for indoor spaces, within the wider context of ‘customer’ satisfaction, financial constraints and carbon targets, as directed by senior management (Mazhar et al., Citation2017).
Whilst this paper focuses on space temperature policies themselves, it should be noted that a range of other policies have an impact on space temperature in UK HEIs. These are referred to as ‘invisible energy policies’ and include areas such as the increased focus on improved student experience and the growth agenda (Royston, Citation2016; Royston et al., Citation2018).
Approach to carbon management in UK HEIs
As noted by Altan (Citation2010), there have been significant changes for HEIs over the last 30 years, including:
increases in both Undergraduate and Postgraduate numbers (and associated staff)
increased volume and complexity of research activities and a focus on subjects requiring energy-intensive lab equipment
diversification of academic activities with increased use of Information Technology (IT) and other energy-intensive activity
Carbon management is central to sustainable environmental management (O'Broin et al., Citation2015), and in 2010 the Higher Education Funding Council for England (HEFCEFootnote2) produced a carbon reduction strategy for English HEIs (HEFCE, Citation2010). Similar strategies were put in place in Northern Ireland, Scotland and Wales through the relevant devolved Governments and funding providers. From 2011, HEFCE linked capital allocations to carbon reduction by requiring HEIs to develop and implement Carbon Management Plans (HEFCE, Citation2010). However, the governance and drivers of carbon-saving initiatives in UK HEIs have changed in recent years. HEFCE closed in 2018, being replaced by the Office for Students,Footnote3 with its funding responsibilities taken on by the newly formed UK Research and Innovation (UKRI). This change also marked the end of regulated reporting on Carbon Management in England, removing the link between funding and Carbon Management Plans and severing the link between Government funding and carbon saving initiatives for these institutions.
Without financial incentives, motivating energy-saving actions can be significantly more difficult. Blake (Citation1999) notes that few people take environmental actions which involve changes to their lifestyle, using the example of transport, with many people accepting there are issues with congestion and emissions but are unwilling to stop driving. Similarly, policy is a critical institutional tool for carbon management, yet there is little research linking attitudes to thermal comfort and pro-environmental behaviour. Schellen et al. (Citation2010) note that most adults find a daily range in temperature of 8°C acceptable, opening up potential for using a wider range of temperatures to save energy. To date however, little connection is made between space temperature practices and environmental goals at work, unlike other areas of work-life (e.g. photocopying, leaving appliances on, and transport methods), despite the significant energy and carbon impacts of space heating (Whittle, Citation2015). Jackson (Citation2005) discusses the importance of evidence-based policy in motivating sustainable consumption (in our case, of energy relating to space temperature) whilst also recognizing that ‘policy development in the context of behavioural change is notoriously difficult’ (Jackson, Citation2005).
HESA publishes yearly environmental data for HEIs regarding their energy use and carbon emissions. There is however no published data on energy end-use, resulting in a limited understanding of the efficacy of initiatives or policies governing environmental factors such as space temperature. This is a crucial omission, given the importance of science-based targets and developing systems to effectively measure and evaluate the impact of different policies and interventions (Altan, Citation2010).
It is well established that we are seeing increasing global temperatures (Met Office, Citation2021) and the UK Government's Climate Change Risk Assessment 2017 Evidence Report identifies that warming UK temperatures could lead to an increased risk of overheating. It also calls for urgent action across a range of policy areas to address overheating in homes and public buildings (Gov.UK, Citation2017).
A time for change
Change in policy and practice regarding the use of space is clearly possible with sufficient motivation. The global pandemic caused by Covid-19 has had an extraordinary impact on our working practices and many other aspects of our daily lives, with a knock-on impact on our energy demands (Zhang et al., Citation2020). The impact of Covid-19 on both changes of energy consumption and energy policy has been identified as a future research hotspot (Zhang et al., Citation2021), and this paper connects those areas with the drive towards net zero.
As working practices settle into a ‘new normal’ with more flexible and hybrid home working arrangements increasingly being embraced in UK HEIs it is timely to reconsider the energy demands of space heating and cooling, and the role of policy in governing this to leverage these more dynamic and unpredictable office working patterns (Mantesi et al., Citation2022).
Methodology
The aim of the research was to examine space temperature policies across UK HEIs, looking for commonalities and differences in their published approaches in order to identify good practices. A systematic review was undertaken that included the most energy-intensive 115 HEIs (over two-thirds of all HEIs as listed on the HESA website). This corresponds to institutions with over 6000 student enrolments per year in 2017/2018. 53 smaller universities were excluded because their enrolments were lower than our threshold. At the time of the study, 2017/2018 was the most recent dataset available via HESA due to the time lag in HEI reporting, and HESA publishing. The review was carried out between June and August 2019, prior to the Covid-19 pandemic.
First, a Google web search was conducted with the name of the establishment and ‘heating policy’ then ‘temperature policy’ as search terms. If this failed to identify a space temperature policy, the ‘search’ facility on the university's webpage was used to search for any heating, temperature, environmental or energy policies. Details of each policy located were then recorded. Two researchers then checked a subset of each other’s findings (cross-checking six universities each, every ninth alphabetically) to verify the consistency in the approach.
Another web search was performed for a named contact (energy manager, environmental manager, sustainability manager) to request the target universities’ space temperature policy. Where a named contact was not available, it was followed up via generic enquiry email addresses. Additionally, ‘request for space temperature policy’ notices were placed on the Association of University Engineers online discussion forum, the Association of University Directors of EstatesFootnote4 online forum and the Environmental Association on Universities and CollegesFootnote5 online message board. The researchers contacted energy managers even if policies had already been sourced from the university website in case a more up to date version was available. This process resulted in 66 HEI space temperature policies from across UK HEIs for analysis: 58 responses were received directly from our requests, and the other eight were taken from websites with no reply from the HEIs.
To gain a more in-depth understanding of space temperature policies’ development, governance, and implementation, semi-structured expert interviews were conducted with five experienced energy managers (three audio calls, two in-person); all of whom were male. These individuals had responded to the request to be interviewed about their HEI’s policy. Interview topics focussed on four areas: the background of the HEI and manager, the governance of the policy, how it is communicated within institutions and future intentions. Interviews were conducted until qualitative ‘saturation’ was reached. Interviews lasted between 17 and 90 min and were digitally recorded, transcribed. They were then thematically analysed, first being coded to identify themes of policy (design and implementation) building structure (current stock, issues and future plans) and Governance (policy and responsibility) These initial themes were then re-coded to identify the key themes within the data as; policy drivers, stakeholder engagement, complaints and responsibility.
Findings
Data availability: locating space temperature policies
Locating space temperature policies was not straightforward. While some universities publish their policy information publicly on their website (48 out of 115), others are hidden within intranets with restricted access. Following our requests, 32 additional policies were received, with 18 being from HEIs where no policy was publicly available and the remainder being newer versions of the publicly available policy. This resulted in 66 out of 115 HEI space temperature policies being analysed.
Of the HEIs who replied, three had no formal written policy but instead claimed to have ‘informal’ policies and practices that dictate how building heating and cooling is managed. One of the energy managers represented this category. Informal policies of this kind present transparency and governance issues, making it difficult for individuals to make complaints and reducing accountability for building occupants. Arguably, this lack of formal policy also runs the risk of missing the opportunity to link carbon and heating policies together to support carbon and energy reductions, as well as making the associated financial savings.
Regularly reviewing policy is a crucial part of ISO 14001, an environmental management certification system used by many HEIs, which states that ‘management shall review the organisation's environmental management system, at planned intervals, to ensure its continuing suitability, adequacy and effectiveness’ (BSI, Citation2015).
Of the policies analysed, 14 did not have a publication date on them, and those with dates ranged as far back as 2007. The majority of these (32) had no review date on them, and of those that did, 9 had missed the stated review dates in their published versions. Whilst 15 policies contained a point of contact concerning issues with heating or cooling, others had no contact details and no-one listed as responsible for the policy. It is possible that some of the policy versions found online were historical and had not been removed from websites. However, the policies received from direct requests ranged as far back as 2011, and many (18) had no review date stated.
Heating data availability
The amount of energy used for heating (and cooling) annually is unavailable via the HESA portal. Gas, electricity, combined heat and power (CHP), biomass and district heating are usually metered, as these are billable and are found in the HESA data along with the HEIs total consumption. An example can be found in .
Table 1. Examples of the two highest energy consumers (highlighted in red), the two mid-table consumers (highlighted in yellow), and the two lowest consumers (highlighted in green) from the 116 largest HEIs.
However, it is uncommon to measure the end-use of energy (e.g. heating) due to the lack of incentive and the financial cost involved. Without the heating data to compare between HEIs, there is a little evidence-based comparison or benchmarking that can be made between different aspects of policy to highlight their relative effectiveness. Hence the authors argue for making the reporting of end-use of energy data a requirement. As discussed by Cohen and Bordass (Citation2015), reported data needs to be made visible and actionable to be effective for driving effective policy.
Institutional temperature expectations
A significant variation was uncovered in the setpoint temperatures and indoor temperature ranges specified within policies.
Indoor target temperature
The majority of policies analysed set their indoor target temperature for workspaces based on the national guidance, with the most frequent specified indoor setpoint temperature being 21°C.Footnote6 47 out of 66 policies specifying a temperature range rather than a single target figure. A further 6 stated a specific maximum, and 4 stated a specific minimum. The remainder did not specify any indoor setpoint temperature. This variability rather than a specific target temperature is significant as tight temperature control is linked to higher energy consumption (EEBPP, Citation2000) due to buildings not taking advantage of excess thermal gains and tolerating excess thermal losses. The mean temperature range was 2.9°C, with a mode minimum of 19°C and maximum 21°C (see and ).
Figure 1. 53 policies state a minimum temperature for general workspaces. The majority of these (29) had a stated minimum of 19°C, and the range was from 16 to 21°C.
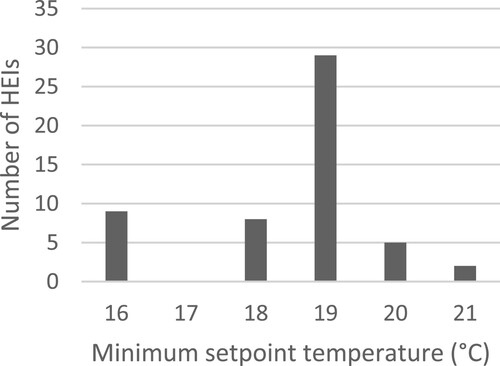
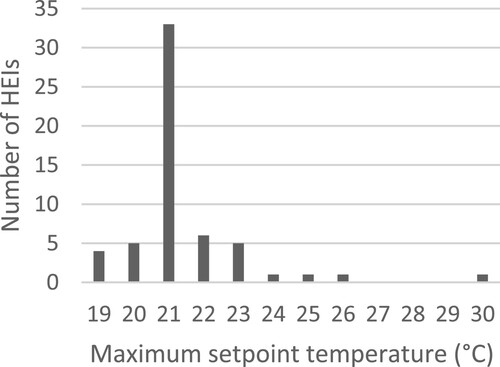
Figure 2. 57 policies state a maximum temperature for general workspaces. Of these, the majority (33) had a stated maximum of 21°C, but the range was from 19 to 30°C.
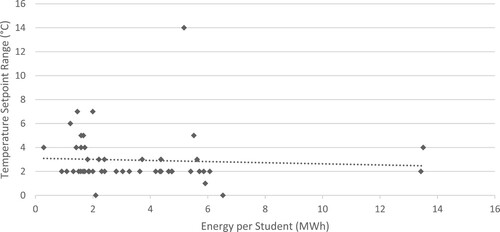
A correlation as identified by the Energy Efficiency Best Practice Programme (EEBPP, Citation2000) between a tightly controlled indoor temperature range and higher energy consumption was expected, but this could not be shown without specific heating consumption data. shows the specified indoor temperature setpoint range used in each policy against the total university energy consumption per student. A positive linear correlation was expected, but the analysis revealed a slight negative trend and a R2 of only 0.003, due to the use of total consumption data rather than heating specific data. Another factor masking the expected relationship is that space temperature policy can be used defensively against complaints (see energy manager context) and not necessarily followed operationally. This defensive use of policy may lead to indoor temperatures not being controlled as tightly as stated in the policy – a policy/practice gap.
Figure 3. 49 policies specified a range for the target indoor air temperature. HEIs annual energy consumption per student compared to the range of specified maximum and minimum setpoint temperatures. Student numbers and HEI energy consumption data sourced from HESA for the academic year 2017/2018. Dashed line showing linear best fit – slope = −0.047, intercept = 3.102, R2 = 0.003.
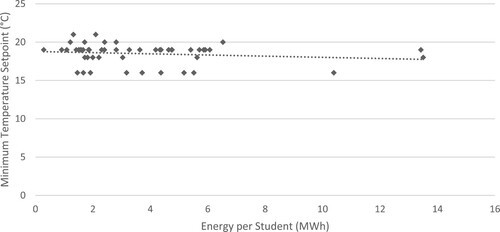
Energy consumption of HEIs who specified a minimum indoor setpoint temperature was compared with the total university energy consumption per student, reasoning a lower minimum indoor setpoint temperature should result in lower energy consumption. Again, as shown in , there was no clear correlation. A positive linear correlation was expected, although a slight negative trend and an R2 of only 0.026 was evidenced.
Figure 4. 53 policies specified a minimum target indoor air temperature. HEIs annual energy consumption per student compared to the minimum setpoint temperature. Student numbers and HEI energy consumption data sourced from HESA for the academic year 2017/2018. Dashed line showing linear best fit – slope = −0.076, intercept = 18.780, R2 = 0.026.
Indoor target temperature zoning
Different approaches were found regarding specified indoor target temperatures for spaces with different functions. These have been amalgamated into three general categories:
Specific temperature statements for different areas (e.g. maximum temperature 23°C in offices and libraries, 21°C classrooms, lecture theatres, labs, corridors, galleries and toilets, 19°C kitchens and workshops, 16°C sports halls).
A standard temperature across all building functions.
Commitment to achieving a ‘reasonable’ air temperature in line with Workplace Regulations (Gov.UK, Citation1992) and associated codes of practice (HSE, Citation2014).
The most commonly occurring zoning separation was between workspaces and student residences, with residences tending to have higher setpoint temperatures than other buildings – mode of 23°C. Another common difference was found between office spaces and corridors/circulation areas, which often had a set point of 16°C. Others stated a ‘preferred zone’ for space temperature ranging from 20 to 26°C and committed to keeping buildings within this range.
To look more closely into the specification of indoor target temperatures for zones based on their intended use, a comparison was made between the HEI specified target temperature for a zone to the temperature recommended by CIBSE (Citation2015) for the same space usage. Both recommended (by CIBSE) and specified (by the HEI) temperatures are typically stated as a maximum and minimum – as such, the mean of the specified range was used. In addition, several assumptions had to be made when mapping HEI specified zone usage to CIBSE nomenclature (see ), the most significant being if a space temperature policy stated something similar to ‘all campus buildings’, this was not considered specific enough to be considered in this analysis. 31 HEI's specified temperature zoning sufficiently to be analysed, and these were mapped to 12 zones using the CIBSE (Citation2015) nomenclature (see ).
Figure 5. Average zoned target temperatures, for HEIs that specified, compared to recommended average target temperatures listed in CIBSE Guide A .5 – ♦ = CIBSE average recommendation, – = HEI specified average target temperature. Data labels – <CIBSE average recommended Winter operative temperature> (<average target temperature from all HEIs that specified>). X-axis labels – <grouped zone name> (<number of times specified>), *1 – assuming dwelling bedroom from CIBSE Table – Note: this may not be appropriate as students will spend more time in their accommodation than a typical domestic bedroom as they also may use it for study, *2 – assuming lending/reference area from CIBSE Table *3 – assuming dwelling from CIBSE Table, *4 – assuming light work from CIBSE Table.
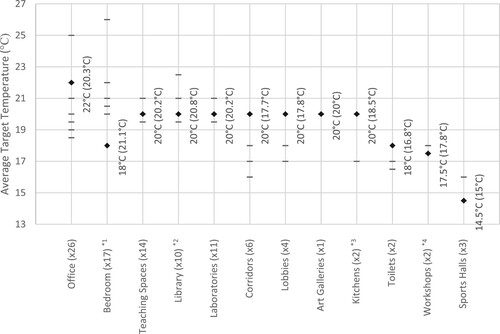
Table 2. HEI specified zone use to CIBSE nomenclature mapping.
Five zones were only specified in three or less space temperature policies, so no significant conclusions can be drawn. The two groups that stand out as having some notable discrepancies are bedrooms and corridors/lobbies.
For corridors and lobbies, the average temperature specified in the policies was 17.7°C and 17.8°C respectively, whilst CIBSE (Citation2015) recommends an average temperature of 20°C (19–21°C). In this case, it could be argued that the CIBSE recommendation is too high, particularly for corridors where occupants are unlikely to spend much time in sedentary activity and for foyers where occupants are likely to be moving between the area and the outside. Additionally, spaces such as these will often not be actively heated, instead relying on incidental gains from surrounding actively heated spaces. For these reasons, it is believed there is no issue with HEI’s specifying a lower target indoor temperature than recommended by CIBSE.
For bedrooms, the average temperature specified in the policies was 21.1°C, whilst CIBSE (Citation2015) recommends an average temperature of 18°C (17–19°C) for domestic bedrooms. It could be argued that the CIBSE recommendation for hotel rooms of an average temperature of 20°C (19–21°C) is more appropriate (although still at the bottom end of the range of average temperatures specified), as students are likely to spend more time in their rooms than would be expected in a domestic bedroom, due to their use for academic study as well as sleeping. In situations like this where a space has a mixed-use, a time-of-day based policy may be more appropriate, i.e. 17–19°C during hours when occupants are likely to be sleeping, and 19–21°C when occupants are likely to be studying. Another alternative would be to actively encourage students to use communal areas of campus such as the library for study, and then bedrooms need only be maintained at temperatures suitable for sleeping – this would require significantly more active engagement with the policy by all stakeholders to work. Furthermore, there was little commonality between HEIs in specifying heating periods in residences.
Institutional heating season
The second area of commonality between policies was their specification of a ‘heating season’; the period when heating is provided.
Specificity of heating season definition
Of the 66 policies analysed, 46 defined a specific heating season, and 20 did not. Each university was placed into one of four season-definitions categories, as shown in .
Table 3. Heating season specification approaches.
The most prevalent strategy was for a time-defined rather than a rule-based strategy. For the 32 universities that have either a defined or strictly defined heating season, there was minimal variation in the start and end dates. It could be argued that this policy is increasingly out of pace with a more rapidly changing and diverse range of external conditions.
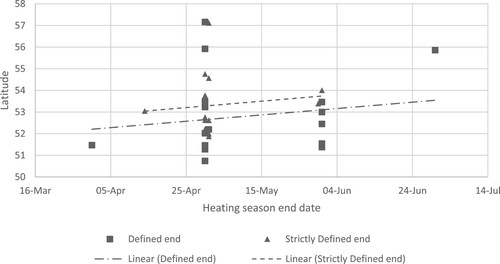
Heating season variation by latitude
Higher latitudes experience lower average outdoor temperatures and daylight hours due to the lower angle of incidence of solar radiation. Thus the researchers expected to find that heating seasons started earlier and finished later the further North (higher latitude), i.e. a negative correlation for heating season start and positive correlation for heating season end dates with latitude. As can be seen from and , our analysis did not reveal such a correlation. There are small but weak correlations for the ‘Strictly Defined’ set start and end dates, with only a R2 of 0.0003 for start date and 0.015 for end date. Out of the 46 HEIs that specified any heating season, the 11th most northerly HEI had the latest heating start date (November). For the latitude analysis, the start and end dates were assumed to be the first and last days of the specified months for the policies classified as defined.
Figure 6. 17x defined and 15x strictly defined HEI heating season start dates – defined assumed to be the start of the month – compared to the HEI main campus geometric centre latitude. Defined start linear best fit – slope = −0.004, intercept = 227.53, R2 = 0.001. Strictly Defined start linear best fit – slope = −0.002, intercept = 134.2, R2 = 0.0003.
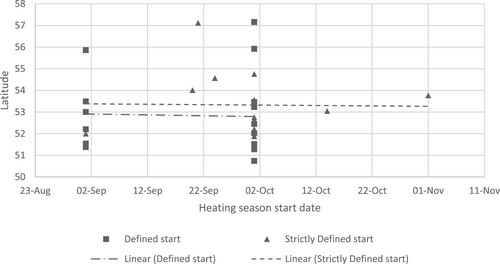
Figure 7. 17x defined and 15x strictly defined HEI heating season end dates – defined assumed to be the end of the month – compared to the HEI main campus geometric centre latitude. Defined end linear best fit – slope = 0.015, intercept = −587.84, R2 = 0.029. Strictly Defined start linear best fit – slope = 0.015, intercept = −593.04, R2 = 0.015.
The specific dates selected are likely to either be historical, governed by the traditional start and end dates of the seasons, or linked to the teaching dates of the Universities; with two policies explicitly stating that the heating season would either start or end simultaneously with an academic term. Whilst term dates significantly affect the heat load of a university, most will have staff and researchers on-site outside of teaching terms, and as such, there seems little logic in choosing heating dates based purely on teaching timetables.
A rule-based approach to season specification
In contrast to a ‘date-defined approach’, this research also identified a ‘rule-based’ approach whereby space temperature was managed according to a set of conditions or rules relating to external temperature. This approach has the potential for energy savings and improved thermal satisfaction for building occupants by applying heating and cooling only when warranted, avoiding unnecessary overheating during unseasonable warm spells. For example, one of the rule-based approaches found stated ‘the heating will be turned on when there have been three consecutive days where the average outside temperature is below 16°C’. This approach could result in energy reductions over strictly defined start and end dates.
Linking heating to outdoor temperature gives opportunities to save energy, rather than static start and end dates. In our sample, these tended to have a wide interval to account for years with unusually chilly Autumn or Spring seasons. For example, the monthly average outdoor temperature for a geographically central UK weather station was above 16°C for September (19.0°C) and May (16.9°C) over the last ten years (Met office, Citation2020). Moving from a static heating season start and end date to a more flexible approach should be relatively straightforward to implement with modern BMS. This change also has the potential to reduce occupant complaints where the end date might inadvertently fall arbitrarily within a cold period in a given year.
The authors believe the figure of 16°C is chosen based on the concept of base temperature used in degree-day analysis (CIBSE, Citation2006). A base temperature is the outdoor air temperature at which no supplementary heating is required inside a building to maintain the designed indoor air temperature. In the UK, the ‘standard’ base temperature is 15.5°C (CIBSE, Citation2006), although it is recognized that as the base temperature varies from building to building, it should be calculated on an individual building basis.
When selecting heating periods, there are practical considerations such as maintenance periods for heating systems, that must be planned into calendars and inform policymaking.
Finally, it should also be acknowledged that whilst established seasonal time-defined approaches may have worked well enough when initially implemented, weather patterns are becoming less predictable (Met Office, Citation2021). Thus there is a need for a more nuanced, rule-based approach to reduce energy consumption and better support occupant comfort in university buildings.
Heating in student residences
As discussed above, temperatures and heating periods were often prescribed differently for student residences than workspaces such as offices and teaching rooms. However, there was little agreement across institutions regarding the periods for heating student residences. Examples of different heating schedules are shown in and . Many universities continuously heat residences throughout the day, with the longest continual heating period being from 6:30am until 2am. Another approach is to structure heating times around when students are likely to be in their accommodation, e.g. breakfast, lunch and evenings, and maintain a lower set point during the ‘lecture’ times when students are more likely to be using communal buildings. Further refinements to this approach are maintaining different schedules during weekdays and weekends, and recognizing that teaching schedules have also been extended in recent years.Footnote7 As discussed below, this area could substantially benefit from the greater engagement of all stakeholders (building occupants and energy/facilities managers).
Table 4. Examples of different heating schedules in residential accommodation across the week.
Table 5. Examples of different heating schedules in residential accommodation across the year.
Findings summary
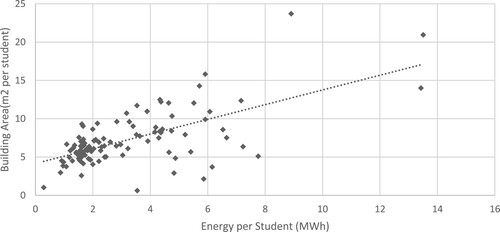
This study found a lack of consistency in space heating policy across the HEI sector. There was no correlation between narrow ranges of temperature and energy use, and no relationship between the latitude of university and space temperature policy, suggesting policy is not well contextualized to geographic location. There are clear correlations with other non-space temperature policy drivers, such as research funding () and larger building footprint (), both of which result in higher energy consumption (see also Ward et al., Citation2008 and Wadud et al., Citation2019).
Figure 8. All 114 policies where research funding data were available. HEIs annual energy consumption per student compared to their annual research funding per student (sorted from lowest per-student energy consumption to highest). HEI energy consumption, student numbers and research funding data sourced from HESA for the academic year 2017/2018. Dashed line showing linear best fit – slope = 1510.3, intercept = −2565.6, R2 = 0.673.
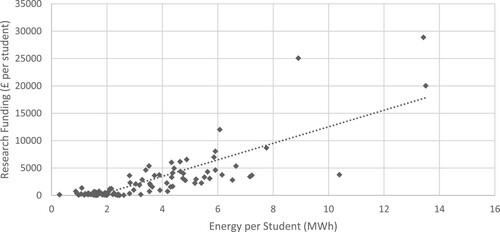
Figure 9. 108 policies where a building area was available. HEIs annual energy consumption per student compared to the non-residential building area per student (sorted from lowest per-student energy consumption to highest). HEI energy consumption, student numbers and building area data sourced from HESA for the academic year 2017/2018. Dashed line showing linear best fit – slope = 0.96, intercept = 4.158, R2 = 0.414.
Energy manager context
There was considerable interest in this research project from those contacted with requests for policies, and universal acceptance of a clear gap regarding good practice guidance within the sector. The interviews revealed four further considerations: policy drivers, stakeholder involvement, complaint tracking and responsibility for thermal comfort. It should be noted that all participants were male, which could conceivably colour attitudes to acceptable indoor temperature ranges due to established differences attributed to gender and physiology (Kingma & van Marken Lichtenbelt, Citation2015).
Policy drivers
Policy can be used to drive energy reduction, but as discussed above, this study was unable to show this correlation. Additionally, there was little evidence of clear linkage between HEI Carbon Management Plans and space temperature policies. As heating and cooling form a significant portion of consumption (67% of energy, Gov.UK, Citation2019), there is considerable scope for space temperature policies to be used to help achieve overall carbon reduction targets. This research found that these two documents were rarely linked, so the potential to effectively use space temperature policy to reduce emissions appeared to be missing at the time of the research.
One energy manager discussed how, with HEFCE dissolving and being replaced by Office for Students (OfS), the link between carbon management and funding had disappeared. With it, political pressure and drivers for change at the institutional level had vanished, describing the carbon management plan as more of a summary document than a destination map, and noting sustainability has come to mean financial rather than environmental sustainability.
According to the Environmental Association for Universities and Colleges sustainability commitments page, in Citation2021, 39 of their member organizations have declared a climate emergency, and 57 have set Carbon reduction targets (including net-zero and carbon-neutral). As pressure from students increases (Unite Students,Footnote8 SOS UK student climate change trackerFootnote9), HEIs will need to increase their efforts in this area, and the link between space heating and carbon reduction could be further emphasized.
Stakeholder engagement
When asked how space temperature policy was developed, there was little claimed use of empirical evidence or data driving the policy decisions. Instead, managers admitted they had often ‘inherited’ policies from their predecessors, including in some cases, legacy heating regimes. Little if any consultation with users was conducted, and minor tweaks were implemented usually in tandem with other drivers such as changes to district heating systems and CHPs making it more cost-effective to deliver longer heating periods, driven by the high cost of electricity. One manager stated:
the Heating and Cooling policy was absolutely simple: there was no cooling policy and the heating policy was the day after graduation you turn the heating off, and you turn the heating back on again on the whatever of September or as late as you can get it before the protests became so loud that you couldn't stand the noise any longer
one of the things we agreed with the student's union was [heating policy] … we had a certain number of hours heating a day it was entirely up to the student union in the student's accommodation … what the heating hours would be.
Complaints and their systematic tracking
A common theme that appeared around policy formation was that of minimizing complaints, with evidence of policy being used defensively, rather than proactively to drive carbon savings:
… with a lot of foreign students coming in as well whose tolerance for what we would think was quite a temperate autumn but they were very, very cold, we made a general decision that we would have the heating on when the main influx of foreign students arrived
Another example of heating policy being used defensively came from an institution where more emphasis was placed on personal responsibility for thermal comfort: “For a long time {the policy} was on my auto-reply. I just had a constant auto-reply on saying, ‘if you are emailing me about heating, please click this link and read that policy first.’”
The interviews with energy managers also highlighted the absence of formal systematic tracking of complaints, making it difficult to demonstrate the effectiveness of any policy changes. It would be helpful to compare complaints at HEIs with continuous residential heating to those that break up the periods to determine the effect of this policy on students. There was little rationale behind these periods, and further investigation into the effect of reducing heating periods would inform targeted carbon and financial savings.
Responsibility sits with the energy manager, not the inhabitants
The final theme emerging from the interviews was where responsibility lay for thermal comfort, which was seen as sitting within the energy manager role and the facilities team: ‘Oh it would be myself and the maintenance team’. There was also a sense of frustration from some interviewees: ‘People particularly in higher education are just used to being mollycoddled a little bit too much’. Managers felt that changes made to policies and procedures had reduced the number of complaints, but as there was no evidence of systematic tracking and monitoring of complaints regarding temperature, this could not be verified.
One HEI energy manager interviewed had developed a more adaptive policy. Here, more emphasis was placed on personal responsibility: ‘we had one before that, but I think I really beefed it up to emphasise the personal responsibility’ The policy was used as an opportunity to make people more personally responsible for their thermal comfort and to make managers more responsible for communicating the policy and dealing with complaints. ‘it's your line manager's responsibility to be the first port of call for this, which is basically them saying, no, there's nothing wrong, stop moaning’.
Energy manager context summary
The energy managers interviewed were instrumental in balancing energy management and associated costs with other organizational priorities such as staff and student satisfaction and complaints. Where there was evidence of policy being used effectively, it was revealed as an essential tool in negotiating an agreed set of expectations surrounding indoor thermal comfort, the provision of heating, and the placing of an emphasis on personal responsibility and adaptation.
It is important to recognize that HEIs exist in a market economy in the UK and are hugely sensitive to pressures from students, and competition with other similar institutions. However, with positive use of policy and by working with stakeholders to agree shared objectives for thermal comfort in the context of the climate emergency, there appears to be scope for both energy savings and increased comfort via user agency. Adoption of sector-wide effective policy linked to carbon management is vital to help drive this change.
Considerations for HEI heating policy
For those responsible for developing, reshaping and maintaining UK HEI space temperature policy, this research helps to highlight areas that could facilitate reduction of heating and cooling energy demand. The lack of publicly accessible data on either the energy consumed in heating and cooling, or complaints about space temperature at HEIs, makes a quantitative comparison and evidential basis for the effectiveness of these types of policies not possible.
Policy considerations for HEIs
Policy with purpose
HEIs should be more explicit about the purpose of their space temperature policy. O'Broin et al. (Citation2015) evidence that regulatory policies can be effective at reducing energy demand, and this was supported by the findings of this research, which highlights the potential space temperature policies have to reduce energy consumption and the opportunity to link to Carbon Management Plans. With this comes more responsibility for building occupants to help achieve comfort by ‘working with’ buildings and policy, and to rely less on mechanical heating and cooling systems (and building managers). The link between indoor temperature and environmental issues is under-emphasized in the current policy landscape, as is the responsibility of occupants to help address their own comfort needs in other ways, through changing dress codes, use of the space, and other work practices.
Policy that engages
Central to the success of these new policies is a shift in thermal comfort expectations. Such a shift will necessitate more comprehensive consultation with users and should be situated within the current climate emergency, with carbon saving initiatives encouraging greater ownership and acceptance of more adaptive thermal comfort. Involving all stakeholders in developing future policies would improve engagement and personal responsibility for thermal comfort (Nicol et al., Citation2012). Further investigation into the impact on inhabitants of different heating periods and seasons specific to the institution's location, users, and programmes would also make the policy more fit for purpose given each HEI's specific context. As indicated in the interviews, policy is critical to defending the need to take adaptive actions when an environment that is acceptable in policy terms, is uncomfortable to a given individual.
Policy that is current
Only 14 of the policies were dated, and the majority (32) had no review date, with 9 missing their review dates. ISO 14001 (BSI, Citation2015) states that policies should be dated, regularly reviewed and also name a current employee as the primary contact. A named contact is important to building users who may have queries, comments, or complaints, allowing effective collation and actioning of genuine problems. Reviewing policies, particularly with regards to how effectively they facilitate comfort whilst minimizing energy use, is an essential part of improving performance.
Policy that is evidence-based
This study found that current space temperature policies can be simple evolutions of previous policies, with little or no active consideration of the policy’s specific provisions. Only 10 of our HEIs adopted rule-based heating regimes, so for the other 56 there is potential for unnecessary heating and cooling during shoulder seasons and sudden changes in outdoor conditions. Adopting a rule-based approach focussed on external temperatures rather than ‘season-related’ definitions could be an effective way of reducing energy consumption and increasing thermal comfort, as external temperature are likely to vary even more dynamically in the future. However, the savings potential needs further research, and more in-depth studies comparing different heating regimes at different institutions against heating energy demand should be conducted.
As discussed above, consideration should also be given to the impact of ‘invisible’ policies on University energy consumption. Current educational policy trends such as extended teaching days and 24 h library access can impact energy use and thermal comfort, as buildings are occupied for longer and may not cool down effectively during shorter unoccupied periods (Royston, Citation2016). More flexible use of space and flexible working, as catalysed by the Covid-19 pandemic, could provide more energy and carbon savings, but only if the infrastructure, policies and processes recognize these changes and are adapted accordingly.
Policy considerations for national institutions
National institutions (such as the Government or HESA) have a significant impact on strategy in HEIs. They should consider their responsibility in engendering the positive impact of space temperature policies on energy reduction, if established as a best practice and regulatory framework sector-wide. There is currently no national guidance on space temperature policy. As our experts have indicated, removing policy drivers such as the linking of finance and carbon management planning has weakened action toward gains in this area. Further research should target the provision of such guidance, and the following three policy considerations for national organizations are proposed:
Data policy. Disaggregated data are required if effective policy relating to the heating and cooling buildings in UK HEIs is to be further developed and refined. Policymakers have a crucial role in establishing procedures to capture and report data relating to policy effectiveness. HEIs should be encouraged – or required – to record and publish their end-use energy data and systematically record and share data on their space temperature challenges and user satisfaction. These datasets would help to provide evidence and benchmarking for future policy recommendations.
It should also be acknowledged that the recording of end-use energy data is likely to require a substantial financial investment by the HEIs. However, benefits should be significant, enabling effective frameworks for space temperature policy to be established at a national level. The support of large-scale data monitoring across multiple and geographically diverse sites should be considered, and learnings from data should be shared (e.g. in the form of best practice reports and case studies).
Developing good practices. Supporting research into the area of good practice in space temperature policy and carbon reduction has the potential for delivering savings across many sectors beyond HEIs, making further contributions towards meeting our legally binding carbon reduction targets as a nation. Therefore, national organizations should develop networks and processes to further these learnings and share good practices across sectors.
Driving environmental change. The authors strongly believe that the link between carbon reduction and funding should be re-established. Whilst the Carbon Management Plans produced during the period of regulated reporting on Carbon Management in England were not consistently linked to other HEI policies, it is clear that the link between funding and the plans’ generation drove a minimum level of consideration of carbon and energy management.
Limitations
This research represents a subset of space temperature policies in UK HEIs, with the focus on the larger and more research-intensive institutions to limit our scope to the highest consumers. Higher student numbers tend to correlate with larger spaces, which in turn correlates with higher energy consumption (Wadud et al., Citation2019). Therefore, there is no data on smaller universities, who may conceivably exemplify good practice and have further valuable insights. Additionally, not all policies from institutions above the minimum size threshold were available (49 unavailable, 43% of our initial sample). The study is limited to the UK, so the international policy landscape may differ and have different priorities, especially concerning maximum temperatures and cooling policy, particularly in hotter climates. Additional research across differing temperature zones may be valuable for the UK considering the warming climate and growing need for cooling.
It is also worth noting that the interviews were limited to five experienced energy managers, and while the findings from these expert interviews are insightful, they should not be overgeneralized. It is also acknowledged that data linking policy to heating energy use was not available, which means that there was no empirical way to measure the effectiveness of the suggested policy improvements. Thus, the paper provides a reflective discussion of key issues revealed by the review of available policies, highlighting various approaches across HEIs to stimulate discussion on good practice in future policy development. The research also reveals the need for such empirical data to be made more routinely available for future analysis. It is also recognized that differences in building stock such as size, locations, specialism, and age need to be considered when benchmarking institutions against one another. Therefore, a cautious approach mindful of the specific UK HEI context is needed to interpret the findings of this research more widely.
Concluding remarks
HEIs are high energy users and individually and collectively they need to reduce carbon-intensive end uses such as heating. A more actively used, effective, and directed heating policy is important to help achieve this. With the global trend of increasing temperatures and more unpredictable weather patterns, energy used for cooling also looks set to increase in the UK. This research helps to highlight that cooling needs to be better understood, acknowledged, and integrated, both in terms of policy and inhabitant needs. This study has shown little existing work on adaptive policies, despite their demonstrated potential for reducing energy consumption and increasing thermal comfort.
This research has also revealed several gaps in energy end-use data, systematic recording of issues, and policy monitoring and reviewing. The analysis distilled several considerations for HEIs themselves and national policymakers towards starting the discussion on effective UK HEI space temperature policy, targeting carbon emissions reduction and a defensible change in organizational practice around heating and cooling in an increasingly dynamic and warming climate. More robust governance at the institutional and sector level, including the reestablishment of required reporting and data availability, could lead to empirically based, effective policy development for energy and carbon reduction from space heating policy.
On top of this, and with climate emergency and Paris decarbonization targets in mind, space heating policy is an area that would benefit from further investigation and more open and accountable data and practice. Should the HE sector want to radically transform the way it heats (and cools) our buildings to achieve decarbonization, this appears to be the time to do it. There is a considerable opportunity to use this juncture to rethink working practices, clothing conventions, and even teaching methods (and hence use of space) to make significant energy and carbons savings.
Acknowledgements
The authors would like to thank all the UK HEIs who responded to policy requests and expressed interest in the project. We would also like to thank the energy managers who participated in interviews, and the associations which allowed us to post information requests on their websites. Finally, we would like to acknowledge the European Regional Development Fund Grant ‘Low Carbon Lancashire Innovation Hub (19R16P01012)’, and Lancaster University, who funded this work.
Disclosure statement
No potential conflict of interest was reported by the author(s).
Additional information
Funding
Notes
6 Non-residential indoor spaces, or offices if specified
7 It should be noted that our analysis was undertaken before the Coronavirus pandemic and the associated disruptions to teaching schedules.
References
- Altan, H. (2010). Energy efficiency interventions in UK higher education institutions. Energy Policy, 38(12), 7722–7731. https://doi.org/10.1016/j.enpol.2010.08.024
- ASHRAE Standard 55-2020. (2020). ASHRAE standard thermal environmental conditions for human occupancy. American Society of Heating, Refrigerating and Air-Conditioning Engineers, Inc.
- Blake, J. (1999). Overcoming the ‘value-action gap’ in environmental policy: Tensions between national policy and local experience. Local Environment: Polluters, Victims, Citizens, Consumers, Obstacles, Outsiders and Experts: The Public and The Environment, 4(3), 257–278. https://doi.org/10.1080/13549839908725599
- BSI. (2015). BS EN ISO 14001:2015 – Environmental Management Systems. Requirements with guidance for use.
- CIBSE. (2006). TM41: 2006 degree-days: Theory and application. The Chartered Institution of Building Services Engineers.
- CIBSE. (2015). Environmental design - CIBSE Guide A (8th edition) - 1.5.1 heated, cooled and air conditioned spaces. The Chartered Institution of Building Services Engineers.
- Clear, A. K., Mitchell Finnigan, S., Olivier, P., & Comber, R. (2017). I'd want to burn the data or at least nobble the numbers: Towards data-mediated building management for comfort and energy use. In Proceedings of the 2017 ACM Conference on Computer Supported Cooperative Work and Social Computing (CSCW’ 17) (pp. 2448–2461). Association for Computing Machinery.
- Cohen, R., & Bordass, B. (2015). Mandating transparency about building energy performance in use. Building Research & Information, 43(4), 534–552. https://doi.org/10.1080/09613218.2015.1017416
- EEBPP. (2000). Energy use in offices energy consumption Guide 19. Energy Efficiency Best Practice Programme.
- EAUC. (2021). Retrieved june 21, 2021, from https://www.eauc.org.uk/sustainability_commitments Accessed 21/06/2021
- Fanger, P. O. (1972). Thermal comfort: Analysis and applications in environmental engineering. McGraw-Hill.
- Goulden, M., & Spence, A. (2015). Caught in the middle: The role of the facilities manager in organisational energy use. Energy Policy, 85, 280–287. https://doi.org/10.1016/j.enpol.2015.06.014
- Gov.UK. (2014, October 14). Cold Weather Plan for England. https://www.gov.uk/government/publications/cold-weather-plan-for-england-2014
- Gov.UK. (1992). Workplace (Health, Safety and Welfare) Regulations 1992. HMSO. (SI 1992 No 3004).
- Gov.UK. (2008). Climate Change Act 2008. http://www.legislation.gov.uk/ukpga/2008/27/contents
- Gov.UK. (2017). UK Climate Change Risk Assessment 2017 Report. https://www.gov.uk/government/publications/uk-climate-change-risk-assessment-2017 accessed 23/01/2022
- Gov.UK. (2019). Energy consumption in the UK data tables. https://www.gov.uk/government/statistics/energy-consumption-in-the-uk
- Gov.UK. (2019, June 27). UK becomes first major economy to pass net zero emissions law. https://www.gov.uk/government/news/uk-becomes-first-major-economy-to-pass-net-zero-emissions-law
- Health and Safety Commission. (1992). Workplace Health, Safety and Welfare. Workplace (Health, Safety and Welfare) Regulations, Approved Code of Practice and Guidance. HM Stationery Office.
- HEFCE. (2010, January). Carbon reduction target and strategy for Higher Education in England 2010. https://webarchive.nationalarchives.gov.uk/20100303151317/http://www.hefce.ac.uk/pubs/hefce/2010/10_01/
- HSE. (2014). L24 Workplace Health, Safety and Welfare: Workplace (Health, Safety and Welfare) Regulations 1992. 2nd ed. H. A. S. Executive.
- Hübler, M., Klepper, G., & Peterson, S. (2008). Costs of climate change. The effects of rising temperatures on health and productivity in Germany. Ecological Economics, 68(1-2), 381–339. https://doi.org/10.1016/j.ecolecon.2008.04.010
- Jackson, T. (2005). Motivating sustainable consumption. A review of evidence on consumer behaviour and behavioural change, A report to the sustainable development research network. Centre for Environmental Strategy, University of Surrey. http://www.sd-research.org.uk/wp-content/uploads/motivatingscfinal_000.pdf
- Jevons, R., Carmichael, C., Crossley, A., & Bone, A. (2016). Minimum indoor temperature threshold recommendations for English homes in winter – a systematic review. Public Health, 136, 4–12. https://doi.org/10.1016/j.puhe.2016.02.007
- Kingma, B., & van Marken Lichtenbelt, W. (2015). Energy consumption in buildings and female thermal demand. Nature Climate Change, 5(12), 1054–1056. https://doi.org/10.1038/nclimate2741
- Kjellstrom, T., Briggs, D., Freyberg, C., Lemke, B., Otto, M., & Hyatt, O. (2016). Heat, human performance, and occupational health: A key issue for the assessment of global climate change impacts. Annual Review of Public Health, 37(1), 97–112. https://doi.org/10.1146/annurev-publhealth-032315-021740
- Mantesi, E., Chmutina, K., & Goodier, C. (2022). The office of the future: Operational energy consumption in the post-pandemic era. Energy Research & Social Science. Volume, 87, 102472.
- Mazhar, M. U., Bull, R., & Lemon, M. (2017). Critical success factors for embedding carbon management in organizations: Lessons from the UK higher education sector. Carbon Management, 8(5-6), 379–392. https://doi.org/10.1080/17583004.2017.1386533
- Met office. (2020). Historic Station Data. [online]. https://www.metoffice.gov.uk/pub/data/weather/uk/climate/stationdata/suttonboningtondata.txt
- Met Office. (2021). UK Climate Projections; Headline Findings. https://www.metoffice.gov.uk/binaries/content/assets/metofficegovuk/pdf/research/ukcp/ukcp18_headline_findings_v3.pdf
- Nicol, F., Humphreys, M. A., & Roaf, S. (2012). Adaptive thermal comfort: Principles and practice. Earthscan.
- Nicol, F., & Parsons, K. (2002). Editorial: Special issue on thermal comfort standards. Energy and Buildings, 34(6), 563–572. https://doi.org/10.1016/S0378-7788(02)00006-3
- O'Broin, E, Nässén, J., & Johnsson, F. (2015). Energy efficiency policies for space heating in EU countries: A panel data analysis for the period 1990–2010. Applied Energy, 150(C), 211–223. https://doi.org/10.1016/j.apenergy.2015.03.063
- Rhe/24. (2017). BS EN 12831-1:2017 - Energy performance of buildings. Method for calculation of the design heat load. Space heating load, Module M3-3.
- Royston, S. (2016, April). Invisible energy policy in Higher Education. In DEMAND conference, Lancaster, UK, (pp. 13–15). http://www.demand.ac.uk/wp-content/uploads/2016/05/Royston-Invisible-energy-policy-in-HE.pdf
- Royston, S., Selby, J., & Shove, E. (2018). Invisible energy policies: A new agenda for energy demand reduction. Energy Policy, 123, 127–135. https://doi.org/10.1016/j.enpol.2018.08.052
- Schellen, L., van Marken Lichtenbelt, W., Loomans, M., Toftum, J., & De Wit, M. (2010). Differences between young adults and elderly in thermal comfort, productivity, and thermal physiology in response to a moderate temperature drift and a steady-state condition. Indoor Air, 20(4), 273–283. https://doi.org/10.1111/j.1600-0668.2010.00657.x
- University of Oxford. (2021). https://www.ox.ac.uk/about/building-our-future/buildings/listed-buildings
- van Marken Lichtenbelt, W., Hanssen, M., Pallubinsky, H., Kingma, B., & Schellen, L. (2017). Healthy excursions outside the thermal comfort zone. Building Research & Information, 45(7), 819–827. https://doi.org/10.1080/09613218.2017.1307647
- Wadud, Z., Royston, S., & Selby, J. (2019). Modelling energy demand from higher education institutions: A case study of the UK. Applied Energy, 233-234, 816–826. https://doi.org/10.1016/j.apenergy.2018.09.203
- Ward, I., Ogbonna, A., & Altan, H. (2008). Sector review of UK higher education energy consumption, energy policy. Volume, 36(8), 2939–2949. https://doi.org/10.1016/j.enpol.2008.03.031
- Whittle, R. (2015). Guilt and elation in the workplace: Emotion and the governance of the environment at work. Environmental Values, 24(5), 581–601. https://doi.org/10.3197/096327114X13947900182111
- Zhang, L., Li, H., Lee, W. J., & Liao, H. (2021). COVID-19 and energy: Influence mechanisms and research methodologies. Sustainable Production and Consumption, 27, 2134–2152. https://doi.org/10.1016/j.spc.2021.05.010
- Zhang, X., Pellegrino, F., Shen, J., Copertaro, B., Huang, P., Kumar Saini, P., & Lovati, M. (2020). A preliminary simulation study about the impact of COVID-19 crisis on energy demand of a building mix at a district in Sweden. Applied Energy, 280, 115954. https://doi.org/10.1016/j.apenergy.2020.115954