
ABSTRACT
Given the environmental and energy crises, European directives are targeting building energy efficiency. Architects must improve the thermal performance of their designs to approach Nearly-Zero Energy Building (NZEB) standards. Energy-efficient experimental buildings from the 1970s are often held up as inspiring examples of energy-conscious architectural design. However, the lack of quantitative data about their thermal performance, measured using current evaluation standards and units, makes their legacy difficult to interpret today. This study aims to verify the relevance of 1970s energy-efficient architecture by quantifying the thermal performance of an exemplary case: the kindergarten designed by Sergio Los in Crosara (Italy). The thermal performance of the building in its original configuration is re-assessed using energy simulation software and discussed relative to past and present standards, including carbon emissions. The results quantify the contributions of different energy-conscious strategies and show that the building’s pioneering performance results primarily from the architect’s bioclimatic design decisions. The study demonstrates how architects reduced building energy demands in the 1970s and explores the impact of their strategies relative to contemporary efficiency priorities.
Introduction
Energy used to heat and cool buildings accounts for around half of the energy consumption in the European Union (EU) (EC, Citation2022). Even though fossil fuel use in the EU decreased by 18.4% between 2019 and 2020, only 23% of the energy used to provide indoor thermal comfort in the EU is currently renewable (Eurostat, Citation2022). That means that the thermal performance of EU building stock – 75% of which is inefficient (EC, Citation2020) – significantly influences the production of carbon emissions. To increase the energy performance of its building stock, the EU has implemented the Energy Performance of Buildings Directive (EPBD) and the Energy Efficiency Directive, which were published in 2010 and 2012, respectively, and revised in 2018. Given these directives, the concept of Nearly-Zero Energy Buildings (NZEB) is gaining popularity and influencing the implementation of norms and regulations (Ligardo-Herrera et al., Citation2022).
Even though NZEB is a recent concept, developed experimentally after around 2000 (Jaysawal et al., Citation2022), its definition and targets refer back to previous architectural experiments. Recent studies have emphasized the relevance of the pioneering experiments in energy-efficient architecture conducted in the 1970s to contemporary sustainable goals in architectural practice (Barber, Citation2016; Borasi et al., Citation2007; Kallipoliti, Citation2010; Maniaque, Citation2014; Sadler, Citation2008). However, the case studies conducted to date have been chiefly historical and qualitative (Lopez, Citation2021; Mannell, Citation2018; Sadler, Citation2006). The lack of contemporary quantitative analysis of the energy efficiency of these experimental buildings means that their legacy is little understood. The surviving quantitative thermal performance documentation from the 1970s – surveys, handbooks and conference proceedings – uses obsolete evaluation methods and outdated units of measurement.
This study examines and quantifies strategies employed in the architecture of the 1970s in an exemplary case, particularly the reduction of fossil fuel demand for indoor comfort. The analysed building is a kindergarten in Crosara (Italy) that has long been recognized for its outstanding energy performance and pioneering heating systems (Funaro & D’Errico, Citation1992). Completed in 1978, this building was designed by the Italian architect Sergio Los in 1972 before the first Italian regulations for building energy efficiency were instituted (Legge Citation373, Citation1976). Los intended to reduce energy demand for ecological reasons. After the 1973 oil shock, the project, which already included energy-conscious strategies, was modified to include a solar thermal heating system. The kindergarten was one of the first solar schools to be completed in Europe (Achard & Gicquel, Citation1986).
This research combines historical documentation of the case with quantitative analysis of its energy efficiency. Quantitative results are obtained using contemporary software tools to evaluate energy demands and simulate thermal performance. These tools, developed primarily to certify the energy performance of buildings, can be used to analyse historical examples. For instance, simulation software has been used to assess the energy efficiency of pre-industrial buildings (Gagliano et al., Citation2016) and demonstrate the climate-conscious attitude of modern heritage buildings (Galiano-Garrigós et al., Citation2022; Requena-Ruiz, Citation2016). The thermal performance of the Sergio Los kindergarten in Crosara was assessed according to current evaluation methods, including the quantification of carbon emissions, a key factor in current energy standards. The quantitative analysis of energy-efficient strategies developed 50 years ago, within the limits of the technologies available at that time, demonstrates the primary role of bioclimatic design compared to other solutions and offers insights into the priorities of contemporary architectural research and practice to reduce carbon emissions linked to indoor thermal comfort.
Research methods
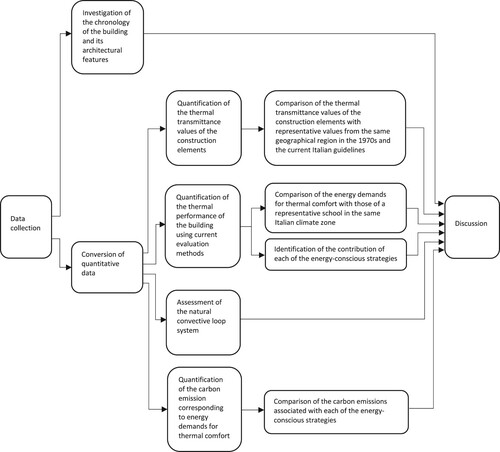
This research takes an interdisciplinary approach, drawing upon historical documentation of the selected case and an analysis of its energy efficiency. Several steps are involved (). After data collection (see the next subsection), the qualitative data were used to investigate the chronology of the building and its architectural features. The quantitative data were then converted into current international measurement units, which were used to (1) quantify the thermal transmittance (U) values of the construction elements; (2) quantify the thermal performance of the building according to current evaluation methods; (3) assess the natural convective loop system (a passive solar system installed in the building); and (4) quantify the carbon emissions which correspond to the thermal comfort energy demands. The quantitative analysis was used to (1) compare the U values of the construction elements of the kindergarten to the representative values of the same geographical region in the 1970s and current Italian guidelines; (2) compare the kindergarten’s thermal comfort energy demands with those of a representative school of the same Italian climate zone; (3) identify the contributions of the different energy-conscious strategies applied in the kindergarten; and (4) compare these in terms of carbon emissions. Finally, these outcomes were discussed to assess the effectiveness of the energy-conscious strategies and their relevance to current architectural practice and research.
Figure 1. Research workflow.
Data collection
The data used for the present study were collected from different sources: published literature, the Synergia Progetti: Sergio Los, Natasha F. Pulitzer archive, visits to the building and interviews with the architects Sergio Los and Natasha Finali Pulitzer. The data collected about the kindergarten included both qualitative information (e.g. descriptions of the building, architectural drawings, pictures) and quantitative information (e.g. construction drawings, construction reports, measured heating demands, design calculations of heating energy demands, building system design specifications). The literature and standards provided the data needed for comparative analysis (the representative U values of construction elements from the same geographical region in the 1970s, the current Italian guidelines for U values and the energy demands for thermal comfort of a representative school in the same Italian climate region). provides an overview of the source and use within the study of the data collected. The availability of quantitative data from different sources – especially measured energy consumptions – increased the reliability of the study and its results.
Table 1. Overview of the data: source and use in the study.
Research tools
The first step in the quantitative analysis was the construction of a detailed 3D model of the kindergarten using the software Autodesk Revit. The building is represented with its original spatial organization and construction specifics. A custom library of construction elements was developed to represent the original construction elements and their thermal transmittance (U) values.
To perform the thermophysical or thermal balance calculations for the kindergarten, the 3D model was imported into the software Lesosai 2021. Lesosai is a Swiss software application developed in 1984 by E4tech Software, in collaboration with the Swiss Federal Institute of Technology in Lausanne, to perform ecological and energy certifications and evaluations of buildings. This software is compatible with both Building Information Modeling and Whole-Building Energy Modeling processes. It is currently used by professionals to certify that buildings meet various European national standards and international standards, including DGNB, BREEAM, SNBS and Minergie. Lesosai is also a cutting-edge simulation tool, employed by researchers to investigate the potential of solar integration in buildings (Bushra, Citation2022), as well as the operational and embodied carbon emissions of buildings (Keller et al., Citation2021). Lesosai allows one to calculate a building’s thermal balance according to EN ISO 13790, the same standard used to provide data for a representative school in the same Italian climate region (Corrado et al., Citation2016). The validity of this hourly calculation method for the calculation of thermal loads for heating and cooling has been confirmed by recent comparative studies on different calculation standards (Ballarini et al., Citation2019).
In Lesosai, each room of the 3D model of the kindergarten was associated with the use that it was designed to have originally. The model was then used to calculate the building’s thermal balance using the hourly climate data (provided by the European database Meteonorm) for the exact location of the building, and exact local shading data (provided by the European Photovoltaic Geographical Information System). The calculation quantified the annual energy demands for indoor thermal comfort, based on inputs and losses of thermal energy. The thermal balance included the quantification of the carbon emissions that would be required to achieve the thermal comfort levels specified by EN 15603.
Subsequently, IES Virtual Environment (VE) was used to assess the natural convective loop system in the kindergarten. IES VE, developed in the U.K., is a suite of applications for building performance analysis that can be used to conduct dynamic thermal simulations, test passive solutions, compare low-carbon technologies, and simulate energy use, carbon emissions and occupant comfort. IES VE provides a wide range of analysis capabilities suited for the attainment of international certifications such as LEED. This software has been recently used to investigate the potential of natural ventilation (Ji et al., Citation2020) and the benefit of passive solar design for thermal comfort (Naik et al., Citation2021).
The rooms of the 3D model served by the natural convective loop were imported into IES VE and associated with their operation profiles. The geometry of the model was completed within IES VE by adding the elements of the air circulation system located within the walls and underneath the ground floor. Subsequently, the model was used to perform a dynamic thermal simulation in free-floating conditions to generate hourly data that provided the boundary conditions for a computational fluid dynamics (CFD) analysis of the indoor microclimate. The CFD simulated the operation of the natural convective loop, representing the temperature and velocity of indoor air.
Description of the case
The kindergarten in Crosara, a settlement located in the municipality of Marostica, Northern Italy (45°46′26.5″ N 11°36′47″ E, elevation 417 m, Italian climate zone E (between 2101 and 3000 annual heating degree days)), is recognized for its architectural qualities and energy efficiency (De Santis, Citation2000). In 1972, when the architect Sergio Los began designing it, he wanted to combine the poetics of architectural composition (such as the compositions designed by Carlo Scarpa, Los’s former mentor and employer) with the consideration of climate in architectural design (already present in Frank Lloyd Wright’s climate-conscious architecture; Banham, Citation1967). Los was sensitive to the ecological concerns of the time and receptive to studies of autonomous dwellings carried out in the 1970s at the Technical Research Division of the Department of Architecture at Cambridge University (Pike et al., Citation1975). In designing the kindergarten in Crosara, Los wanted to prove that architectural choices played a significant role in reducing the energy demands required for thermal comfort. The project was developed in collaboration with the architect Nathasha Finali Pulitzer.
As a consequence of the 1973 Oil Shock, which delayed the construction process, the energy-conscious strategies of the initial project were combined with the installation of a solar thermal system for heating to further reduce the building’s fossil fuel dependence. In the context of the environmental and energy crises, the passive and active heating systems installed in the kindergarten were meant to be learning or pedagogical tool for the younger generations who would occupy the building. The pupils could be directly involved in the management of simpler devices, such as child-scale windows. Furthermore, the mechanical heating system had colourful components, clearly identifiable within the building, to invite the children to learn about the system undergirding the building. The kindergarten opened in 1978, and its energy demands were monitored by the Italian National Research Council (Los & Pulitzer, Citation1980). The building was acknowledged as a pilot project of interest by the EU (De Santis, Citation2000) and included in the first survey of Italian bioclimatic passive solar buildings published by the Italian National Agency for New Technologies, Energy and Sustainable Economic Development (Funaro & D’Errico, Citation1992).
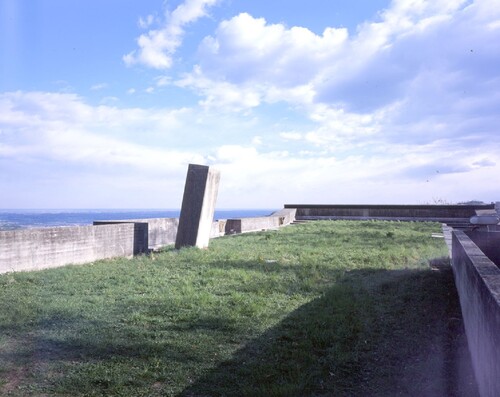
The kindergarten was designed to provide space for up to 60 pupils. The building is symmetrical in plan () and placed partially underground on a terrain with a natural slope of 15° to the south (). The main building access points are located at the northeastern and northwestern corners, on the upper level. The indoor space is arranged on two levels (∼1700 m3 and ∼670 m2) around a wide central staircase that provides access to a double-height area for indoor motor activities (∼30 m2) downstairs (). This area is connected to a double-height glazed winter garden (∼90 m2) (). Service rooms (∼48 m2), offices (∼80 m2), kitchens (∼40 m2) and technical compartments (∼60 m2) are placed on both levels at the northern, eastern, or western edges. The roof was realized originally as a garden to provide an outdoor playground ().
Figure 2. Plan of roof garden (top right), plan of the upper level (top left), west–east sections (bottom). Sergio Los and Natasha F. Pulitzer, Kindergarten, Crosara, Italy, 1972–78 (Source: Synergia Progetti archive: Sergio Los, Natasha F. Pulitzer).
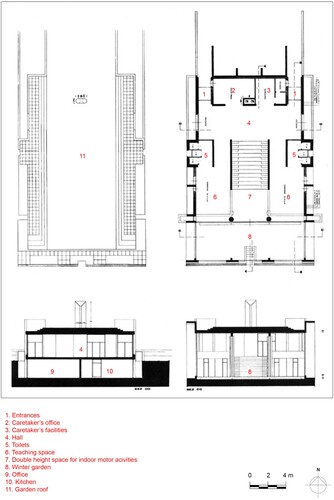
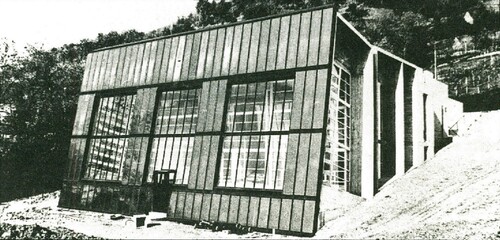
Figure 3. Eastern facade. Sergio Los and Natasha F. Pulitzer, Kindergarten, Crosara, Italy, 1972–78. (Source: Synergia Progetti archive: Sergio Los, Natasha F. Pulitzer).
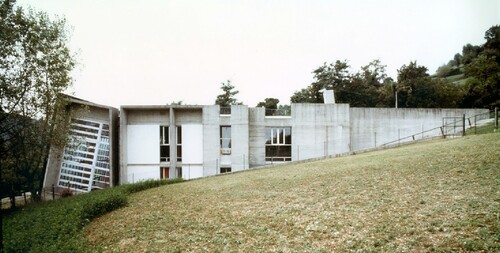
Figure 4. View of the central staircase, connecting the main entrance hall (on the upper level) to the double-height hall and the winter garden (on the lower level). Sergio Los and Natasha F. Pulitzer, Kindergarten, Crosara, Italy, 1972–78 (Source: Synergia Progetti archive: Sergio Los, Natasha F. Pulitzer).
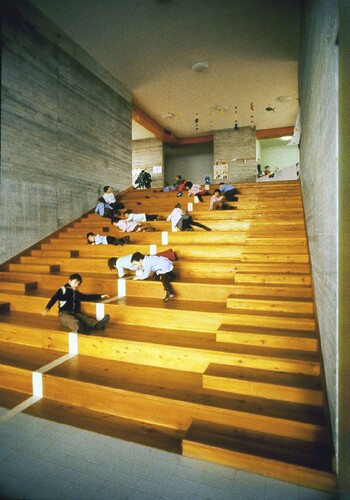
Figure 5. Indoor view of the winter garden, located in the southern part of the building. Sergio Los and Natasha F. Pulitzer, Kindergarten, Crosara, Italy, 1972–78 (Source: Synergia Progetti archive: Sergio Los, Natasha F. Pulitzer).
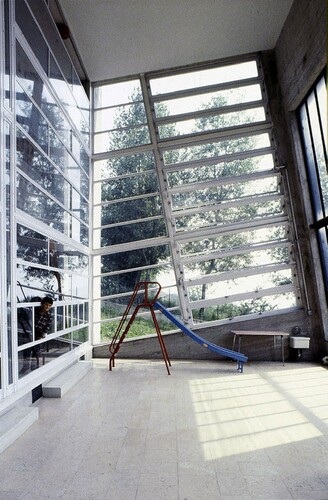
Figure 6. View from the rooftop garden towards the south. Sergio Los and Natasha F. Pulitzer, Kindergarten, Crosara, Italy, 1972–78 (Source: Synergia Progetti archive: Sergio Los, Natasha F. Pulitzer).
To limit the energy demands for thermal comfort in the kindergarten, Los manipulated the building orientation, underground walls, buffer volumes, thermal mass and shading devices (Hawkes & Owers, Citation1981). He structured the building to benefit from both underground construction and solar gains, embedding it in a south-sloping site. The northern façade is completely underground and half of the remaining volume of the structure is below ground, following the natural slope of the site. This reduces thermal energy losses on the northern, western and eastern sides of the building. The above-ground part of the building was designed to enhance winter passive solar gains: most of the windows are oriented towards the winter garden. Besides offering passive solar energy, this room provides a naturally temperate indoor space for activities in the cold season, acts as a buffer space to reduce thermal energy losses and activates the ‘natural convective loop’ – a passive solar system for heating, inspired by the work of Peter Van Dresser (Los & Pulitzer, Citation1977). Furthermore, the building is made of massive reinforced concrete elements and clay blocks to enhance its thermal inertia. To avoid cooling demands – which are limited because of the building’s geographical location – Los designed fixed overhangs to provide adequate shading in summer and placed side openings to ensure cross ventilation. The bioclimatic strategies he adopted to reduce energy demands for thermal comfort were combined with the use of the most advanced construction technologies for energy efficiency available at that time: glass wool insulation and perforated insulating clay blocks.
The kindergarten was equipped with a mechanical air heating system connected to two different heating systems: an oil boiler and a solar thermal system. The latter was powered by 106 m2 of solar thermal collectors () anchored to the concrete façade of the winter garden and inclined by 11°. The system transferred thermal energy to a water thermal accumulator (7500 L) (located in an underground room) to warm the air circulating in the heating system. When the thermal energy from the solar plant was insufficient to bring the air to the required temperature, the battery powered by the oil boiler was activated automatically to further warm the air (preheated with solar energy). The solar thermal system was also used to produce hot water from mid-April to mid-October. The collectors were installed to be removable without affecting the integrity of the façade and were equipped with insulation to reduce thermal losses through the panels when they were inactive.
Figure 7. View of the solar thermal collectors on the southern façade. Sergio Los and Natasha F. Pulitzer, Kindergarten, Crosara, Italy, 1972–78 (Source: Synergia Progetti archive: Sergio Los, Natasha F. Pulitzer).
Visits to the building in 2020 and 2021, revealed a few alterations to the original built structure. A layer of asphalt had been substituted for the green roof; the double-glazed, south-facing windows of the winter garden had been replaced with new double-glazed windows with the same surface area but a different frame design; and the winter garden had been equipped with additional devices for thermal comfort. These alterations suggest that the winter garden’s use may have been extended beyond the purposes of the original design. The original solar thermal collectors were found in place, but the architects have reported to the authors that the solar thermal system was no longer active at that time.
Results
U values of the construction elements
The quantified U values of the construction elements corresponding to the parts of the building were compared with representative values of the same geographical region in the 1970s (UNI TS, 11300-Citation1, Citation2008) and current Italian guidelines (D.M. Citation2015). This comparison () shows that the U values of the opaque elements of the building fabric (higher than the standards existing in 2021) were lower than the representative value of the time, whereas the U values of the windows were in line with the standards of the time. The U values of the opaque elements were reduced by the inclusion of a 3 cm-thick glass wool insulation layer and 12–24 cm-thick perforated insulating clay blocks combined with 8 cm-thick clay bricks (infill walls) or 24 cm-thick reinforced concrete elements (load-bearing walls). The windows (steel framed and double glazed) were the element which had the weakest thermal performance.
Table 2. Comparison between calculated U values for the kindergarten in Crosara, reference U values for buildings in the Veneto region (Italy) between 1970 and 1989 (UNI TS, 11300-Citation1, Citation2008) and minimum U values required for new buildings built in the same Italian climate zone after 2021 (D.M. 2015).
Thermal performance
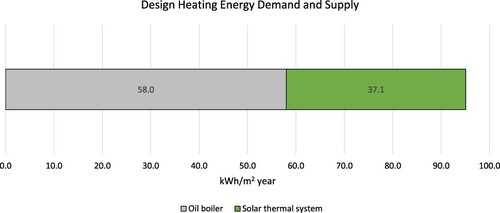
The comparison of the kindergarten’s predicted heating demand (95.1 kWh/m2 per year) (obtained by the designers by calculating the energy losses through the building fabric and ventilation, relative to the school’s annual hours of operation and the heating degree days for the geographical location) and the design performance of the solar thermal system (37.1 kWh/m2 per year) () showed that the oil boiler was expected to supply 58.0 kWh/m2 per year for indoor heating. The oil consumption measured in 1980 (retrieved in the archive of the architect) showed that the annual oil consumption for heating corresponded to 59 kWh/m2. A subsequent measurement found in the literature registered a slightly higher value: 63 kWh/m2 per year (Funaro & D’Errico, Citation1992). These measures proved that the real consumption of oil was close to the design values. Therefore, it is plausible that the solar thermal system performed as expected.
Figure 8. Energy demands of the kindergarten according to the design calculations and supply systems, based on the design performance of the thermal solar system (Data source: Synergia Archive: Sergio Los, Natasha F. Pulitzer).
The thermal efficiency of the building was quantified through a thermophysical calculation of its energy balance using Lesosai. The results showed that the kindergarten does not require mechanical systems for cooling, and the annual energy demand for heating is 98.8 kWh/m2. The calculation was performed according to the same standard (EN ISO 13790). Therefore, this value is comparable with the energy heating demands calculated for a representative school in the same Italian climate region, namely, 150.0 kWh/m2 (Corrado et al., Citation2016).
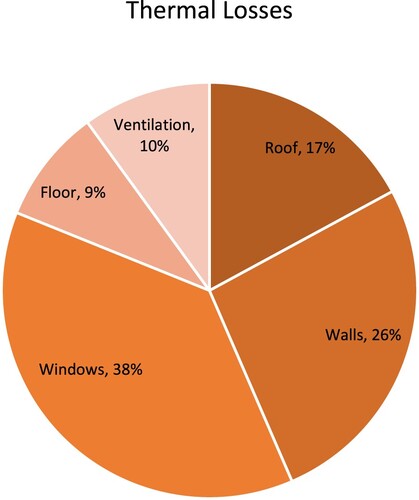
The energy balance produced quantitative data about the losses and inputs of thermal energy, including ventilation losses, internal gains and solar gains. The overview of the thermal losses () shows the impact of the different components of the building fabric (construction elements and design strategies). Even if the elements of the opaque building fabric (∼1070 m2) had lower U values than the standards of the time, only 59% of it (∼632 m2) is placed on the exterior, while 29% of it is underground (∼313 m2) and 12% is used in buffer spaces (∼127 m2). The windows are the weakest part of the building fabric; they have U values that are in line with the standards of that time. Only 35% of the windows (surface area ∼57 m2) are positioned towards the exterior, while the others (surface area ∼107 m2) are located between indoor spaces and the winter garden.
Figure 9. Thermal losses of the kindergarten by source using data from the thermophysical calculation of the energy balance.
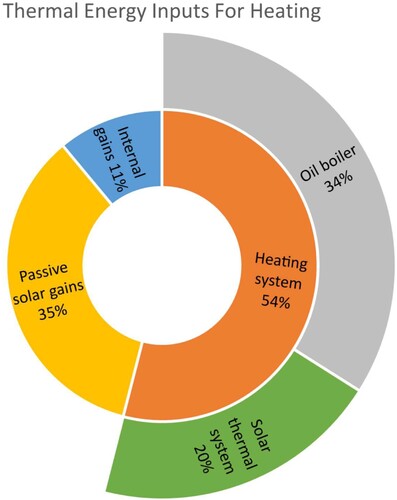
The overview of the thermal inputs () shows that solar gains from the windows provide 35% of the energy input for heating. The least favourable recorded consumption measure (showing that the oil boiler supplied 63 kWh/m2 per year for heating) differentiated the thermal inputs of the two heating sources: 34% of the energy input was provided by the oil boiler and 20% by the solar thermal system. These results show that 55% of the heating demand was met by solar energy.
Figure 10. The kindergarten’s energy inputs by source: data from the thermophysical calculation of the energy balance (inner ring) and the thermal energy supplied by the two heating systems based on the oil boiler consumption data (outer ring) (Funaro & D’Errico, Citation1992).
Assessment of the functioning of the natural convective loop system
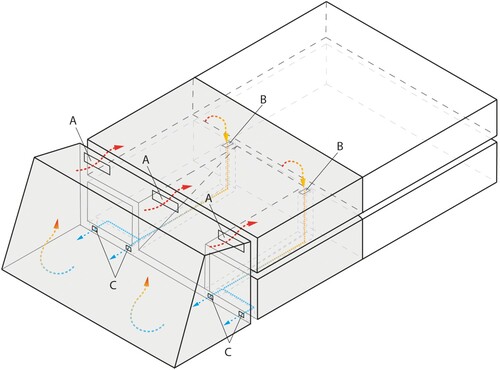
The natural convective loop allows the warm air from the winter garden to move toward and mix with the air in the rooms at zero energy cost when the air temperature in the winter garden is higher. Its operation is described using arrows in : three bottom-hung windows (A) in the upper part of the glazed curtain wall between the two thermal zones allow warm air to enter the conditioned volume (undulating arrows). The air from the winter garden circulates in the main space of the school and is later collected by two inlets (B) located at floor level on the upper floor (arrows pointing downwards). The air then circulates downwards into two vertical ducts and is channelled underneath the ground floor pavement, where it circulates through a gravel bedding. It returns at a lower temperature (horizontal arrows) to the winter garden through four outlets (C) located underneath the curtain wall. Here the air is warmed again by solar radiation and moves upwards as it expands (arrows pointing upwards). The convective loop can be interrupted when heating is not required by closing the windows between the greenhouse and the heated area or the outlets located in the solar greenhouse.
Figure 11. Scheme of the kindergarten. The portion of the building involved in the natural air circulation flux activated by the passive solar system is shown in grey: (A) windows (240 by 60 cm) in the upper part of glazed curtain wall between the two thermal zones, (B) inlets (35 by 15 cm) at the bottom of the upper floor, (C) outlets (25 by 10 cm) located underneath the curtain wall.
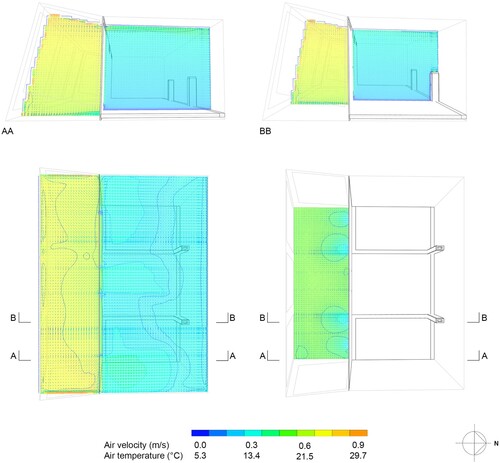
The results of the CFD analysis (performed with the software IES VE) for the portion of the building involved with the air circulation system were calculated in free-floating conditions for an average sunny winter day (identified as January 24th) at 14:00 when the outdoor dry bulb temperature was 13.8°C. The average indoor surface temperature of the envelope elements was 15°C in the winter garden and 11°C in the kindergarten rooms. The velocity and temperature of the air circulating through the openings are shown in the vertical and horizontal sections ().
Figure 12. Images from the CFD analysis representing the velocity vector, velocity contour and filled temperature contour: vertical section AA through one upper window and one lower outlet, showing the air passing from the winter garden to the heated space and the air brought back to the winter garden at the ground floor level (top left); vertical section BB through one of the floor inlets in the upper floor showing the air collected from the heated space (top right); horizontal section through the upper windows showing the air passing from the winter garden to the heated space (bottom left); horizontal section through the lower outlets showing the air brought back to the winter garden at the ground floor level (bottom right).
Carbon emission corresponding to heating demand
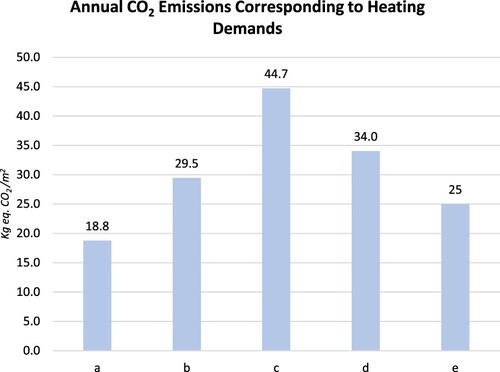
Given that the benefits of the natural convective loop have not been quantified in this study, comparative analyses of specific CO2 emissions (corresponding to energy demands for thermal comfort) () were performed for the following cases:
the oil corresponding to the thermal energy for heating supplied by the kindergarten’s oil boiler, measured when the solar thermal system was active (Funaro & D’Errico, Citation1992)
the oil needed to cover the entire heating demand of the kindergarten, calculated using Lesosai
the oil corresponding to the calculated heating demand of a representative school in the same Italian climate zone, calculated from available data (Corrado et al., Citation2016)
a comparative case, representing the impact of the thermal solar system installed in Crosara in the representative school, calculated by subtracting the difference between (b) and (a) from (c)
the latest available (2008) European average value of specific CO2 emissions for space heating (EEA, Citation2012)
Figure 13. CO2 emissions from heating (a) the kindergarten of Crosara with a functioning thermal solar system, using measured data (Funaro & D’Errico, Citation1992); (b) the kindergarten of Crosara without a thermal solar system, using calculated data; (c) a representative school in the same climate zone, using data calculated from available data (Corrado et al., Citation2016); (d) a comparative scenario, using the calculated heating demand of case (c), minus the final energy provided for heating by the thermal solar system of the kindergarten in Crosara (calculated subtracting (a) from (b)); (e) the EU 2008 average (EEA, Citation2012).
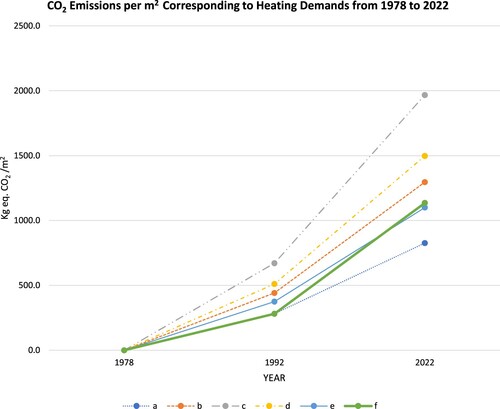
The comparative analysis of carbon emissions was extended and evaluated over time to compare hypothetically the CO2 emissions for the various cases from the opening of the building in 1978 to 2022 (). This comparison includes case (f), which represents the CO2 emissions of the kindergarten if we assume that the solar system was only active until 1992 (the year when the most recent monitoring data were published).
Figure 14. Calculated CO2 emissions from heating between 1978 and 2022 for (a) the kindergarten of Crosara with a functioning thermal solar system, using measured data (Funaro & D’Errico, Citation1992); (b) the kindergarten of Crosara without the thermal solar system, using calculated data; (c) a representative school in the same climate zone, using data calculated from available data (Corrado et al., Citation2016); (d) a comparative scenario, using the calculated heating demand of case (c), minus the final energy provided for heating by the thermal solar system of the kindergarten in Crosara (calculated subtracting (a) from (b)) (e) the EU 2008 average (EEA, Citation2012); (f) an assumed scenario of the kindergarten of Crosara with the de-activated solar thermal system after 1992, using measured data until 1992, and then calculated data.
Limitations
Several limitations apply to this research. The study considers the original configuration and use of the building. A comparative analysis was performed using the most conservative monitoring data available from the building when it was in its original state. This analysis provided measured heating demands. These data were also used to calibrate the simulation model. Given that data about the original occupancy profile were unavailable, standard coefficients from EN ISO 13790 were used for the internal gains and ventilation included in the thermophysical calculation. This standard was selected to facilitate the comparative analysis because it matched the available data for a representative school in the same Italian climate zone (Corrado et al., Citation2016). The representative school was a high school, so all comparisons with the case study were performed with the data obtained from standard evaluations that were conducted according to EN ISO 13790, comparing only data per square metre. Monitoring data that could allow an assessment of the performance of the natural convective loop have not been found, and this study was not detailed enough to quantify the actual heating contributions of this passive system; rather, it could only assess its functioning. Also, it was not possible to verify the functioning of the thermal system over the last decades. Therefore, it was considered operative for the purpose of the carbon emission evaluations only until 1992 when the last measured performance data for the building with the solar-energy system in operation were published.
Discussion
Despite the limitations, the quantitative analysis of the kindergarten’s thermal performance facilitated an understanding of the energy-conscious design strategies that were used to reduce energy demands for thermal comfort. The results show that these strategies eliminated cooling demands and reduced heating demands; the latter were two-thirds of those calculated for a representative school in the same Italian climate zone (Corrado et al., Citation2016). Given this reassessment, the effectiveness and the limits of the design strategies used in the building can be discussed using current evaluation methods. The thermal balance showed that the kindergarten’s energy demands for thermal comfort were significantly reduced by the following energy-conscious architectural design choices:
the placement of half of the building underground
the addition of buffer rooms
the inclusion of a winter garden
the differentiation of the elements of the building fabric and construction specifications relative to the building’s orientation and spatial organization
The assessment of the natural convective loop proved that it could reduce heating energy demands. The benefits of this system lie in its durability and its carbon neutrality.
The comparative analysis of carbon emissions (an evaluation factor not considered in the existing documentation of the kindergarten) was crucial for understanding the legacy of this pioneering energy-efficient building relative to the goal set out in the European Green Deal of reaching carbon neutrality by 2050. The carbon footprint for heating in the original design is lower than the 2008 average European value (EEA, Citation2012). The comparison of its specific carbon emissions for heating with those corresponding to the calculated heating demand of a representative school of the same Italian climate zone (Corrado et al., Citation2016) showed that the kindergarten’s CO2 emissions were lower than those of the representative school due to lower heating demand (which reduced emissions by 34%) and were further reduced by the inclusion of renewable energy systems (which reduced emissions by 24%). The carbon reduction achieved through architectural design choices is important, considering that the European Commission has adopted a set of proposals intended to reduce net greenhouse gas emissions in the EU by at least 55% by 2030, compared to 1990 levels (EC, Citation2019). The CO2 emissions for heating from the opening of the kindergarten in 1978 until 2022 were an estimated 42% lower than the representative school’s emissions over the same period (even assuming that the thermal solar system was only active until 1992).
The results show clearly that the energy efficiency of the building considered in this case study depended mainly on the architectural design strategies. First, the architect limited the kindergarten’s heating demands through the organization of spaces and by using passive solar systems. Second, he enhanced the thermal performance of the building by choosing the most energy-efficient construction elements available at that time. Finally, he reduced its oil dependency by including a solar thermal system. This is because the limitations of the mechanical building systems and construction materials available in the 1970s motivated Sergio Los to rely more on passive architectural design solutions to reduce energy demands. The results demonstrate the extent to which designers (even those provided with more advanced energy-efficient construction technologies than those available to Los) could reduce carbon emissions by shaping their design choices around energy consciousness. It is essential that they do so given the current environmental crisis and the mandate to achieve NZEB standards (Jaysawal et al., Citation2022).
Conclusion
This study concludes that energy-efficient experimental buildings from the 1970s can be useful quantitative references for architects committed to sustainability. The energy efficiency reassessment of the kindergarten in Crosara shows the overwhelmingly positive impact of energy-conscious architectural strategies on heating and cooling energy demands. The analysis of the original building’s thermal performance using current software tools for sustainable design quantified the contribution of the different strategies to the control of carbon emissions. The reassessment of this project has proved that architectural design strategies – including the organization of spaces, the inclusion of passive solar-energy systems and the building’s orientation, layout and fabric – greatly contributed to the structure’s energy and emissions performance. The evaluation of the impact of these strategies on carbon emissions over time highlights the importance of architectural design to sustainability.
This study also demonstrates that the reassessment of surviving, pioneering, energy-efficient buildings using current software tools could be useful in architectural education and practice. Such reassessments could suggest improvements to contemporary energy strategies and the development of new strategies. Further research that incorporates changes in occupancy should be conducted on the performance of pioneering energy-efficient buildings such as the kindergarten in Crosara as user behaviour is a primary limitation of bioclimatic passive design (Venturi et al., Citation2023). This study demonstrates that monitoring energy use is an important tool for assessing and optimizing energy consumption during the life cycle.
Data availability statement
Data sharing is not applicable to this article.
Acknowledgements
Archive material by courtesy of Synergia Progetti (Sergio Los and Natasha Finali Pulitzer). The authors thank Sergio Los and Natasha Finali Pulitzer for access to their archive and assistance during the research. The case study of the research presented in this paper has been analysed in the context of a PhD research project carried out by Elena Poma under the supervision of Prof. Franz Graf at Università della Svizzera italiana, Accademia di architettura.
Disclosure statement
No potential conflict of interest was reported by the author(s).
Additional information
Funding
References
- Achard, P., & Gicquel, R. (1986). European passive solar handbook: Preliminary edition: Basic principles and concepts for passive solar architecture. OPOCE.
- Ballarini, I., Costantino, A., Fabrizio, E., & Corrado, V. (2019, Sept 2–4 ). The dynamic model of EN ISO 52016-1 for the energy assessment of buildings compared to simplified and detailed simulation methods. Proceedings of the 16th IBPSA Conference (pp. 3847–3854), Rome, Italy. https://doi.org/10.26868/25222708.2019.210431
- Banham, R. (1967). Frank Lloyd Wright as environmentalist. Architectural Design, (April), 174–177.
- Barber, D. A. (2016). A house in the sun : Modern architecture and solar energy in the Cold War. Oxford University Press.
- Borasi, G., Zardini, M., Bobbette, A., & Russell, H. & Centre canadien d’architecture. (2007). In G. Borasi & M. Zardini (Eds.), Sorry, out of gas : Architecture’s response to the 1973 oil crisis. Canadian Centre for Architecture - Corraini.
- Bushra, N. (2022). A comprehensive analysis of parametric design approaches for solar integration with buildings: A literature review. Renewable and Sustainable Energy Reviews, 168, 112849. https://doi.org/10.1016/j.rser.2022.112849
- Corrado, V., Politecnico di, T., Ballarini, I., Politecnico di, T., Paduos, S., Politecnico di, T., Tulipano, L., Politecnico di, T., & Signoretti, P. (ENEA) (2016). Report Ricerca di Sistema Elettrico. Riqualificazione energetica degli edifici pubblici esistenti: direzione nZEB Studio dell’edificio scolastico di riferimento nel Nord Italia (zona climatica E: 2.100 <GG ≤ 3.000). https://www.enea.it/it/Ricerca_sviluppo/documenti/ricerca-di-sistema-elettrico/adp-mise-enea-2015-2017/edifici-nzeb/rds_par2015-120.pdf
- Decreto Interministeriale 26 Giugno 2015. (2015). Applicazione delle metodologie di calcolo delle prestazioni energetiche e definizione delle prescrizioni e dei requisiti minimi degli edifici.
- De Santis, M. (2000). Sergio Los: Un approccio sostenibile all’architettura. In C. Monti (Ed.), Costruire sostenibile (pp. 222–231). Alinea.
- EC. (2019). A European Green Deal. https://commission.europa.eu/strategy-and-policy/priorities-2019-2024/european-green-deal_en
- EC. (2020). In focus: Energy efficiency in buildings. https://commission.europa.eu/news/focus-energy-efficiency-buildings-2020-02-17_en
- EC. (2022). Heating and cooling. https://energy.ec.europa.eu/topics/energy-efficiency/heating-and-cooling_en#eu-heating-and-cooling-strategy
- EEA. (2012). CO2 emissions per m2 for space heating. https://www.eea.europa.eu/data-and-maps/figures/co2-emissions-per-m2-for-1
- EN 15603. (2008). Energy performance of buildings – Overall energy use and definition of energy ratings.
- EN ISO 13790. (2008). Energy performance of buildings.
- Eurostat. (2022). Energy statistics – an overview. https://ec.europa.eu/eurostat/statistics-explained/index.php?title = Energy_statistics_-_an_overview#Final_energy_consumption
- Funaro, G., & D’Errico, E. (1992). Edilizia bioclimatica in italia : 151 edifici solari passivi. ENEA. Area energetica, Dipartimento diffusione risparmio energetico.
- Gagliano, A., Nocera, F., Patania, F., Moschella, A., Detommaso, M., & Evola, G. (2016). Synergic effects of thermal mass and natural ventilation on the thermal behaviour of traditional massive buildings. International Journal of Sustainable Energy, 35(5), 411–428. https://doi.org/10.1080/14786451.2014.910517
- Galiano-Garrigós, A., Marcos, C. L., Kouider, T., & Gutiérrez, P. J. J. (2022). Reassessing thermal comfort in modern architecture: E.1027 as a case study. Building Research & Information, 50(1–2), 230–254. https://doi.org/10.1080/09613218.2021.1971060
- Hawkes, D., & Owers, J. (1981). The architecture of energy. Construction Press.
- Jaysawal, R. K., Chakraborty, S., Elangovan, D., & Padmanaban, S. (2022). Concept of net zero energy buildings (NZEB) – A literature review. Cleaner Engineering and Technology, 11, 100582. https://doi.org/10.1016/j.clet.2022.100582
- Ji, Y., Lee, A., & Fernando, T. (2020). Dynamic thermal simulation of advanced natural ventilation in buildings: Current and future usage. UK exemplar. Architectural Engineering and Design Management, 16(4), 293–309. https://doi.org/10.1080/17452007.2019.1693334
- Kallipoliti, L. (2010). The Soft Cosmos of AD’s ‘Cosmorama’ in the 1960s and 1970s. Architectural Design, 80(December/November), 34–43. https://doi.org/10.1002/ad.1160
- Keller, R. L., Muir, K., Roth, F., Jattke, M., & Stucki, M. (2021). From bandages to buildings: Identifying the environmental hotspots of hospitals. Journal of Cleaner Production, 319, 128479. https://doi.org/10.1016/j.jclepro.2021.128479
- Legge 373. (1976). Norme per il contenimento del consumo energetico per usi termici negli edifici.
- Ligardo-Herrera, I., Quintana-Gallardo, A., Stascheit, C. W., & Gómez-Navarro, T. (2022). Make your home carbon-free. An open access planning tool to calculate energy-related carbon emissions in districts and dwellings. Energy Reports, 8, 11404–11415. https://doi.org/10.1016/j.egyr.2022.08.263
- Lopez, F. (2021). Dreams of disconnection : From the autonomous house to self-sufficient territories. In Dreams of disconnection from the autonomous house to self-sufficient territories. Manchester University Press.
- Los, S. (1981). Gestione di un edificio solare. La scuola di Crosara. ENERGIE ALTERNATIVE Habitat Territorio Energia, 9, 35–47.
- Los, S., & Pulitzer, N. (1977). L’architettura della evoluzione : il sistema abitazione dall’industrializzazione edilizia alle tecnologie alternative. Parma.
- Los, S., & Pulitzer, N. (1980, October 19–26). An Italian experience on bioclimatic design. In R. Hayes, John, Snyder (Ed.), Proceedings of the 5th National Passive Solar Conference, Amherst, MA, (pp. 1347–1356). Solar Energy Research Institute, University of Delaware
- Maniaque, C. (2014). Go West! Des architectes au pays de la contre-culture. Parenthèses.
- Mannell, S. (2018). ‘Living lightly on the earth’ : Building an Ark for Prince Edward Island, 1974-76. Dalhousie Architectural Press.
- Naik, N. S., Elzeyadi, I., Minson, C. T., & Lee, J.-H. (2021). Thermal pleasure inside solar screened spaces: An experimental study to explore alliesthesia in architecture. Building Research & Information, 49(7), 795–812. https://doi.org/10.1080/09613218.2021.1934377
- Pike, A., Thring, J., Smith, G., Littler, J., Freeman, C., & Thomas, R. (1975). The autonomous housing research programme. Energy and Housing, 119–132. https://doi.org/10.1016/B978-0-08-018968-0.50014-8. Pergamon.
- Requena-Ruiz, I. (2016). Building artificial climates. Thermal control and comfort in modern architecture (1930-1960) La fabrique des climats artificiels. Régulation thermique et confort dans l’architecture moderne (1930-1960). Ambiances, 2, 0–21. https://doi.org/10.4000/ambiances.801
- Sadler, S. (2006). Drop city revisited. Journal of Architectural Education (1984-), 59(3), 5–14. https://doi.org/10.1111/j.1531-314X.2006.00029.x. http://www.jstor.org/stable/40480641
- Sadler, S. (2008). An architecture of the whole. Journal of Architectural Education, 61(4), 108–129. https://doi.org/10.1111/j.1531-314X.2008.00194.x
- UNI TS 11300-1. (2008). Prestazioni energetiche degli edifici.
- Venturi, E., Ochs, F., & Dermentzis, G. (2023). Identifying the influence of user behaviour on building energy consumption based on model-based analysis of in-situ monitoring data. Journal of Building Engineering, 64, 105717. https://doi.org/10.1016/j.jobe.2022.105717