
ABSTRACT
Amidst rising ambient temperatures and frequent heatwaves, assessing summer indoor overheating is crucial. This study examined overheating in over 6000 apartments to show the temporal aspects of indoor overheating during the hot summer of 2021 compared to the average summer of 2020 in the Helsinki region of Finland, with additional consideration of the apartments’ design year, size, and number of rooms. Data analysis was conducted employing ANOVA and post hoc tests to assess the impact of apartment characteristics on overheating. Finnish building codes and health-related regulations defined three temperature thresholds to determine overheating: 27°C, 30°C, and 32°C. The findings indicated that during the summer of 2020, 76%, 8%, and 1% of apartments exceeded 27°C, 30°C, and 32°C, respectively. In the hot summer of 2021, these proportions increased significantly to 96%, 32%, and 4%. The average number of degree hours above 27°C in 2021 was three times higher than in 2020. While nighttime temperatures were slightly lower, there was a considerable number of degree hours above 27°C. Smaller apartments exhibited a higher risk of overheating. Those constructed after 2012 demonstrated lower overheating risks during the hot summer.
Introduction
Anthropogenic emissions of greenhouse gases into the atmosphere are increasing the global mean temperature (IPCC Citation2021: Masson-Delmotte et al., Citation2021). In Finland, a cold-climate northern country, this warming trend is around two times higher than the global temperature increase (Mikkonen et al., Citation2015). Additionally, global warming is associated with extreme temperatures as the four longest recorded heatwaves in Finland occurred in 2010, 2014, 2018, and 2021 (Finnish Meteorological Institute (FMI), Citation2021). Projections under Representative Concentration Pathway (RCP) 4.5 showed an increase in the frequency, intensity, and duration of heatwaves (Kim et al., Citation2018). The effects of heatwaves can cause lung malfunctions and blood flow disorders in the human body, cardiovascular diseases, and an increase in population mortality (He et al., Citation2019). In Finland, the premature mortality rate increased among the elderly during heatwaves (Kollanus et al., Citation2021). Because of climate change and its associated heatwaves, indoor overheating is supposed to increase during hot summers and can threaten occupants’ wellbeing. These risks are higher in residential buildings in Nordic countries since they are typically not equipped with cooling systems.
Due to the health risks, it is crucially essential to investigate the resilience of the existing building stock to heatwaves. Therefore, this paper explores overheating risks in more than 6000 apartments of different sizes and ages, through hourly data of field measurements and comparing the results of one average summer and one hot summer in the Nordic climate. The aim is to demonstrate overheating levels that can be experienced already in the current climate, depending on the age and size of the apartments in the cold climates. With the analysis of this large diverse field data, the resilience of the existing building stock to heatwaves is investigated with consideration of the effects of changes in national building codes and regulations.
Literature review
Overheating assessment criteria
Overheating definition methods
There is still a lot of debate about which metrics are best suited to define overheating and whether it is better to use a single-temperature exceedance approach or adaptive comfort standards (Mulville & Stravoravdis, Citation2016). There are different methods and metrics globally trying to define summertime overheating. For example, the latest CIBSE 59 suggests two overheating thresholds for homes: an adaptive overheating threshold based on the adaptive thermal comfort with an hour of exceedance limit at 3% of the occupied hour from May to September and a static 26°C for night-time occupancy in bedrooms with an hour of exceedance limit at 1% of the annual hours between 10 pm and 7 am (The Chartered Institution of Building Services Engineers & TM52., Citation2017). The Passive House Planning Package (PHPP) includes a summer overheating criterion that requires that indoor temperatures do not exceed 25°C for more than 10% of the year (The Passivhaus Trust, Citation2023).
Overheating criteria in the Nordic countries building codes
In Nordic countries, the national regulations set the criteria, which are mostly a single-temperature exceedance. The Danish Code for Indoor Thermal Climate (DS 474) requires a maximum of 100 h exceeding 26°C and not more than 25 h above 27 °C for the design phase of new dwellings based on simulation results (Kunkel et al., Citation2015). The Swedish Building Code sets minimum room temperatures but not maximum room air temperatures (Kunkel et al., Citation2015). The percentage of hours that exceed the outdoor temperature is used to address overheating in Norway (Attia et al., Citation2023). In Finland, the Ministry of Environment requires a maximum of 150 degree hours (Kh) above 27°C during summer for the design phase of new apartment buildings based on simulation results with Test Reference Year (TRY) 2012 (Ministry of Environment, Citation2018). Moreover, there are two indoor temperature limits of 30°C and 32°C for healthy adults and elderly people, respectively, required by the Finnish Ministry of Social Affairs and Health (Ministry of Social Affairs and Health, Citation2015).
Field studies addressing overheating in residential buildings
The field study has been an important approach in investigating overheating risk in the current climate, many of which have been done in the UK. In one of the most recent ones, air temperatures were monitored in the living rooms and main bedrooms of 750 homes across England during the hot summer of 2018. The result showed that flats suffered significant overheating during the hot summer of 2018. A total of 19% of the bedrooms and 15% of the living rooms out of the national stock were overheated. This shows that bedrooms are at a higher risk of overheating than living rooms (Lomas et al., Citation2021). Higher overheating risk in bedrooms is confirmed by another study in London (Pathan et al., Citation2017) in which 122 dwellings were monitored during the summers of 2010 and 2011. It was found that 29% of all living rooms and 31% of all bedrooms had more than 1% of summertime outside the comfort zone recommended by the Ashrae 55 standard (American Society of Heating Refrigerating and Air-Conditioning Engineers, Citation2020). The higher overheating risk in bedrooms is important for sleep quality and therefore productivity of the next day. Moreover, a field study of English homes during the summers of 2014 and 2015 showed that overheating occurred more in households with vulnerable occupants (Vellei et al., Citation2017). A study on overheating risk in four flats during one month in the summer of 2017 found that overheating in new houses is a current issue and should be considered in the design phase (Gupta & Gregg, Citation2020). Investigating the overheating risk in 207 English dwellings showed that detached homes and flats built before 1919 were much cooler than those of other types and ages. The newer flats (built after 1990) had warmer bedrooms and living rooms than other types during the cool summer of 2007 (Beizaee et al., Citation2013). Another study (Mavrogianni et al., Citation2017) assessed overheating in 101 dwellings in London during the summer of 2009 through indoor temperature monitoring and an occupants’ behaviour survey. The results indicated that London homes are already at risk of overheating under the current climate and 70% of respondents tended to open only one or no windows to prevent overheating. However, it was found in another study that occupants’ actions can prevent overheating in the flats through a field study in 18 flats in the UK during two summers (Baborska-Narożny et al., Citation2017).
Along with studies in the UK, the overheating risk was investigated during eight summers from 2011 to 2018 in Adelaide in 8 energy-efficient multi-level houses. The results showed that low-performance energy-efficient houses were about twice as often overheated as high-performance energy-efficient houses (Sharifi et al., Citation2019). In a study in New Zealand, the overheating risk was assessed during 4 seasons in 3 houses. Based on the results, overheating can be extreme and long-lasting. The results showed that the indoor temperature was over 28°C 31% of the time and over 25°C 52% of the time (Birchmore et al., Citation2017). In New York City, indoor air temperature and relative humidity were measured in 327 dwellings for the years 2008–2011 for 5–14 days. Based on the results, the indoor temperature during the warm season was modelled with the outdoor temperature, the number of rooms in the dwelling, and whether water damage was reported. Apartment buildings were significantly warmer than houses, and dwellings on upper floors were warmer than dwellings on lower floors (Tamerius et al., Citation2013).
A few studies focus on the overheating risk through field measurements in residential buildings in cold climates. One of them proposed a methodology to define overheating in residential buildings based on heat-related health outcomes (Laouadi et al., Citation2020). In Estonia, 100 old and new apartments were monitored during the summers of 2008 and 2011. The results showed that the overheating risk is higher in modern apartments than in old ones. The average temperature in modern apartments was approximately 1°C. higher than in the old ones (Maivel et al., Citation2015). Another study in Greenland investigated overheating risks in the bedrooms of 79 dwellings in one month in the summer of 2011. The results showed that 19% of all bedroom temperatures were above 26°C, while the average outside temperature measurements during summer were 9.5°C, which is relatively low (Kotol et al., Citation2014). An overview of the studies with the field measurements is summarized in .
Table 1. Summary of the literature review on the overheating risk through field measurements.
Simulation studies addressing overheating in residential buildings
Simulation methods have been used to investigate overheating risk in residential buildings under the effects of climate change, most of which rely on building performance simulations in different climatic contexts (Barbosa et al., Citation2015; Kalvelage et al., Citation2014; Ramallo-González et al., Citation2020; Salthammer et al., Citation2018). Furthermore, simulation studies have been done to examine different climate change adaption strategies in different countries (Attia & Gobin, Citation2020; Lee & Steemers, Citation2017; Tillson et al., Citation2013; van Hooff et al., Citation2014; Zhou et al., Citation2020).
However, only a few of these studies are done in the cold climate of Nordic countries. In Sweden, a study showed that the overheating risk increases significantly with the future climate scenarios in residential buildings, and passive measures become more important under the changing climate (Dodoo & Gustavsson, Citation2016). Another study in Finland showed that even in the current climate, the risk of overheating is high in old and new apartment buildings, and it will increase in future climates and their associated heatwaves (Farahani et al., Citation2021). Another study in Norway showed that there is a risk of overheating in typical Norwegian residential buildings with future climate scenarios using two different overheating evaluation criteria, the PHPP and the adaptive method (CIBSE). Based on the results, the PHPP method is not very precise in evaluating the specific overheating risk in bedrooms since all hourly indoor temperatures based on an annual basis are considered in the PHPP method, and there are many hours with high temperatures during the daytime in the summer seasons when the bedrooms are not occupied. Therefore, the CIBSE method is recommended for evaluating the overheating risk in single rooms in residential buildings (Tian et al., Citation2020).
The literature gap
Simulation studies are useful for estimating the impact of climate change on indoor temperatures in residential buildings, but they cannot fully replicate the insights provided by actual field measurements. While there is already a significant body of literature on field studies examining the risk of overheating in residential buildings, there is still a need for more research in cold climates to investigate the effects of hot summers on overheating in existing buildings. This research gap in field measurements is summarized as follows:
Different summers were investigated for the risk of overheating in residential buildings in previous studies. However, the comparison of the overheating risk during average and hot summers is not reported.
Previous studies have investigated overheating risks in different numbers of residential dwellings. However, these numbers do not exceed 1,000. Thus, there is a need for an analysis of a larger number of dwellings to investigate more precisely the effects of apartment size and construction year on overheating.
The analyses are mostly done for a short period (1 week to 1 month in summer), including or not including heatwaves. On the other hand, in some of the studies, these periods are not the same for all of the studied buildings. Thus, a thorough analysis that considers the whole summer appears to be necessary.
Most field studies are done in the UK. Thus, investigating the overheating risk through field measurements in existing residential buildings in cold climates needs more work.
This paper provides a novel contribution by addressing the gaps in the literature analyzing overheating risks using a large field dataset of over 6000 different apartments for two average and hot summers in the Nordic countries, which are known for their cold climate.
Materials and methods
Data collection
Apartment building stock and field measurement process
The dataset for room air temperatures was obtained from field measurements conducted in apartments in the Helsinki region, Finland (). The raw data consisted of 10,648 apartments measured in 2020 and 10,597 apartments in 2021. These apartments were constructed between 1902 and 2016 and were located in different cities, namely Helsinki, Vantaa, Espoo, Järvenpää, Kerava, and Tuusula. The area of these apartments varied from 20 to 232 m2. Given the wide age and size range of the apartments included in the dataset, it is likely to serve as a comprehensive representation of the typical Finnish apartment building stock in Finland's south coast region (City of Helsinki, Citation2022).
Figure 1. The cities in the Helsinki Region [43].
![Figure 1. The cities in the Helsinki Region [43].](/cms/asset/de762ccf-43d5-4c61-b408-c72934331d58/rbri_a_2253338_f0001_oc.jpg)
The data was obtained from the IoT temperature sensors installed by professionals to monitor the indoor conditions throughout the buildings’ lifespan. The sensors can measure temperatures in the range of −40 to +60 °C with an accuracy of ±0.2°C. An IoT temperature sensor was installed in each apartment's corridor. The apartments had mechanical ventilation, and the airflow from the bedrooms and living room was transferred to the exhaust valves of the kitchen and toilet through the corridor. Thus, the measured data could indicate well the average temperature of the apartments. Additionally, the location of the sensors had been chosen so that they were not exposed to direct sunlight.
The measurements were done in one-hour intervals from mid-May to the end of August in 2020 and 2021 as representatives of the average and hot summers of the Helsinki region’s climate. Short heatwaves can happen in the early summer in Finland, e.g. the hot summer of 2018 (Finnish Meteorological Institute (FMI), Citation2023). That is why the period of May 15–31 was considered summertime in this study .
Preprocessing of the raw data
Python programming in Jupiter Notebook was used to perform data analysis. The raw data underwent a data cleaning process that adhered to three principles aimed at enhancing the overall data quality: (1) Apartments with over 15% missing data for the entire measurement period (mid-May to the end of August) in each year were excluded from the analysis. (2) Apartments with more than three hours of consecutive missing data were eliminated for both years. (3) Apartments with temperatures above 40°C or below 18°C were investigated and filtered out.
Applying these filtering criteria ensured a reliable and accurate dataset, avoiding interference from faulty devices or unoccupied apartments during analysis. Subsequently, the remaining data were processed using linear interpolation to obtain cleaned hourly data for each apartment in the selected period from May 15 to August 31 for each year.
Cleaned dataset description
After the pre-processing, the cleaned dataset consisted of 578 buildings in the summer of 2020 and 560 buildings in the summer of 2021. There were one to several apartments in each building, resulting in 6974 apartments with hourly data from May 15 to August 31, 2020, and 6057 apartments from a similar period in 2021.
All apartments had mechanical ventilation systems. There were no permanently installed cooling devices in the measured apartments. However, there may have been portable cooling devices in the apartments, and occupants may have used openable windows. The only known characteristics of the apartments were the commissioning year of the buildings, the location of the buildings, and the area and number of rooms in the apartments, while the shading and orientation of buildings, exact characteristics of the building envelope, green view effects, etc., were difficult to collect. Moreover, detailed information on the occupants’ behaviour (e.g. opening windows and possible local cooling devices installed) for the large dataset of more than 6000 apartments was not possible to obtain.
To ensure the relevance and reliability of the study, three key approaches were employed to investigate the extent of overheating in apartments during average and hot summers:
The results for two different summers with the same apartments and locations were compared. This way, the increase in overheating is defined in the hot summer compared to the average summer, and the effects of unknown parameters are reduced.
The outliers (apartments with any recorded temperature higher than 40°C and lower than 18°C) were filtered out. In this way, the effects of IoT sensors malfunctioning, high solar radiation on the sensors, and apartments with no occupants were filtered out.
The occurrence and magnitude of overheating were analyzed.
The analyzed apartments were different in age. The commissioning years of the buildings were known, and the design years were calculated using a typical time delay between the design and construction of the buildings in Finland. In this study, a time lag of 3 years between the design and occupied buildings was used based on the information provided by the building companies. The buildings were clustered into five different age categories based on Finnish building code requirement changes. This way, the possible effects of building codes’ requirements on the envelope, windows, and ventilation on overheating risks were considered. The group before 1977 represents a period when there was no building code or any requirements for energy efficiency (Lestinen, Citation2018). The first building code came into force in 1977 and set regulations for U-values of the building envelope (C Citation1–Citation4 National building code of Finland, Citation1976). In 2003, the regulations for window U-values changed, along with a new demand for heat recovery for ventilation (D2 National Building Code of Finland. Indoor Climate and Ventilation of Buildings, Citation2003; Decree of Ministry of the Environment Finland, Citation2002). The U-value requirements of the windows were reduced from 2.1 to 1.4 W/m2 K in 2003. Thus, the required windows, which had been with 2 or 3 panes of clear glazing before 2003, changed to windows with gas-filled low emissivity glazing after 2003, which decreases solar heat gains. Moreover, the mechanical exhaust ventilation systems without heat recovery changed to mechanical balanced ventilation systems with heat recovery in buildings designed after 2003 (D2 National Building Code of Finland. Indoor Climate and Ventilation of Buildings, Citation2003; Decree of Ministry of the Environment Finland, Citation2002). The changes in the U-values of the envelope can be explained in an example of the U-value of external walls as 0.4 W/m2K (1976), 0.29 W/m2K (1978), 0.28 W/m2K (1985), and 0.25 W/m2K (2003). After that, the simple U-value requirements ended, and the new building code in 2010 started to use requirements for total heat losses through the envelope (heat conduction and infiltration) and ventilation (D3 National Building Code of Finland. Rakennusten Energiatehokkuus (Energy Efficiency of Buildings), Citation2012).
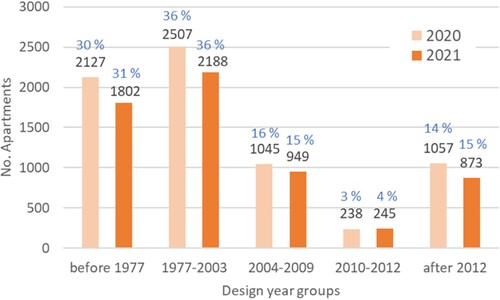
The update in 2012 set a criterion of a maximum of 150 Kh over 27 °C for the room temperature during June–August in the new apartment buildings using simulations with TRY 2012 to address overheating (D3 National Building Code of Finland. Rakennusten Energiatehokkuus (Energy Efficiency of Buildings), Citation2012). To get a construction permit, the room air temperature simulations should be carried out and proven that maximum degree hours above 27°C do not exceed 150 Kh. This requirement can be met by using different passive and active solutions except for window openings. The summary of the changes in building codes is presented in . The number and share of apartments in each design year category are shown in . Although most of the measured apartments are in the older categories, there is a noticeable number of apartments in the newer groups (2004–2009, 2010–2011, and after 2012), with more than 30% of the apartments.
Figure 2. The changes in Finnish building codes over time.
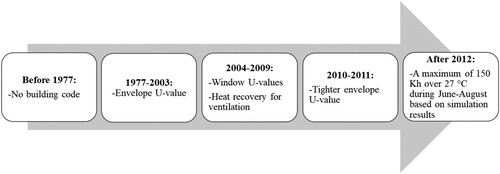
Figure 3. The number and share of apartments in categorized design years.
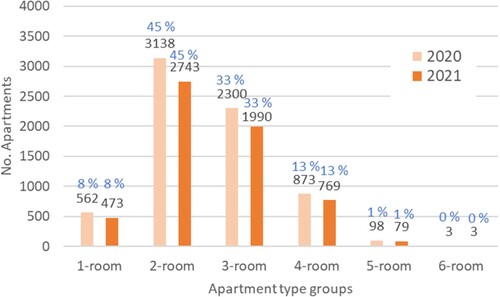
On the other hand, the apartments were different in size and number of rooms. The area of the apartments varied between 20 and 230 m2, and the apartments have 1–6 rooms, including bedrooms and living rooms. The number and share of each apartment type in data for 2020 and 2021 are shown in . As can be seen, most of the measured apartments had two or three rooms, and a few of them had 5 or 6 rooms.
Figure 4. The number of apartments in different apartment type categories.
Statistical analysis
The statistical analysis aimed to find out if different design years, areas, or apartment types have a statistically significant influence on overheating in the apartments. The difference was tested with the ANOVA analysis method (Lehmann, Citation1959). When the ANOVA test leads to significant results, then at least one of the samples is different from the other ones. Thus, the hypothesis of the test was that there was no difference between the design years, apartment types, and areas. This was tested using a confidence level p-value of 0.05. The p-value is a probability that measures the evidence against the null hypothesis. Lower probabilities provide stronger evidence against the null hypothesis. The following assumptions are necessary to use the ANOVA test:
The samples are independent and random.
The different populations may have different means.
Since the sample size is large, the ANOVA results are robust despite the violations of normality and homogeneity (Field, Citation2017). Eventually, the post hoc tests were conducted to define which groups were different from each other. Post hoc tests evaluate whether the means of two groups are the same. There are several formulas for doing simple post hoc tests. The Tukey test is one of the more conservative simple post hoc tests (Homack, Citation2001).
Outdoor weather during hot and average summers
Finland is in the northern part of the EU, and its climate belongs to Df in the Köppen Geiger climate classification, indicating subarctic climate conditions. The southern coast of Finland where the buildings are located is classified as Dfb, which is cold, has no dry season, and has warm summers (Peel et al., Citation2007). To analyze the overheating risk in apartments during hot summers, a reference comparison is needed for an average summer in Finland. This way, the rise in overheating due to uncommonly warm weather can be defined. To clarify how average or warm the summers of 2020 and 2021 were compared to the whole 33-year sample of summers, the means of the outdoor air temperature values for every summer from 1989 to 2021 were sorted from coolest to warmest. The percentiles, indicating the resulting ranking, are shown in . Summers with a mean temperature within the lower tercile (below the 33rd percentile) are defined as cooler than average. Summers with a mean temperature within the middle tercile (above the 33rd percentile and below the 67th percentile) are defined as near-average. And, summers with a mean temperature within the upper tercile (above the 67th percentile) are defined as warmer than average. Furthermore, summers with a mean temperature at or below the 10th percentile are defined as much cooler than average. And summers with a mean temperature at or above the 90th percentile are defined as much warmer than average.
Table 2. Statistics of the mean outdoor air temperature at the Helsinki-Vantaa weather station in summers (between May 15 and August 31) 1989–2021.
In 2020, the summer mean temperature was 16.3°C, which is within the middle tercile (above the 33rd percentile and below the 67th percentile) of the 1989–2021 mean summer temperatures, hence being near average, i.e. typical/usual. In 2021, the summer mean temperature was 17.4°C, which is at the 90th percentile of the 1989–2021 mean summer temperatures, hence being much warmer than average.
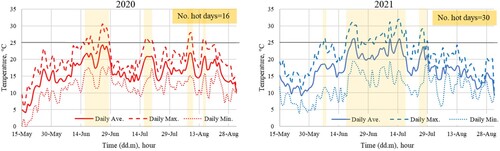
shows the outdoor daily average, maximum, and minimum temperatures during the summers of 2020 and 2021. A hot day in Finland is defined in two ways: (1) as a day with a daily maximum temperature higher than 25°C (Finnish Meteorological Institute (FMI), Citation2023) and (2) as a day with a daily average air temperature higher than 20°C (Kim et al., Citation2018). In this study, the first definition was used. Therefore, there were 16 hot days in the summer of 2020 and 30 hot days in the summer of 2021, most of them in July (25 days). Moreover, the maximum temperature exceeded 30°C on 7 days in the summer of 2021, while it was higher than 30°C on just one day in the summer of 2020. Additionally, there were 5 days with an average temperature higher than 25°C in the summer of 2021, while the daily average temperature was always below 25°C in the summer of 2020.
Figure 5. Outdoor daily mean, maximum, and minimum temperature during the summers of 2020 and 2021.
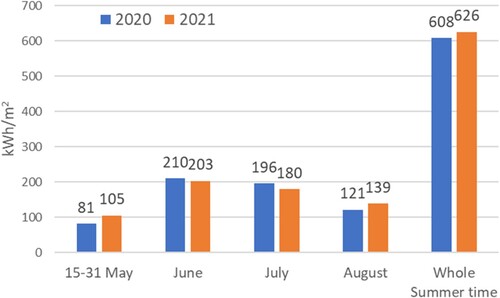
Comparing solar radiation, the monthly global radiation and the total global radiation for the whole summer are shown in . As can be seen, May and August 2021 had higher amounts of global radiation than May and August 2020, while in June and July 2020, global radiation was higher than in the same months of 2021. However, the total amount of solar radiation had a similar level in both summers.
Figure 6. Global radiation during the summers of 2020 and 2021.
Overheating assessment criteria
Two methods were taken to assess overheating in the living spaces of the buildings. First, the percentage of the apartments with the maximum hourly temperature during the whole summer above the selected threshold values of indoor temperature was calculated separately for all day (24 h) and relaxing time (between 21:00 and 8:00). Second, the whole summer degree hours above the threshold values are computed for each apartment. With both methods, comparing the results for the average summer (2020) and the hot summer (2021) can define the risk of overheating in summers that are much warmer than average.
The threshold values of indoor temperature to define overheating were adopted from the requirements suggested by the Ministry of the Environment for new building design and the Ministry of Social Affairs and Health of Finland for existing buildings. There are two sets of criteria in Finland that address overheating:
Based on the requirements of the Ministry of the Environment of Finland for new apartment buildings to prevent overheating in apartments, only 150 Kh (degree hours) above 27°C during the summer months (June–August) are allowed for the simulation results with TRY2012 in the design phase of new apartment buildings (Ministry of Environment, Citation2018). This threshold can be applied in apartments with or without mechanical cooling with all kinds of ventilation systems, including natural or mechanical ones. However, this requirement can be met by using different passive and active solutions except for window openings.
There is a maximum indoor temperature limit for the existing residential buildings required by the Ministry of Social Affairs and Health. This maximum value is 32 °C in normal residential buildings and 30°C in residential living spaces for elderly people who are cared for (Ministry of Social Affairs and Health, Citation2015).
Therefore, the degree hours above 27°C, 30°C, and 32°C were calculated for mid-May to the end of August for all the studied apartments. The number of degree hours above 27°C of the apartments was compared to the value of 150 Kh required for new apartment buildings, even though the results were obtained from field measurements done from mid-May to the end of August, rather than from simulations for a slightly shorter summer season. Since 30°C and 32°C are the maximum indoor temperatures required by the Ministry of Social Affairs and Health, degree hours above these thresholds would show high risks of overheating.
Results
Overheating in apartments
Maximum temperature
The maximum hourly indoor temperature of all apartments was analyzed during both the summers of 2020 and 2021, considering all hours of the day (24 h) as well as for the relaxing time (21:00–8:00). As can be seen in , in the summer of 2020, the maximum hourly temperature exceeded 27°C in 76% of the apartments, 30°C in 8%, and 32°C in 1%. This indicates that apartments are warming up during the average summers as well. However, the percentage of apartments with the maximum hourly temperature above the set threshold values (27°C, 30°C, and 32°C) rose noticeably to 96%, 32%, and 4%, respectively, in the summer of 2021. Hence, during the hot summer, the indoor temperature exceeded 27°C at least occasionally in almost all the apartments. Moreover, one-third of the apartments had a maximum hourly temperature above 30°C in the summer of 2021.
Figure 7. The percentage of apartments with the maximum hourly temperature of the summer above 27°C, 30°C, and 32°C. 6,974 apartments in 2020 and 6,056 apartments in 2021 are analyzed.
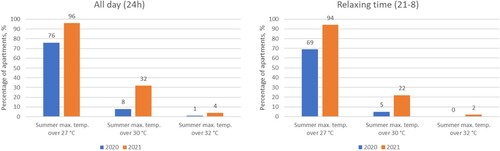
The indoor temperature conditions were very similar during the relaxing time (21:00–8:00) in the summer of 2021 in comparison to the all-day results. This suggests that when apartments warm up during hot summers, night ventilation is not enough for cooling down indoor temperature conditions for two reasons. First, it may be because of the relatively high night-time outdoor temperatures. As shown in , the minimum outdoor temperature during hot days is mostly higher than 15°C and is close to 20°C. Second, the ventilation rate is typically low (about 0.5 ACH) in these buildings to have major effects on indoor temperatures. As a result, relying solely on mechanical ventilation systems for ventilative cooling with this low airflow rate might not be enough.
Window openings were probably used in many of the apartments during the relaxing time. It is important to note that the dataset lacks information on the use of windows, thus the results cannot accurately demonstrate the potential cooling effects of window opening by occupants.
The percentage of apartments with a maximum temperature higher than 30°C is 10% lower during the nights in 2021. Additionally, in 2020, there was no apartment with a maximum temperature at night higher than 32°C, while 2% of the apartments had a maximum temperature higher than 32°C during the nights of summer of 2021.
Degree hours above the indoor temperature criteria
To get a better overview of overheating in apartments, the degree hours above 27°C, 30°C, and 32°C for each apartment during the whole summer were calculated. presents the 98 percentiles of these degree hours in the apartments for the whole summer periods of 2020 and 2021. Although the maximum degree hours above 27°C is as high as 850 Kh in 2020, the average is lower than 150 Kh, which is the maximum allowed value in the design phase. However, the values are much higher in 2021, with an average of 444 Kh and a maximum of 1200 Kh.
Figure 8. Degree hours above 27°C, 30°C, and 32°C for 98% of the apartments during the whole summer of 2020 and 2021.
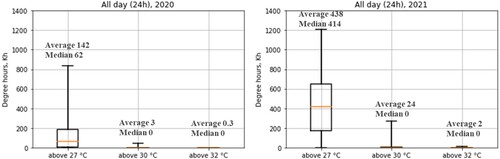
The average degree hours above 30°C and 32°C were 3.0 and 0.3 Kh, respectively, in 2020. In 2021, the average degree hours above 30°C were considerably higher and reached 24 Kh, and the average degree hours above 32°C reached 2 Kh. Although these values are relatively small compared to the degree hours above 27°C, they still show that indoor temperatures exceeded the maximum indoor temperature limits required by the Ministry of Social Affairs and Health, especially in the summer of 2021 and for elderly residents.
Overall, based on these results, the average degree hours above 27°C was three times higher, and those above 30°C and 32°C were 7 times higher in the hot summer of 2021 than in the average summer of 2020.
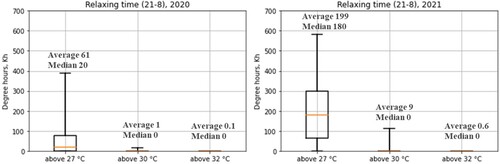
Furthermore, the degree hours above 27°C, 30°C, and 32°C during the relaxing time (21:00–8:00) in the whole summers of 2020 and 2021 are presented in for 98% of the apartments. The results of the relaxing time show that overheating was typical during the nights in the summer of 2021 in terms of degree hours. The average degree hours above 27°C was 199 Kh, which is higher than the 150 Kh required in the design phase and more than three times higher than the average degree hours above 27°C in 2020. Despite the high maximum degree hours above 27°C during the nights in the summer of 2020, the average value is 61 Kh, which is lower than the requirement in the design phase. The average degree hours above 32°C was around zero during the nights in both summers.
Figure 9. Degree hours above 27°C, 30°C, and 32°C for 98% of the apartments during the relaxing time (21:00–8:00) of the whole summer in 2020 and 2021.
Overheating and apartment characteristics
The apartments’ design year
All apartments were categorized into 5 design year groups. As seen in , the overheating in terms of degree hours above 27°C, 30°C, and 32°C was higher in summer 2021 for all design year groups. The average level of the degree hours above 27°C was almost 4 times higher in the hot summer of 2021 than in the average summer of 2020 for all design year groups. The maximum degree hours above 30°C was higher in 2021 than in 2020. Moreover, the maximum degree hours above 32°C was around 10 and 20 Kh for the two oldest groups (before 1977 and 1977–2003) in 2021, while it was zero in 2020. Additionally, the figure shows that the maximum degree hours above 27°C and 30°C are lower in the two newest apartments than in the old ones (design year groups 2010–2011 and after 2012) in both years. The apartments designed after 2012 have building code requirements for degree hours above 27°C to be less than 150 Kh.
Figure 10. Degree hours above 27°C, 30°C, and 32°C for different design year categories.
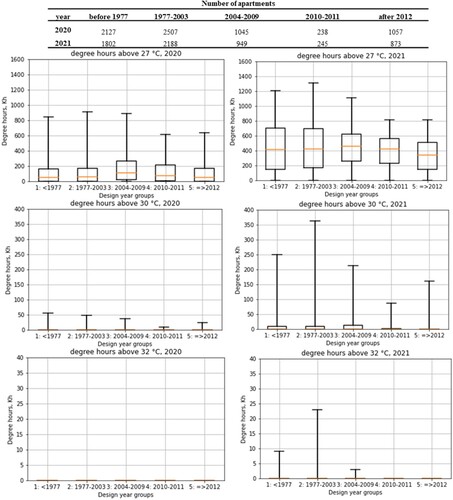
Degree hours above 27°C were chosen for ANOVA test analysis since the degree hours above 30°C and 32°C are relatively few. The p-value for different design year groups resulting from the ANOVA test is 0.00, which shows that there is a statistically significant difference between at least two categories. shows the results of the post hoc test. According to the results, the apartments designed after 2012 are significantly different in degree hours above 27°C from the apartments designed before 1977, 1977–2003, and 2004–2009 in the summer of 2021 and from apartments designed in 2004–2009 in the summer of 2020. Apartments designed in 2004–2009 are significantly different in degree hours above 27°C from the apartments designed before 1977 and 1977–2003 in the summer of 2020.
Table 3. Post hoc test results of statistically significant differences for degree hours above 27°C in different design year groups. (The values in the brackets are P-value results.)
Based on these results and , it seems that in 2020, all the design year groups (before 1977, 1977–2003, 2010–2011, and after 2012) have lower overheating (Kh above 27°C) than those designed in 2004–2009. Although there is no statistically significant difference between this group and the older ones in 2021, the figure shows that the median value of this group is higher than other groups in the summer of 2021. This group (2004–2009) includes buildings that are equipped with a balanced ventilation system combined with heat recovery for the first time in the Finnish building code. This change may have some effects on overheating levels in these buildings.
The apartments designed after 2012 have fewer degree hours above 27°C than those designed before 1977, in 1977–2003, and 2004–2009 in the summer of 2021. This shows the effectiveness of the building code requirements of degree hours above 27°C to be lower than 150 Kh, to prevent overheating in the apartments.
The apartment area and number of rooms
All the apartments were categorized into 6 different types based on the number of rooms including living rooms and bedrooms. The degree hours above 27°C, 30°C, and 32°C for each category are shown in . In all the apartment types, the overheating risk in terms of degree hours above 27°C, 30°C, and 32°C is higher in the summer of 2021 than in the summer of 2020, with average values almost four times higher in 2021 in all the apartments with different numbers of rooms. Moreover, the results indicate that, in both years, the degree hours above 27°C and 30°C and consequent overheating increase when the number of rooms decreases from three to one.
Figure 11. Degree hours above 27°C, 30°C, and 32°C for different apartment type categories.
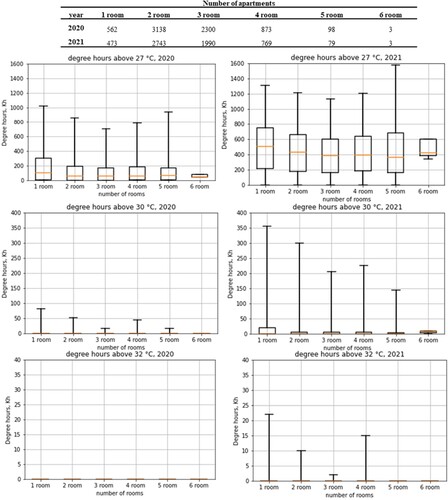
The p-value for different apartment type categories resulting from the ANOVA test is 0.00, which shows there is a statistically significant difference between at least two categories. shows the results of the post hoc test. According to the results, the degree hours above 27°C differed statistically significantly (p-values <0.05) in both years between the 1-room apartments and the apartments with 2, 3, or 4 rooms. Since the population of the groups with 5 or 6 rooms is relatively small (there are fewer than one hundred 5-room apartments and only three 6-room apartments), the ANOVA test results are not meaningful in those groups.
Table 4. Post hoc test results of statistically significant differences for degree hours above 27°C in different types of apartments. (The values in the brackets are P-value results.)
Based on these results and , it seems that in both average and hot summers, 1-room apartments have a higher overheating risk than 2-room, 3-room, and 4-room apartments. Additionally, the risk of overheating is higher in 2-room apartments than in 3-room apartments.
Based on the differences found, a hypothesis that the smaller apartments have a higher risk of overheating during the average and hot summers arises. Therefore, the apartments were categorized based on their area into three groups: 25–60 m2 as small apartments, 60–80 m2 as medium apartments, and more than 80 m2 as big apartments. The degree hours above 27°C, 30°C, and 32°C for each area group are shown in .
Figure 12. Degree hours above 27°C, 30°C, and 32°C for different area groups.
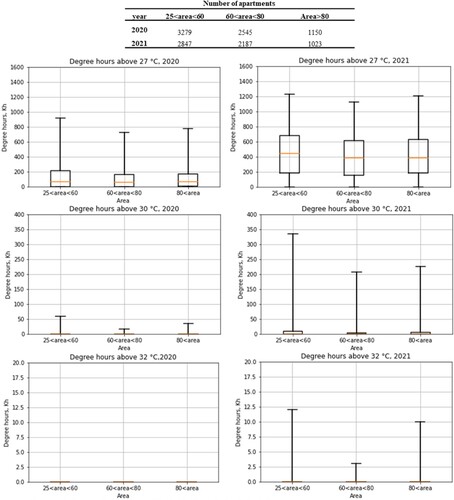
As can be seen, in all area groups, the overheating risk in terms of the degree hours is higher in summer 2021 than in summer 2020. Moreover, based on these figures, it seems that for degree hours above 27°C and 30°C, the small apartments (25–60 m2) have a higher risk of overheating than the larger apartments. Since the degree hours above 32°C in summer 2021 are zero and very low in summer 2021, the difference cannot be seen between different apartment types.
The p-value for different area categories resulting from the ANOVA test is 0.00, which shows there is a statistically significant difference between at least two categories. shows the post hoc test results: the p-values between small apartments and medium apartments and between medium apartments and big apartments are lower than 0.05 in both summers. Based on these results and , it seems that smaller apartments have a higher risk of overheating in both summers.
Table 5. Post hoc test results of statistically significant differences for degree hours above 27°C in different area categories (The values in the brackets are p-value results).
Discussion
The data obtained from the extensive field measurements of hourly indoor temperature in a unique large building stock of more than 6000 apartments provides insight into the actual room air temperatures in the large building stock and how the building characteristics and average and hot summer weather conditions might affect overheating. These are needed in revising the building codes and regulations for the design phase of new buildings as well as the health-related regulations for existing buildings.
There are some limitations and restrictions in the field study. The unknown characteristics of the measured apartments, e.g. the shading and orientation of buildings, exact characteristics of the building envelope, green view effects, and detailed information on the occupants’ behaviour (e.g. window opening and use of portable cooling devices) should be taken into account in interpreting the results of this research.
The threshold values of overheating are defined based on the Finnish building codes for the design phase of new buildings and occupants’ health and comfort-related regulations in the occupied existing buildings. However, analyzing thermal discomfort, humidity level, and occupants’ adaptability should be considered. Many studies have used the adaptive thermal comfort model to define the overheating risk (See ). The adaptive thermal comfort model indicates that human comfort depends upon historic and relevant outdoor conditions and one’s ability to control the immediate environment (Nicol et al., Citation2012). Considering overheating, the building codes in Nordic countries are based on single temperature criteria, and the adaptive comfort model is not commonly used to define overheating in these countries (Attia et al., Citation2023).
Despite the limitations, the result of analyzing data on indoor temperatures in more than 6000 apartments indicated the severity of the overheating risk in the Helsinki region of Finland as a cold climate area. There were 584,174 apartments in blocks of apartments in the Helsinki region in 2021 (Statistics Finland’s Free-of-Charge Statistical Databases, Citationn.d.). Based on the results, the maximum indoor temperature during a much warmer than average summer might be higher than 30°C in more than 128,000 of these apartments and higher than 32°C in more than 23,000 of them (22% and 4%, respectively; see Section Maximum temperature). This gives insight into the fact that in addition to other climates analyzed in the literature, summertime overheating is also a concern in cold climates. It can pose a threat to people’s wellbeing during heatwaves and lead to an increased mortality rate among the elderly (Kollanus et al., Citation2021).
The results showed that smaller apartments with fewer rooms have a higher risk of overheating during average and hot summers. However, the unknown characteristics of the apartments and the limitation of this study (e.g. the occupants’ behaviour, window opening, the shading and orientation of buildings, and exact characteristics of the building envelope) might have more significant effects on the level of overheating. Therefore, future studies considering these parameters are recommended.
Considering the number of degree hours above 27°C, 30°C, and 32°C, overheating can occur during an average summer, but its magnitude is significantly higher during a hot summer. Since hot summers will be more frequent in the future due to climate change, the overheating risk is likely to be even greater. This has been discussed in some simulation studies on the Nordic climate (Dodoo & Gustavsson, Citation2016; Tian et al., Citation2020; Farahani et al., Citation2021). In these studies, overheating is shown to be significantly higher in future climates under different carbon emission scenarios.
However, this high overheating risk can be mitigated. As the results show, the newer apartments, designed after 2012 when the latest Finnish building code came into force, had lower overheating risks. This shows that these requirements have been effective in reducing overheating compared to older apartments, but they may not be sufficient to prevent overheating during hot summers. Regarding these requirements, two points should be considered:
The implemented strategies for overcoming overheating can be any passive or active solutions except for window opening. Prioritizing passive strategies is crucial to meet the building code requirements effectively. Although opening windows can effectively reduce indoor temperatures in apartments, Finnish regulations mandate that designers achieve the necessary requirements without relying on this method. This approach may be motivated by concerns related to noise, safety, and air quality. Furthermore, the effectiveness of window opening for cooling is highly dependent on the behaviour of the occupants. In cases where the residents are predominantly elderly, it would be hard to ensure consistent and appropriate use of window opening for cooling purposes. Additionally, considering climate change, higher temperature levels and an increase in tropical nights are expected, making the potential cooling effect of window opening very limited.
TRY2012 is utilized in building code simulations, offering weather data that closely aligns with the 30-year average climatological conditions at the Helsinki-Vantaa weather station in southern Finland. Its primary purpose is for energy calculations rather than thermal comfort analyses. However, considering climate change and its associated hot summers, it is essential to use weather data describing certain warm periods during the summer for overheating analyses.
Considering the results of this study, climate change and its associated hot summers, and the significant contribution of buildings to CO2 emissions, revising building codes becomes crucial in addressing overheating during hot summers in apartments. To address overheating issues effectively, the update should take climate change into account and include a combination of passive strategies like shadings, window openings, and ventilative cooling. Additionally, it should incorporate modern technologies and data-driven tools, such as predicting users’ behaviour and implementing smart building solutions. This comprehensive approach will help create comfortable and sustainable indoor environments while optimizing energy efficiency and adapting to changing climatic conditions.
Along with passive strategies, mechanical cooling systems and portable cooling devices can be potential solutions for the prevention of overheating in the current and future climates (Dodoo & Gustavsson, Citation2016; Tian et al., Citation2020; Farahani et al., Citation2021). Split cooling units, district cooling, and ground-based free cooling are possible options. District cooling is mostly used in top-quality apartment blocks that are in the most built-up parts of cities (Vainio et al., Citation2010). Ground source heat pump (GSHP) systems that are in use for heating could be used for cooling as well in Finland (Nowacki, Citation2007). Alongside, split cooling units are easy to install in the existing buildings. However, most of the dwellings are not generally equipped with mechanical cooling systems in Finland. Emissions during the entire life cycle of cooling systems contributing to climate change – and their waste heat contributing to the urban heat island phenomenon – should be considered when the active cooling systems are installed and used to prevent overheating of apartments.
Conclusions
The findings indicated that while some level of overheating was observed during the average summer of 2020, significantly higher levels of overheating were experienced during the hot summer of 2021. During this period, the average degree hours above 27°C were approximately three times higher than the building code requirements, and nearly all apartments had maximum hourly temperatures exceeding 27°C throughout the entire summer. Moreover, the overheating situation during the relaxing time (21–8) was similar to the overheating during all day in terms of degree hours above 27°C. However, there are almost no degree hours above 32°C during the nights of both summers.
The apartments designed based on the latest Finnish building code have a lower risk of overheating with statistically significant differences in their degree hours above 27°C compared to older apartments. This shows the effectiveness of the latest building codes that require proofed degree hours above 27°C to be lower than 150 Kh during June–August in the new apartment buildings using simulations with TRY2012. However, the purpose of TRY 2012 is to describe typical summers (and other seasons), not hot summers in the recent past climate. Therefore, there is a need for considering climate change effects in the building code to prevent overheating during hot summers.
The smaller apartments with fewer rooms have a higher risk of overheating with statistically significant differences in their degree hours above 27°C compared to the apartments with more rooms. However, other characteristics of the apartments (e.g. the occupants’ behaviour, window opening, shading and orientation of buildings, and properties of the building envelope) might have more significant effects on the level of overheating.
This study, along with other research conducted in different climates, demonstrates the significant problem of severe overheating in residential spaces of cold climates during heatwaves in the current climate. With the rising effects of climate change, heatwaves can last longer, and higher indoor temperatures can occur during hot summers. Therefore, there is an urgent need for action on preventing this issue. It seems to be crucial to work on overheating issues in future studies. These studies should focus on passive and active solutions under climate change and its associated heatwaves, the effects of other characteristics of the apartments and occupants’ behaviour, the correlations between indoor and outdoor temperatures in hot outdoor conditions, and overheating in buildings affected by their surroundings and microenvironment.
Author contributions
Conceptualization: A.V.F., R.K., and J.J.; data curation: A.V.F. and I.K.; formal analysis: A.V.F.; methodology: A.V.F.; investigation: A.V.F.; resources provision of study materials: K.J., K.R., and N.K.; supervision: R.K.; writing original draft: A.V.F.; writing, review, and editing: R.K., J.J., N.K., K.J., and K.R. All authors have read and agreed to the published version of the manuscript.
Acknowledgments
The authors would like to thank the building owners and the measurement system operators for providing the temperature data for this study.
Disclosure statement
No potential conflict of interest was reported by the authors.
Additional information
Funding
References
- American Society of Heating Refrigerating and Air-Conditioning Engineers. (2020). ASHRAE, ASHRAE/ANSI Standard 55-2010 Thermal environmental conditions for human occupancy.
- Attia, S., Benzidane, C., Rahif, R., Amaripadath, D., Hamdy, M., Holzer, P., Koch, A., Maas, A., Moosberger, S., Petersen, S., Mavrogianni, A., Maria Hidalgo-Betanzos, J., Almeida, M., Akander, J., Khosravi Bakhtiari, H., Kinnane, O., Kosonen, R., & Carlucci, S. (2023). Overheating calculation methods, criteria, and indicators in European regulation for residential buildings. Energy and Buildings, 292, 113170. https://doi.org/10.1016/j.enbuild.2023.113170
- Attia, S., & Gobin, C. (2020). Climate change effects on Belgian households: A case study of a nearly zero energy building. Energies. 13(20), 20. https://doi.org/10.3390/en13205357
- Baborska-Narożny, M., Stevenson, F., & Grudzińska, M. (2017). Overheating in retrofitted flats: Occupant practices, learning and interventions. Building Research & Information, 45(1-2), 40–59. https://doi.org/10.1080/09613218.2016.1226671
- Barbosa, R., Vicente, R., & Santos, R. (2015). Climate change and thermal comfort in Southern Europe housing: A case study from Lisbon. Building and Environment, 92, 440–451. https://doi.org/10.1016/j.buildenv.2015.05.019
- Beizaee, A., Lomas, K. J., & Firth, S. K. (2013). National survey of summertime temperatures and overheating risk in English homes. Building and Environment, 65, 1–17. https://doi.org/10.1016/j.buildenv.2013.03.011
- Birchmore, R., Davies, K., Etherington, P., Tait, R., & Pivac, A. (2017). Overheating in Auckland homes: Testing and interventions in full-scale and simulated houses. Building Research & Information, 45(1-2), 157–175. https://doi.org/10.1080/09613218.2017.1232857
- C 1-4 National building code of Finland. (1976). C 1-4 National building code of Finland. Ääneneristys - Veden ja kosteudeneristys – Lämmöneristys - Lämmönläpäisykertoimen määritys ja eristystyön suoritus (Sound insulation - Water and moisture insulation - Thermal insulation - Determination of heat tran. Ministry of the Interior. Helsinki. https://www.edilex.fi/data/rakentamismaaraykset/C1_4_1976_fi.pdf
- The Chartered Institution of Building Services Engineers, & TM52., (CIBSE). (2017). (CIBSE) TM52. The limits of thermal comfort: avoiding overheating in European buildings.
- City of Helsinki. (2022). Helsinki facts and figures 2022 (p. 48). City Executive Office, Urban Research and Statistics. https://www.hel.fi/hel2/tietokeskus/julkaisut/pdf/22_06_15_Helsinki_facts_and_figures_2022.pdf
- D2 National building code of Finland. Indoor Climate and Ventilation of Buildings. (2003). Ministry of the Environment. https://www.edilex.fi/data/rakentamismaaraykset/d2e.pdf
- D3 National building code of Finland. Rakennusten energiatehokkuus (Energy efficiency of buildings). (2012). Ministry of environment. https://www.edilex.fi/data/rakentamismaaraykset/D3-2012_S.pdf
- Decree of Ministry of the Environment Finland. (2002). C3 national building code of Finland - thermal insulation in a building. In National Building Code of Finland. Ministry of the Environment. https://www.edilex.fi/data/rakentamismaaraykset/c3e_2003.pdf
- Dodoo, A., & Gustavsson, L. (2016). Energy use and overheating risk of Swedish multi-storey residential buildings under different climate scenarios. Energy, 97, 534–548. https://doi.org/10.1016/j.energy.2015.12.086
- Farahani, A. V., Jokisalo, J., Korhonen, N., Jylhä, K., Ruosteenoja, K., & Kosonen, R. (2021). Overheating risk and energy demand of nordic old and new apartment buildings during average and extreme weather conditions under a changing climate. Applied Sciences (Switzerland), 11(9), 3972. https://doi.org/10.3390/app11093972
- Field, A. (2017). Discovering statistics using IBM SPSS statistics (5th ed.). University of Sussex, UK.
- Finnish Meteorological Institute (FMI). (2021). Heat statistics (in Finnish). https://www.ilmatieteenlaitos.fi/helletilastot
- Finnish Meteorological Institute (FMI). (2023). helletilastot.https://www.ilmatieteenlaitos.fi/helletilastot
- Gupta, R., & Gregg, M. (2020). Assessing the magnitude and likely causes of summertime overheating in modern flats in UK. Energies, 13(19), 5202. https://doi.org/10.3390/en13195202
- He, C., Ma, L., Zhou, L., Kan, H. D., Zhang, Y., Ma, W. C., & Chen, B. (2019 April). Exploring the mechanisms of heat wave vulnerability at the urban scale based on the application of big data and artificial societies. Environment International, 127, 573–583. https://doi.org/10.1016/j.envint.2019.01.057
- Homack, S. R. (2001). Understanding what ANOVA post hoc tests are, really. Annual Meeting of the Southwest Educational Research Association, 1–15. https://files.eric.ed.gov/fulltext/ED449222.pdf
- Kalvelage, K., Passe, U., Rabideau, S., & Takle, E. S. (2014). Changing climate: The effects on energy demand and human comfort. Energy and Buildings, 76, 373–380. https://doi.org/10.1016/j.enbuild.2014.03.009
- Kim, S., Sinclair, V. A., Räisänena, J., & Ruuhelac, R. (2018). Heat waves in Finland: Present and projected summertime extreme temperatures and their associated circulation patterns. International Journal of Climatology, 38(3), 1393–1408. https://doi.org/10.1002/joc.5253
- Kollanus, V., Tiittanen, P., & Lanki, T. (2021). Mortality risk related to heatwaves in Finland – factors affecting vulnerability. Environmental Research, 201, 111503. https://doi.org/10.1016/j.envres.2021.111503
- Kotol, M., Rode, C., Clausen, G., & Nielsen, T. R. (2014). Indoor environment in bedrooms in 79 Greenlandic households. Building and Environment, 81, 29–36. https://doi.org/10.1016/j.buildenv.2014.05.016
- Kunkel, S., Kontonasiou, E., Arcipowska, A., Mariottini, F., & Atanasiu, B. (2015). Indoor air quality, thermal comfort and daylight. Analysis of residential buildings regulations in eight EU member states (Issue March). the Buildings Performance Institute Europe (BPIE). https://www.researchgate.net/publication/274695177
- Laouadi, A., Bartko, M., & Lacasse, M. A. (2020). A new methodology of evaluation of overheating in buildings. Energy and Buildings, 226, 110360. https://doi.org/10.1016/j.enbuild.2020.110360
- Lee, W. V., & Steemers, K. (2017). Exposure duration in overheating assessments: A retrofit modelling study. Building Research & Information, 45(1-2), 60–82. https://doi.org/10.1080/09613218.2017.1252614
- Lehmann, E. L. (1959). Testing statistical hypotheses. JOHN WILEY & SONS, INC.
- Lestinen, S. (2018). Indoor airflow characteristics under increased heat load conditions [Aalto University]. http://urn.fi/URN:ISBN:978-952-60-8314-8
- Lomas, K. J., Watson, S., Allinson, D., Fateh, A., Beaumont, A., Allen, J., Foster, H., & Garrett, H. (2021). Dwelling and household characteristics’ influence on reported and measured summertime overheating: A glimpse of a mild climate in the 2050s. Building and Environment, 201, 107986. https://doi.org/10.1016/j.buildenv.2021.107986
- Maivel, M., Kurnitski, J., & Kalamees, T. (2015). Field survey of overheating problems in Estonian apartment buildings. Architectural Science Review, 58(1), 1–10. https://doi.org/10.1080/00038628.2014.970610
- IPCC, Masson-Delmotte, V., Zhai, P., Chen, Y., Goldfarb, L., Gomis, M. I., Matthews, J. B. R., Berger, S., Huang, M., Yelekçi, O., Yu, R., Zhou, B., Lonnoy, E., Maycock, T. K., Waterfield, T., Leitzell, K., & Caud, N. (2021). Climate change 2021: The physical science basis. Contribution of Working Group I to the Sixth Assessment Report of the Intergovernmental Panel on Climate Change. www.ipcc.ch
- Mavrogianni, A., Pathan, A., Oikonomou, E., Biddulph, P., Symonds, P., & Davies, M. (2017). Inhabitant actions and summer overheating risk in London dwellings. Building Research & Information, 45(1-2), 119–142. https://doi.org/10.1080/09613218.2016.1208431
- Mikkonen, S., Laine, M., Mäkelä, H. M., Gregow, H., Tuomenvirta, H., Lahtinen, M., & Laaksonen, A. (2015). Trends in the average temperature in Finland, 1847–2013. Stochastic Environmental Research and Risk Assessment., 29(6), 1521–1529. https://doi.org/10.1007/s00477-014-0992-2
- Ministry of Environment. (2018). Decree (1010/2017) on the energy performance of the new building.
- Ministry of Social Affairs and Health. (2015). Decree of the ministry of social affairs and health on health-related conditions of housing and other residential buildings and qualification requirements for third-party experts, 545/2015. 151(5), 10–17.
- Mulville, M., & Stravoravdis, S. (2016). The impact of regulations on overheating risk in dwellings. Building Research & Information, 44(5-6), 520–534. https://doi.org/10.1080/09613218.2016.1153355
- Nicol, F., Humphreys, M., & Roaf, S. (2012). Adaptive thermal comfort: Principles and practice (1st ed.). Routledge. https://doi.org/10.4324/9780203123010
- Nowacki, J.-E. (2007). Heat pumps in energy statistics – suggestions.
- The Passivhaus Trust. (2023). Technical guidance - keeping cool: Avoiding overheating risks. https://www.passivhaustrust.org.uk/guidance_detail.php?gId = 49
- Pathan, A., Mavrogianni, A., Summerfield, A., Oreszczyn, T., & Davies, M. (2017). Monitoring summer indoor overheating in the London housing stock. Energy and Buildings, 141, 361–378. https://doi.org/10.1016/j.enbuild.2017.02.049
- Peel, M. C., Finlayson, B. L., & McMahon, T. A. (2007). Updated world map of the Köppen-Geiger climate classification. Hydrology and Earth System Sciences, 11(5), 1633–1644. https://doi.org/10.5194/hess-11-1633-2007
- Ramallo-González, A. P., Eames, M. E., Natarajan, S., Fosas-de-Pando, D., & Coley, D. A. (2020). An analytical heat wave definition based on the impact on buildings and occupants. Energy and Buildings, 216, 109923. https://doi.org/10.1016/j.enbuild.2020.109923
- Salthammer, T., Schieweck, A., Gu, J., Ameri, S., & Uhde, E. (2018). Future trends in ambient air pollution and climate in Germany – implications for the indoor environment. Building and Environment, 143, 661–670. https://doi.org/10.1016/j.buildenv.2018.07.050
- Sharifi, S., Saman, W., & Alemu, A. (2019). Identification of overheating in the top floors of energy-efficient multilevel dwellings. Energy and Buildings, 204, 109452. https://doi.org/10.1016/j.enbuild.2019.109452
- Statistics Finland’s free-of-charge statistical databases. (n.d.). https://pxdata.stat.fi/PxWeb/pxweb/en/StatFin/StatFin__asas/statfin_asas_pxt_116f.px/
- Tamerius, J. D., Perzanowski, M. S., Acosta, L. M., Jacobson, J. S., Goldstein, I. F., Quinn, J. W., Rundle, A. G., & Shaman, J. (2013). Socioeconomic and outdoor meteorological determinants of indoor temperature and humidity in New York city dwellings*. Weather, Climate, and Society, 5(2), 168–179. https://doi.org/10.1175/WCAS-D-12-00030.1
- Tian, Z., Zhang, S., Deng, J., & Hrynyszyn, B. D. (2020). Evaluation on overheating risk of a typical Norwegian residential building under future extreme weather conditions. Energies, 13(3), 658. https://doi.org/10.3390/en13030658
- Tillson, A.-A., Oreszczyn, T., & Palmer, J. (2013). Assessing impacts of summertime overheating: Some adaptation strategies. Building Research & Information, 41(6), 652–661. https://doi.org/10.1080/09613218.2013.808864
- Vainio, T., Lindroos, T., Pursiheimo, E., Vesanen, T., Sipilä, K., Airaksinen, M., & Rehunen, A. (2010). High-efficiency CHP, district heating and district cooling in Finland.
- van Hooff, T., Blocken, B., Hensen, J. L. M., & Timmermans, H. J. P. (2014). On the predicted effectiveness of climate adaptation measures for residential buildings. Building and Environment, 82, 300–316. https://doi.org/10.1016/j.buildenv.2014.08.027
- Vellei, M., Ramallo-González, A. P., Coley, D., Lee, J., Gabe-Thomas, E., Lovett, T., & Natarajan, S. (2017). Overheating in vulnerable and non-vulnerable households. Building Research & Information, 45(1-2), 102–118. https://doi.org/10.1080/09613218.2016.1222190
- Zhou, X., Carmeliet, J., Sulzer, M., & Derome, D. (2020). Energy-efficient mitigation measures for improving indoor thermal comfort during heat waves. Applied Energy, 278, 115620. https://doi.org/10.1016/j.apenergy.2020.115620