
 ?Mathematical formulae have been encoded as MathML and are displayed in this HTML version using MathJax in order to improve their display. Uncheck the box to turn MathJax off. This feature requires Javascript. Click on a formula to zoom.
ABSTRACT
This study evaluates thermal sensitivity, expectations, and adaptability in mixed-mode ventilated buildings by subjective and objective assessments. A field study of simultaneous measurements of physical environmental parameters and right-here-right-now surveys was conducted in three office buildings from summer to winter in humid subtropical climates. The study confirmed previous findings that thermal adaptability and preferences changes as the ventilation system switches between natural ventilation (NV) and air-conditioning (AC). Occupants in this study showed more sensitivity to temperature changes than previously reported by ASHRAE Standards, yet thermal sensitivity was the same under different modes of operation. The neutral temperature was 0.5 oC higher than the predicted neutral temperature by ASHRAE 55 under both modes of operation. Thermal expectations were 1.5 oC warmer than the neutral temperature estimated by ASHRAE 55 when the building was operated by AC, while thermal expectations were almost the same as predicted by ASHRAE 55 under NV mode. Thermal comfort range was 0.75 oC wider than those predicted by ASHRAE 55 under NV operation, and the same as ASHRAE 55 under AC operation. The findings of this research provide a better understanding of mixed-mode building operations and perspectives from occupants, important for building designers and building operation managers.
Introduction
Providing climate control and keeping tenants cool have become an important engineering consideration in modern architecture. Air-conditioning has enabled great modern architecture to emerge, yet it had come with a cost and burden to the climate and the environment. Tightly regulated indoor environments with minimal fluctuations over diurnal and seasonal timescales have caused huge energy loads from heating, ventilating, and air-conditioning (HVAC) systems. Despite being incongruent with the widely accepted thermal comfort standards, such as ASHRAE 55-2020 (ASHRAE Standards, Citation2020), buildings in Australia are still operating under a very narrow range of indoor air temperatures (20–24 oC) (Australian Institute of Refrigeration Air Conditioning and Heating, Citation2015). Thermal comfort is the term used to describe a condition of mind that most occupants feel satisfied in the thermal environment in buildings and is a socially determined notion defined by norms and expectations (Nicol & Roaf, Citation2017). The narrow range of indoor air temperatures has become a standard practice for commercial buildings in Australia and much of the rest of the developed countries. A significant energy is wasted by the current practice of controlling buildings within a narrow range of temperatures (Brager et al., Citation2015). The energy load from HVAC systems accounts for a significant proportion of total building energy consumption in buildings. A typical HVAC system in office buildings is responsible for approximately 40% of total energy consumption in buildings (HVAC HESS, Citation2012).
As an alternative to full air-conditioning systems, mixed-mode ventilation is a combination of natural ventilation and air-conditioning systems and allows the free running of buildings when outdoor climate is neither too hot nor too cold, resulting in considerable reductions in HVAC operating energy (Aguilera et al., Citation2021). Research has shown that mixed-mode approaches provide a better substitute to fully air-conditioned or fully naturally ventilated buildings by improving both thermal comfort and energy efficiency in buildings (Kim & de Dear, Citation2018).
However, despite the obvious benefits of mixed-mode ventilation, there is no consensus on the most suitable thermal comfort models for mixed-mode buildings. Thermal comfort model is a tool for predicting human comfort resulting from active systems such as HVAC and controlled passive systems, which is important for health, well-being and productivity of occupants in buildings. With the application of appropriate thermal comfort models, buildings can be operated with more comfortable and neutral indoor climatic conditions. Thermal comfort models can also contribute to significant energy savings in buildings by implementing wider range of indoor temperatures to reduce the need for active cooling or heating (Kazanci & Olesen, Citation2013). The existing thermal comfort models are either designed for fully air-conditioned buildings known as predicted mean vote models (Fanger, Citation1970) or for fully naturally ventilated buildings known as adaptive thermal comfort models (Brager & de Dear, Citation1998).
Rupp et al. (Citation2018) found no evidence to support a single adaptive comfort model for mixed-mode buildings in south Brazil with temperate climate and added that new temporal and spatial models need to be developed. One study in the cold climate of Tianjin, China, showed that the adaptive thermal comfort (ATC) was more applicable in mixed-mode buildings than predicted mean vote (PMV) models (Jia et al., Citation2020), although not perfectly predicting thermal comfort sensations in mixed-mode buildings.
Drake et al. (Citation2010) presented the results from their study in two mixed-mode buildings and suggested that the steady-state comfort models such as PMV and ATC are inadequate for describing actual thermal comfort sensations in mixed-mode buildings. They added that occupant adaptive behaviours may only moderately relate to indoor temperatures and not outdoor conditions and there is a difference in these relationships when the building operate in different ventilation modes. A study by Deuble and de Dear (Citation2012) in Sydney showed that occupants’ acceptance of the same combination of thermal conditions was dependent on the building's mode of operation in a mixed-mode building. Under an identical thermal condition, most occupants were satisfied in naturally ventilated mode, whereas unsatisfied during the air-conditioned mode. Due to the duality of comfort expectations, mixed-mode buildings raise some theoretical and regulatory questions in terms of psychological and physiological thermal sensations of human bodies. In another study in Tianjin, China, the neutral temperature was higher than the prediction calculated by PMV indicating that PMV model was not suitable for mixed-mode buildings, but ATC showed better applicability in both AC mode and NV mode (Jia et al., Citation2020). In a study in temperate climate in the UK, ATC provided a more appropriate application than PMV for predicting thermal comfort, yet an adaptive comfort model was developed specifically for an open-plan office building with mixed-mode ventilation (Luo et al., Citation2019). In a study by Kim and de Dear (Citation2018), it was concluded that the subjective perception of indoor thermal environment can be affected by different modes of building operation and occupants were more tolerant of the indoor thermal conditions when the building was in NV mode.
Some studies emphasized on the importance of control strategies in mixed-mode buildings and how that affects thermal comfort. In mixed-mode buildings with operable windows, either manual or automated, opening windows and the operation of mechanical cooling should be integrated with a control system to avoid the concurrent operation of the two systems and energy waste. The basic concept of control system is to provide a satisfactory indoor environment by alternating between NV and AC. The comfort-oriented controller was examined in a study by Fiorentini et al. (Citation2019) and proved to outperform the controlling based on deviation from a PMV set-point or the middle of the adaptive thermal comfort band.
Exposures and other factors that influence occupant perceptions in mixed-mode buildings, such as climate, need to receive additional attention from the research community. Due to the obvious economic benefits that mixed-mode buildings have; they are becoming increasingly more prevalent. Additional attention from the research community is demanded in understanding the thermal comfort in mixed-mode buildings. A pilot study of thermal comfort in mixed-mode office buildings was previously conducted in 2019 (Khoshbakht et al., Citation2019) by authors and a clear distinction in thermal sensation was observed when the system switched between NV and AC modes. This study is a continuation of the previous work by authors to further explore thermal adaptability and comfort in mixed-mode buildings. This present study investigates thermally comfortable conditions in mixed-mode buildings under two modes of operations in warm climate of humid subtropical regions and explores to what extent warmer conditions are acceptable by occupants in these buildings. The study will specifically address:
Occupants’ thermal sensitivity in different ventilation modes.
Occupants’ thermal expectations and predicted percentage of dissatisfaction in different ventilation modes.
Developing an adaptive comfort model for mixed-mode office buildings and compare with ASHRAE 55 standards.
Methods
In order to reflect the changing relationship between occupants, the climate and buildings, post-occupancy evaluation and field studies were selected as a method of study as suggested by previous research (Nicol & Roaf, Citation2005). The study carried out field monitoring campaigns in three mixed-mode buildings located in the subtropical regions in Brisbane and Gold Coast in Australia. The selected offices are representative of office buildings in Australia and particularly in the humid subtropical regions. The criteria for selecting the studied office buildings was mixed-mode ventilation system and green star certifications to have at least an acceptable level of standard in providing a suitable indoor environmental conditions. Right-here-right-now thermal sensation surveys were collected, while indoor environmental conditions were simultaneously recorded.
Context and buildings
Field studies included three mixed-mode buildings located in Southeast Queensland, Australia, 20° 55’ 3.2664'’ S and 142° 42’ 10.0404'’ E, with humid subtropical climate, characterized by hot and humid summers, and mild winters categorized as Cfa based on Koppen climate classification. Located at the southern hemisphere, the buildings’ cooling season starts from late October to late March with the rest of the year suitable for natural ventilation. The annual average high temperature is 26.4 oC and average minimum low temperature is 16 oC (Australian Bureau of Meteorology, Citation2021). Average annual humidity levels range from 50% in winter to 70% in summer, with February being the most humid month (Australian Bureau of Meteorology, Citation2021). The criteria for building selection was ventilation mode and building typology in terms of. three studied buildings were academic offices with mixed-mode ventilation. provides a summary of the characteristics of the three studied buildings. More descriptions of the case studies can be found on the previous paper by Khoshbakht et al. (Citation2019).
Table 1. Summary of the characteristics of the three studied buildings adapted from (Khoshbakht et al., Citation2019).
Ventilation system in case study 1 (B1)
Depending on the mode of operation, the façade of the building opens and allows the building to breath when outdoor climate is suitable. When too hot or too cold, the facade is closed, and all indoor spaces are mechanically ventilated. B1 has rooftop weather stations to monitor outdoor climates. The operation of façade openings and mechanical ventilation is fully controlled by a building management system (BMS). In B1, air is tempered by phase change materials embedded in a thermal labyrinth and is used for water-cooled chillers. The conditioned air is distributed at desks, where users can only change the direction of the air with no on/off switches. In this building, occupants have no control over the adjustment of temperatures.
Ventilation system in case study 2 (B2)
The building has an operable sun shading system that tracks the sun orientation to provide shading for the glass façade and interior spaces. The air flows from the façade of the building to the central atrium across occupied spaces creating a breeze way and discharging warm air through its thermal chimney. The cooling system in B2 consists of evaporative cooling and dehumidification and delivers the air at desk levels at 18 °C and 55% relative humidity. As soon as the temperature goes above 26.5 °C, the BMS triggers the operation of the cooling system, and closes air inlets in windows. However, in B2, users can manually override the ventilation system and switch between natural and mechanical cooling. B2 is also equipped with rooftop weather stations to monitor outdoor climate.
Ventilation system in case study 3 (B3)
In B3, each office has its individual split units for heating, ventilation and cooling, where occupants have full control over operating windows and cooling systems. The individual controls of each office space in B3 allows occupants to set indoor temperatures according to their thermal comfort preferences. Occupants can also completely switch off the cooling system and open windows for natural ventilation. However, the control algorithm is designed to avoid the concurrent operation of natural ventilation and air conditioning. The air conditioning automatically switches off once windows or doors are open.
Questionnaire surveys and environmental measurements
The thermal comfort surveys used in the study included ‘right-here-right-now’ type questionnaires (Manu et al., Citation2016), asking about: 1, thermal sensation and 2, temperature preference. Other relevant information such as date, time, participant gender and age, and location of desks were recorded.
As summarized in , the responses in sensation questions were based on the standard 7-point scale recommended by ASHRAE (ASHRAE Standard, Citation2010), for example, Cold −3, Cool −2, Slightly Cool −1, Neutral 0, Slightly Warm +1, Warm +2, Hot +3. The preference questions asked whether participants prefer any changes to their real time environmental conditions. For example, in the thermal preference question, participants were asked whether they prefer to be cooler, warmer, or have no change. Similarly, questions regarding humidity, air velocity and air freshness asked whether any changes to their sensations were preferred, as shown in .
Table 2. Scale and response options of the real time thermal comfort survey adapted from (Khoshbakht et al., Citation2019).
Table 3. Rating scales for preference questions in the survey questionnaire.
The activity levels of all participants could be categorized as sedentary, representing people who have been sitting behind their working desks for at least 30 min prior to participating in surveys. In total, out of 1,001 responses, only 884 surveys included all the required data and were suitable for analysis. The deleted 117 surveys were response bias surveys, where respondents provided unrealistic answers, for example, they felt cold but wanted the room be cooler. Those responses, also called outliers, were deleted from survey during survey date cleaning. Detailed information about the sample demographics is summarized in . Given the higher education office building settings, gender and age were the two demographic details that were relevant for this research. In total there were 884 participants in this data sample, among which 537 were male and 281 were female.
Table 4. Summary of investigated rooms and subjective evaluations.
The clothing insulation values measured in clo was recorded by the researcher at the time of surveys according to the clothing insulation coding adapted from Kim and de Dear (Kim & de Dear, Citation2018). The clothing insulation of the female participants was about 0.2 clo higher than the male participants in this sample. The average age was 34.7 for male and 35.4 for female participants. The average metabolic rate for both male and female participants was 1.10 representing of sitting sedentary work.
Simultaneously, outdoor climatic data was obtained from Australian Bureau of Meteorology (Australian Bureau of Meteorology, Citation2021). Indoor environmental conditions were also recorded every 5 min during the investigation period from February to July 2017 by one gateway and four motes in each location. provides an illustration of the location of the measurement tools on each building and the investigated spaces on each plan.
Figure 1. An illustration of the location of the measurement tools on building plans, (a) B1, (b) B2 and (c) B3, adapted from (Khoshbakht et al., Citation2019).
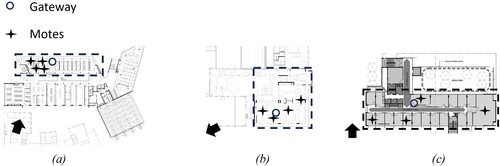
Indoor air temperature (Ta), indoor globe temperature (Tg), and relative humidity (RH) were measured by motes. A detailed summary of measuring equipment and specifications are included in . Instruments were placed on participant working desks at a height of 1.1 m above the floor.
Table 5. Instruments used for indoor environmental quality measurements (Khoshbakht et al., Citation2019).
Results
The results are organized to first provide a detailed analysis of thermal environment conditions of the case study buildings in Section 3.1, followed by analysis of thermal sensitivity in Section 3.2 and analysis of thermal preference and percentage of dissatisfaction in Section 3.3. Finally, the development of an adaptive comfort model is investigated in Section 3.4.
Thermal environmental conditions
A summary of the key indoor and outdoor variables recorded during this study is provided in including air velocity (Va), indoor air temperature (Ta), outdoor air temperature (Ta(out)), indoor operative temperature (Top), prevailing mean outdoor air temperature (Tpma(out)), neutral temperature (Tn), thermal sensation vote (TSV), and comfort temperature (Tcomf). Moderate air speed values ranging between 0.3 and 0.6 m/s with average values of 0.3 m/s was recorded in the buildings during the study. The values for Ta ranged from 19.8 oC to 33.2 oC with an average value of 25.3 oC. Ta(out) was ranged from 16.7 oC to 31.9 oC with an average value of 24.0 oC. The values for Top were calculated by Top = (MRT + Ta)/2 from ASHRAE 55-2020 (ASHRAE Standards, Citation2020), which was ranged from 20.3 oC to 33.6 oC with an average value of 25.8 oC. The values for Tpma(out) represent a 24-hour running mean exponential decay function (De Vecchi et al., Citation2017) ranging from 13.4 oC to 26.1 oC with average value of 20.8 oC. The Tn is derived from ASHRAE 55’s adaptive model of Tn = 0.31 Tpma(out) + 17.8, which represents the estimated temperature that occupants feel neither cold nor warm. The Tn values ranged from 21.9 oC to 25.9 oC with an average value of 24.3 oC.
Table 6. Environmental characteristics of the three mixed-mode buildings.
TSV is the thermal sensation votes of the participants in this sample. Tcomf representing the temperature of comfort is calculated using Griffith method (Manu et al., Citation2016; Mustapa et al., Citation2016) from Tcomf = Top – TSV/ G with Griffith constant (G) of 0.5. The Tcomf values were as low as 16.6°C and as high as 32.1°C with an average value of 26.0°C.
Based on the adaptive thermal comfort model suggested by ASHRAE 55-2020 (ASHRAE Standards, Citation2020), acceptability temperature limits of Top for 80% and 90% of occupants in the studied buildings are specified in . While the majority of the sample, 89% fell within the 80% acceptability range, 10% of the recorded Top fell above the upper limit of the ASHRAE 55. Higher proportion of the sample, 97% fell within the 90% acceptability range with only 3% above the higher temperature limits by ASHRAE adaptive model. These points indicate that the recorded Top values during the studied period were higher than the standards values suggested by ASHRAE.
Table 7. Distribution of the indoor operative temperature according to ASHRAE 55-2020 (ASHRAE Standards, Citation2020) adaptive thermal comfort of 80% and 90% acceptability limits during the survey periods.
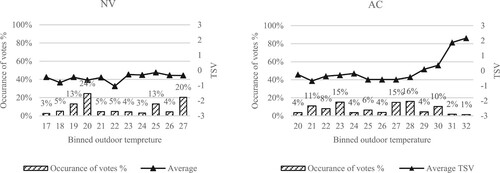
shows people’s votes on a seven-point acceptability scale change as the outdoor temperatures fluctuates and the operation mode switches between NV and AC. Under NV mode, outdoor temperature ranged from 17 oC to 27 oC, while average TSV values remained between −1 and 0 for most of the time. Under AC mode, outdoor temperature ranged from 20 oC to 32 oC, while average TSV values ranged wider between −1 and +2. Although for only a small proportion of time the outdoor temperature reached over 28 oC, but as shown in the figure, TSV values increased as outdoor temperature elevated over 29 oC, which was under AC mode. The buildings were not operated under NV when outdoor temperatures exceeded 27 oC. Another observation from the graph in is that there were some short periods of time when outdoor temperature was over 30 oC that even the air-conditioning systems weren’t able to provide adequate cooling, as demonstrated by TSV >1 when the outdoor temperature is higher than 30 oC under AC mode. This observed dissatisfaction questions the adequacy and the effectiveness of the cooling technologies used in these buildings.
Figure 2. Binned outdoor temperatures and TSV under NV and AC modes.
Thermal sensitivity in different modes
In order to empirically investigate the thermal adaptability, the relationship between TSV and temperature offset from neutral temperature was analysed. To do the analysis, temperature offset from neutral temperature (Tdiff) was determined by calculating the difference between indoor operative temperatures (Top) and neutral temperatures (Tn), Tdiff = Top – Tn. Operative temperature (Top) provides a better reference for understanding thermal responses as it is computed using dry bulb air temperature and mean radiant temperature (i.e. To = (Tmr + Tdb) / 2; where Tdb is dry bulb air temperature and Tmr is mean radiant temperature). For obtaining Tdiff,, neutral temperature is calculated according to the ASHRAE 55’s adaptive model (Tn = 0.31Tpma(out) + 17.8; where Tpma(out) is the prevailing mean outdoor temperature). Tpma(out) is calculated using the weighted 7-day running mean air temperature obtained from the closest Bureau of Meteorology station. The use of temperature offset from neutrality of Tdiff has some advantages over the use of simple room temperatures, because Tdiff also incorporates a number of other influencing factors in thermal comfort such as outdoor climate, season, past and current thermal experiences (de Dear & Brager, Citation2002). In this study, thermal sensations or TSVs were collected for over a long period covering a summer, autumn and winter to include the effect of thermal history in thermal sensations. Tdiff greater than 0 shows that indoor climate is warmer than the neutrality predicted by ASHRAE 55’s Adaptive model, while a negative Tdiff value is regarded as cooler than the neutrality.
Mean TSVs were plotted against binned Tdiff values to determine a linear regression between the two variables, . The sizes of the bubbles indicate the number of cases in each 0.25 °C Tdiff bin. The linear regression model was weighted by the number of TSVs in each Tdiff bin. Equations correlating thermal sensations with temperature differences from neutrality are as the following:
(1)
(1)
(2)
(2) Thermal sensitivity is defined as the change of TSV versus the change of operative temperature (Berglund, Citation1978). Thermal sensitivity can be obtained from the gradients of the regression models (Kim et al., Citation2016). As shown in equations 1 and 2, the gradient of the equations under NV and AC modes was the same, 0.47, so occupants showed same sensitivity to temperature changes under different modes of operation.
Figure 3. Thermal sensation votes regressed with temperature offset from neutrality, Tdiff = Top -Tn.
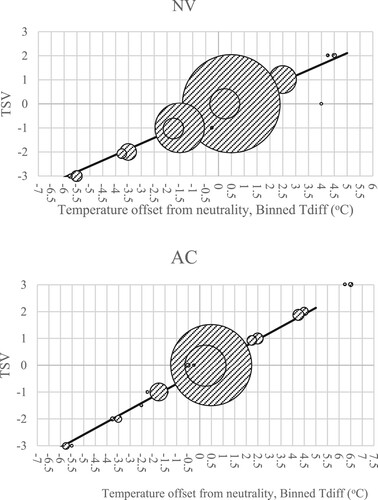
Thermal sensitivity can also be expressed in the form of how much change in the indoor operative temperature would result in one unit change of thermal sensation vote on the 7-point Likert scale. With a change of 2.13 oC in Tdiff, TSV changed one unit on a 7-point scale under both modes of operation. This indicates that occupants were equally tolerant with the indoor thermal variations under different modes of operation.
The neutral temperatures can be calculated by solving the equations Equation1(1)
(1) and Equation2
(2)
(2) for TSV equalling to zero. Under NV mode, the neutral temperature was 0.51 oC, while under AC the neutral temperature was 0.45 oC. This indicates that the neutral temperature in this sample of study in offices was warmer than the neutral temperature predicted by the ASHRAE 55’s adaptive model by 0.51 under NV mode and 0.46 under AC mode. This finding is in line with previous studies that reported overcooling in offices (Chen & Chang, Citation2012).
Thermal comfort expectations
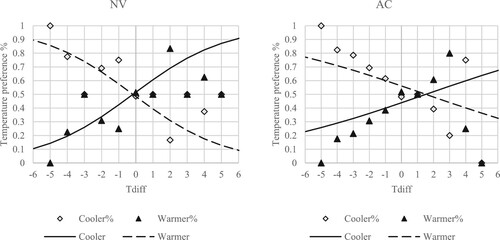
In this survey, thermal preference question asked participants whether they want a change in the temperature, and possible responses were ‘want warmer’; ‘no change ‘; ‘want cooler ‘, as described previously in . An analysis of thermal comfort preferences was conducted to provide a better understanding of indoor thermal perception in the studied buildings. The relationship between how participants felt and how they would like to feel was investigated by correlating thermal preference votes (TP) with thermal sensation votes (TSV). Probit regression models were used to investigate the relationship between TP as the dependent value and TSV as the independent value.
In a probit model, the dependent variable (TP) should be dichotomous, therefore, ‘no change’ votes were equally split into the remaining two categories of ‘want warmer’ and ‘want cooler’ votes, which were in line with previous thermal comfort studies (Kim & de Dear, Citation2018). Separate probit models were fitted to ‘want warmer’ and ‘want cooler’ votes in the thermal preference question and identify the percentage of ‘want warmer’ and ‘want cooler’ votes for the seven TSV values. The fitted probit regression curves show the relative proportion of TP votes for each TSV values from −3 to +3, as shown in . The fitted probit regression models for both categories of TP were statistically significant with p-value less than 0.05 and R-square values of 0.98 for both equations.
Figure 4. Participants’ thermal preferences have changed in response to thermal sensation. The lines show separate probit regression models that were fitted to the respondents’ ‘want cooler’ and ‘want warmer’ preferences.
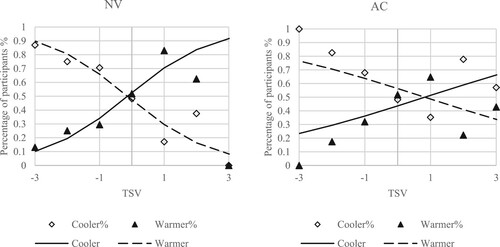
As illustrated in , the percentage of participants preferring to feel cooler increased as participants felt warmer and voted for higher TSV values, while those occupants preferring to feel warmer decreased as TSV votes increased. The point of intersection between the two fitted probit regression curves represents the equal percentage of votes for ‘want warmer’ and ‘want cooler’ votes and is regarded as the most preferred thermal sensation. As shown in the , under NV mode, the intersection of the two curves fell at −0.2, which is slightly cooler than the neutral thermal sensation. Under AC mode, however, the intersection of the two curves fell at +0.8, which is warmer than the neutral sensation and close to ‘slightly warm’ sensation. This indicates that, first of all, participants showed different expectations and preferences under NV and AC modes. Secondly, under AC mode, occupants preferred to feel slightly warmer than neutral.
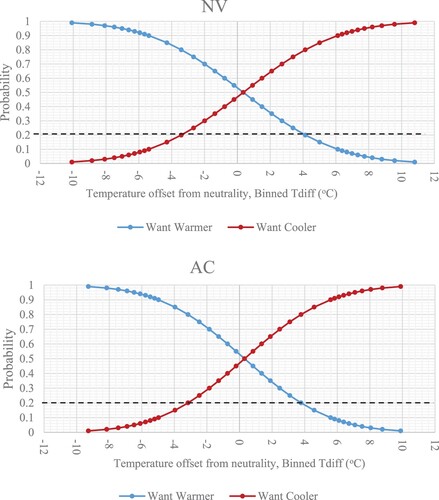
To find out participants’ preferred temperature in NV and AC modes, changes in participants’ TP values were examined in relation to indoor temperature variations, as shown in . As thermal sensations and preferences are different from one person to another, to predict thermal sensations, probit models were used to estimate the probability that certain thermal conditions will cause specific thermal sensations by the majority of occupants. To do the analysis, temperature offset from the neutral temperature (Tdiff) was determined by calculating the difference between indoor operative temperatures (Top) and neutral temperatures (Tn). With the logic used earlier for the 50:50 split of no change votes between ‘want warmer’ and ‘want cooler’, the percentage of participants in the two TP categories, ‘want cooler’ and ‘want warmer’, was plotted against binned Tdiff with 1oC intervals. The preferred temperature occurred when there was equal proportion of ‘want warmer’ and ‘want cooler’ TP votes, which was determined by the intersection between two fitted probit regression curves.
Figure 5. Probit regression of participants’ thermal preference (TP) against the temperature offsets from Neutral temperature (Tdiff).
This sample of responses in mixed-mode buildings showed that, under the AC mode, participants preferred 1.5 oC warmer than the neutral temperature estimated by ASHRAE 55’s adaptive thermal comfort model. Under the NV mode, the preferred temperature was almost the same as the neutrality predicted by ASHRAE 55’s adaptive thermal comfort model. This indicates that participants’ preferred temperature in the NV mode was perfectly aligned with the values predicted by ASHRAE 55’s Adaptive thermal comfort model, whereas participants preferred a slightly warmer temperature when AC was operating. This suggests that the adaptive thermal comfort model was accurate in predicting thermal preference in mixed-mode buildings operated in the NV mode but may not be a strong predictor of thermal preferences in mixed-mode buildings under AC mode.
An analysis of percentage of dissatisfaction was conducted to provide a better understanding of indoor thermal perception in the studied buildings. The relationship between how participants felt and how they would like to feel was investigated by cross-tabulating proportion of dissatisfaction and Tdiff or Temperature offset from neutrality. Probit regression models were used to investigate the relationship between dissatisfaction as the dependent value and Tdiff as the independent value. Thermal acceptability was defined based on the thermal preference (TP) question in . The probability of TP values was analysed against binned Tdiff with 0.25oC intervals. The logic for the 50:50 split of no change votes between ‘want warmer’ and ‘want cooler’ was again used for determining the percentage of participants in the two TP categories, ‘want cooler’ and ‘want warmer’, for binned Tdiff with 0.25oC intervals. The percentage of dissatisfaction was determined for each quarter-degree bin of Tdiff, as illustrated in . The probit regression models of thermal acceptability were statistically significant with p-value less than 0.001 under both operation modes.
Figure 6. The percentage of dissatisfaction in relation to temperature offsets from neutral temperatures (Tdiff).
The percentage of participants ‘want cooler’ increased as Tdiff increased, and the percentage of participants want warmer increased as Tdiff decreased. Thermal acceptability of 80% comfort zone would be the intersection of the horizonal line of 20% and the two probit regression curves in . The range of temperatures at which more than 80% of the occupants accept as thermal comfort was from −3.5 to +4.25 oC under NV mode and −3.25 to +3.75 under AC operation. Therefore, thermal acceptability was only slightly wider under the NV operation. The span of acceptable indoor temperatures for this sample of office buildings was 7.75 oC under NV mode, which is 0.75 oC wider than the width of ASHRAE’s 80% acceptability (ASHRAE Standards, Citation2020). The span of acceptable indoor temperatures for this sample of office buildings was 7 oC under AC mode, which is the same as ASHRAE’s 80% acceptability range.
Occupants in mixed-mode buildings in this sample had a wider range of comfort zone under NV operation which might be due to the higher availability of adaptive opportunities in mixed-mode buildings compared to buildings solely operated with NV. Occupants’ group mean neutral temperature and optimal temperature drifted 0.5oC towards warmer side of the relative temperature scale, compared to that estimated by the ASHRAE 55’s adaptive model and those estimated for residential buildings (Kim et al., Citation2016). Previous studies have shown that thermal acceptability in residential buildings seemed to be wider than those predicted by ASHRAE 55s thermal comfort model, which was correlated to the higher availability of adaptive opportunities in residential settings compared to office buildings.
Developing an adaptive comfort model
To investigate the appropriateness of adaptive thermal comfort model for mixed-mode office buildings, prevailing outdoor temperatures Tpma(out) were correlated with comfort temperatures (Tcomf). To do so, Tcomf was calculated based on Griffith’s method explained in (Rupp et al., Citation2018). A linear regression model was obtained separately for each operation mode. The association between Tcomf and Tpma(out) is graphed in .
Figure 7. The correlation between indoor comfort temperature (Tcomf) and prevailing mean outdoor temperature Tpma(out).
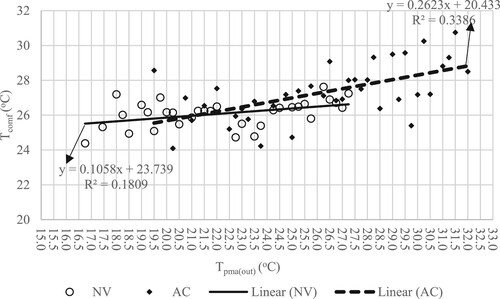
Comfort temperature increased as the prevailing mean outdoor temperature increased under both modes of operation, validating the hypothesis of adaptive comfort model in mixed-mode office buildings. The regression equation defining the relationship between Tcomf and Tpma(out) achieved statistical significance of p-value less than p < 0.05 for both operation modes and the regression equations are as follows:
(3)
(3)
(4)
(4) The next step was to define acceptable temperature limits from Equation 3. As illustrated in , the comfort range for 80% thermal acceptability was 7 oC under NV operation and 7.75oC under AC operation. The 7.75oC for 80% acceptability band under NV operation and 7°C for 80% acceptability band under AC operation, both centred on the neutral temperature in Equation 3, determined upper and lower 80% acceptability limit as follows:
(5)
(5)
(6)
(6) and
(7)
(7)
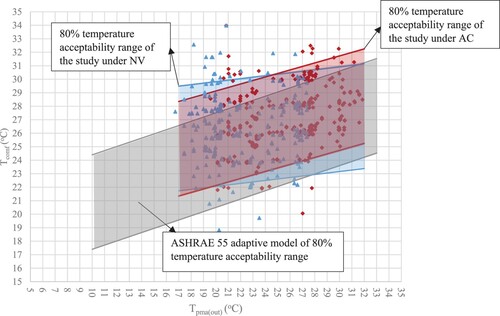
(8)
(8) The 80% acceptability range derived from the current study in office buildings was compared ASHRAE 55’s adaptive standard, as shown in . It should be noted that the comfort temperature in this study is determined within the prevailing mean outdoor temperature of 17–32 °C, which is a typical temperature range for humid subtropical regions. The width of 80% acceptable temperature range in the present study was about 10% wider, 0.75°C, than that model by ASHRAE 55 under NV mode. Under AC operation though, the width of 80% acceptable temperature range was the same as the model by ASHRAE 55. The slope of the equation is also less for NV operations when compared to ASHRAE model. Similar studies were conducted in mixed-mode residential buildings and the temperate comfort range was 30% wider than the model by ASHRAE standard due to higher availability of adaptive opportunities for residents (Kim et al., Citation2016). Kim et al. (Citation2016)’s study was conducted in temperature climate and the comfort zone was shifted down toward lower indoor temperatures, while this study is done in a warmer climate and the comfort zone is shifted slightly towards higher indoor temperatures. This comparison suggests that not only occupants of mixed-mode buildings adapt based on the prevailing outdoor climate, but the availability of adaptive opportunities also has a direct influence on thermal comfort models in mixed-mode buildings. Both this study in office buildings and previous research in residential buildings (Kim et al., Citation2016) suggest that due to the availability of adaptive opportunities, thermal comfort range tend to be wider in mixed-mode buildings than those suggested by ASHRAE 55. However, the comfort range seems to be narrower in office buildings than residential settings because occupants have higher adaptive opportunities in residential buildings than those in office buildings, where indoor environmental qualities are controlled by building control systems.
Figure 8. Comparison of the 80% temperature acceptability range of ASHRAE 55’s Adaptive model and the current study.
This study suggests that more research work is necessary to strengthen the predictability and the applicability of adaptive models in mixed-mode buildings with various adaptive opportunities, residential versus office building, and climatic regions is required to strengthen the predictability of the proposed model and to widen its boundaries.
Discussion
The study showed same sensitivity to temperature changes under different modes of operation as TSV was plotted against temperature difference against neutrality, indicating that occupants of mixed-mode buildings in this study were equally tolerant of the indoor thermal variations under different modes of operation. A recent study (Rupp et al., Citation2022) compared NV and AC buildings showed that occupants in AC offices are about double as sensitive to temperature variations as occupants in NV buildings. The higher sensitivity to temperature variations under AC mode means occupants will feel comfortable in narrower temperature ranges. However, this study confirms that thermal sensitivity is different to those of buildings that only rely on NV or AC. Therefore, as Rupp et al. (Citation2019) also indicated building typologies and building ventilation mode influence occupant thermal sensitivity.
In this study, the neutral temperature was estimated to be about +0.5 oC under both modes of operation. However, the analysis of expected temperatures using probit regression showed that under the AC mode, thermal expectations were 1.5 oC warmer than the neutral temperature estimated by ASHRAE 55’s adaptive thermal comfort model and under the NV mode, the thermal expectations were almost the same as predicted by ASHRAE 55. One recent study also showed that comfort temperatures on average are 1.5 °C warmer than the operative temperature in observed overcooled offices in warm climates (Alnuaimi et al., Citation2022). The developed adaptive thermal comfort model in this study also confirmed that there were a higher proportion of participants that felt indoor conditions were acceptable when it was warmer than neutral. This observation indicates that increasing temperature setpoints under AC modes were preferred by participants, which may also result in significant energy savings in building operations by allowing the heating and cooling setpoint deadband to expand across the full width of the thermal comfort zone. Average reduction in cooling energy demand in warm climates is around 7% for every 1 °C rise in the setpoint temperature as Alnuaimi et al. (Citation2022) reported. In another study based on simulations, it was shown that overcooling in offices leads to 34% more annual cooling energy consumption and 20% higher peak cooling loads. Overcooling which results is dissatisfaction predominantly among women is very likely to affect productivity and health as Indraganti and Humphreys (Citation2021) reported previously.
Expected temperature in this sample of study in offices was 1.5 oC higher than the ASHRAE 55’s adaptive model under AC mode and same as those predicted by ASHRAE 55’s adaptive model under NV mode. This finding is in line with previous studies that reported the domineering overcooling complaint in offices (Chen & Chang, Citation2012). As such, there is growing evidence that the current temperature deadbands that are practiced in offices under AC operations is too narrow and most of the occupants reported being overcooled. As shown in other studies (van Marken Lichtenbelt et al., Citation2017), slightly low or high temperatures in a dynamic thermal environment may not only perceived as pleasant but they may also increase metabolism, thereby targeting obesity by counterbalancing excess energy intake.
In this study, thermal comfort range was 0.75oC higher than those predicted by ASHRAE 55 when the building was operating under NV. As shown in equation 1 and 2, the slope of the equation for NV operation was less than that for AC operation, showing that in this study thermal adaptability was higher when the buildings were operating under AC mode. Kim et al. (Citation2016) showed that thermal comfort ranges in households were wider than those predicted by ASHRAE 55, however, they didn’t compare those according to operation modes. In another Australian study, it was shown that the thermal comfort range was much wider than those predicted by standards (de Dear et al., Citation2015).
In this study, thermal comfort range was wider than those predicted by ASHRAE under NV operations, yet thermal adaptability was less when the building was under NV operation when compared to AC operations and those predicted by ASHRAE 55. Thermal adaptability is supposed to be higher in mixed-mode buildings, yet most mixed-mode office buildings are operating under restricted control algorithms by building management systems that provide limited adaptive opportunities for occupants. Thermal adaptivity in residential buildings seem to be higher than those in office buildings as previous studies reported (Kim et al., Citation2016). This may indicate that building types, being residential or commercial, is an overlooked factor in thermal comfort studies for mixed-mode buildings. The type of activities, clothing, and the use of active systems for tempering indoor climates are different in residential and commercial buildings, and all those factors may greatly influence the development of thermal comfort models for mixed-mode buildings. This also indicates that chamber studies may also be unsuitable for such studies unless all influencing factors such as paying for electricity bills, for active cooling or heating, clothing, activity, the length of stay in rooms and seats, metabolism, etc, are all controlled and accounted for. As this research studied three types of buildings with different mixed-mode control systems, more studies of this kind of nature are needed to optimize thermal comfort and mixed-mode control systems as also suggested by (Kim & de Dear, Citation2021). A study by Khoshbakht et al. (Citation2019), classified mixed-mode buildings based on personal control systems (automated versus manual) and indicated that different control strategies in mixed-mode buildings have a great impact on the thermal environments and building occupants’ thermal perceptions. They emphasized that mixed-mode control strategies are currently an over-looked factor in thermal comfort studies. In a study by Aguilera et al. (Citation2021), it was emphasized that no consensus over control strategies is present in literature for mixed-mode buildings. A control framework for mixed-mode buildings was proposed in their study (Aguilera et al., Citation2021) by using the upper limit of the adaptive comfort zone as cooling set point rather than the upper limit of the PMV based comfort zone, which showed nearly 20% more energy savings and higher occupant satisfaction. Therefore, it is suggested that future studies further investigate and highlight the importance of mixed-mode control strategies in providing more comfortable and energy efficient buildings.
In the current study, the length of workdays and time of the surveys were not recorded, which is one of the limitations. Thermal comfort and preferences are closely related to metabolism and the length of time respondents were seated behind their desks (Costantino et al., Citation2023). Overlooking metabolism may cause biases in the data and it is recommended to be avoided in future studies. It is suggested that for future, the length of workdays and the time of surveys to be collected and analysed to investigate whether thermal comfort and preferences change throughout the entire workday. A large proportion of buildings’ energy load is used to provide thermal comfort for occupants (Yang et al., Citation2014). The use of appropriate and suitable thermal comfort models, not only create a more productive and healthy environments for occupants, but also increases buildings’ energy efficiency (Hu et al., Citation2023). Mixed-mode buildings by relying on natural ventilation help with reducing energy loads for buildings, yet the use of appropriate thermal comfort model will further enhance sustainability by using less energy for cooling in buildings without sacrificing comfort. Due to the nature of window opening and the use of AC, occupants in mixed-mode buildings are exposed to even a wider range of indoor temperatures than NV buildings, where ATC models were developed (Peng et al., Citation2023). Appropriate technologies, occupant habits, and building standards are the main components in providing the most efficient thermal environment for occupants (Gram-Hanssen, Citation2010).
This study emphasizes on the development and use of different thermal comfort models when switching between NV and AC modes even within the same day. The findings of this study imply not only to building occupants but also to building managers for revising how the indoor environmental quality in mixed-mode buildings should be controlled. The current architectural design practice provides little information about how mixed-mode buildings should be controlled and managed. This type of studies based on empirical results provides a good opportunity for building designers and managers to get feedback from building users about their preferences and best comfort conditions.
Conclusion
This research provided a better understanding of thermal expectations and perceptions in buildings with mixed-mode ventilation particularly in humid subtropical climates. A large field survey of thermal comfort in Australian office buildings was conducted during summer, fall and winter. The neutral temperature was estimated to be about 0.5 oC higher than the predicted neutral temperature by ASHRAE 55 under both modes of operation. Thermal sensitivity was the same under different modes of operation. The analysis of expected temperatures using probit regression showed that under the AC mode, thermal expectations were 1.5 oC warmer than the neutral temperature estimated by the ASHRAE 55. Under the NV mode, the thermal expectations were almost the same as predicted by the ASHRAE 55. Thermal comfort range was 7.75 oC wide under NV operation and 7 oC wide under AC operation. Thermal comfort range was 0.75 oC wider than those predicted by ASHRAE under NV operation. Thermal comfort range had the same width than those predicted by ASHRAE under AC operation. Thermal adaptability was lower when the building was under NV operation when compared to AC operations and those predicted by ASHRAE 55 due to the limited adaptive opportunities in mixed-mode office buildings.
Ethics
The study of the human research participants was approved by Ethics Committee at Griffith University (2016/111).
rbri_a_2256430_sm1013.pdf
Download PDF (60.3 KB)Acknowledgements
This research was supported by Griffith University as part of a higher degree research program.
Disclosure statement
No potential conflict of interest was reported by the author(s).
Additional information
Funding
References
- Aguilera, J. J., Bogatu, D. I., Kazanci, O. B., Angelopoulos, C., Coakley, D., & Olesen, B. W. (2021). Comfort-based control for mixed-mode buildings. Energy and Buildings, 252, 111465. https://doi.org/10.1016/j.enbuild.2021.111465
- Alnuaimi, A., Natarajan, S., & Kershaw, T. (2022). The comfort and energy impact of overcooled buildings in warm climates. Energy and Buildings, 260, 111938. https://doi.org/10.1016/j.enbuild.2022.111938
- ASHRAE Standard. (2010). Standard 55-2010:“Thermal environmental conditions for human occupancy”; ASHRAE.
- ASHRAE Standards. (2020). Ansi/ASHRAE 55-2020: Thermal environmental conditions for human occupancy. American National Standards Institute, American Society of Heating, Refrigerating and Air-Conditioning Engineers.
- Australian Bureau of Meteorology. (2021). “Climate data online.” from http://www.bom.gov.au/.
- Australian Institute of Refrigeration Air Conditioning and Heating. (2015). Space temperature set point and control bands. HVAC & R Nation., Module 4.
- Berglund, L. (1978). Application of acceptable temperature drifts to built environments as a mode of energy conservation. ASHRAE Transactions, 84), Part1.
- Brager, G. S., & de Dear, R. (1998). Thermal adaptation in the built environment: A literature review. Energy and Buildings, 27(1), 83–96. https://doi.org/10.1016/S0378-7788(97)00053-4
- Brager, G., Zhang, H., & Arens, E. (2015). Evolving opportunities for providing thermal comfort. Building Research & Information, 43(3), 274–287. https://doi.org/10.1080/09613218.2015.993536
- Chen, A., & Chang, V. W.-C. (2012). Human health and thermal comfort of office workers in Singapore. Building and Environment, 58, 172–178. https://doi.org/10.1016/j.buildenv.2012.07.004
- Costantino, A., Ferrara, M., Arnesano, M., & Fabrizio, E. (2023). Off-the-shelf wearable sensing devices for personalized thermal comfort models: A systematic review on their use in scientific research. Journal of Building Engineering, 106379.
- de Dear, R., & Brager, G. (2002). Thermal comfort in naturally ventilated buildings: Revisions to ASHRAE standard 55. Energy and Buildings, 34(6), 549–561. https://doi.org/10.1016/S0378-7788(02)00005-1
- de Dear, R., Kim, J., Candido, C., & Deuble, M. (2015). Adaptive thermal comfort in Australian school classrooms. Building Research & Information, 43(3), 383–398. https://doi.org/10.1080/09613218.2015.991627
- De Vecchi, R., Candido, C., de Dear, R., & Lamberts, R. (2017). Thermal comfort in office buildings: Findings from a field study in mixed-mode and fully-air conditioning environments under humid subtropical conditions. Building and Environment, 123, 672–683. https://doi.org/10.1016/j.buildenv.2017.07.029
- Deuble, M. P., & de Dear, R. J. (2012). Mixed-mode buildings: A double standard in occupants’ comfort expectations. Building and Environment, 54, 53–60. https://doi.org/10.1016/j.buildenv.2012.01.021
- Drake, S., de Dear, R., Alessi, A., & Deuble, M. (2010). Occupant comfort in naturally ventilated and mixed-mode spaces within air-conditioned offices. Architectural Science Review, 53(3), 297–306. https://doi.org/10.3763/asre.2010.0021
- Fanger, P. O. (1970). Thermal comfort. Analysis and applications in environmental engineering. Thermal Comfort. Analysis and Applications in Environmental Engineering.
- Fiorentini, M., Serale, G., Kokogiannakis, G., Capozzoli, A., & Cooper, P. (2019). Development and evaluation of a comfort-oriented control strategy for thermal management of mixed-mode ventilated buildings. Energy and Buildings, 202, 109347. https://doi.org/10.1016/j.enbuild.2019.109347
- Gram-Hanssen, K. (2010). Residential heat comfort practices: Understanding users. Building Research & Information, 38(2), 175–186. https://doi.org/10.1080/09613210903541527
- Hu, M., Zhang, K., Nguyen, Q., & Tasdizen, T. (2023). The effects of passive design on indoor thermal comfort and energy savings for residential buildings in hot climates: A systematic review. Urban Climate, 49, 101466. https://doi.org/10.1016/j.uclim.2023.101466
- HVAC HESS. (2012). Guide to best practice maintenance and operation of HVAC systems for energy efficiency: 36–37.
- Indraganti, M., & Humphreys, M. A. (2021). A comparative study of gender differences in thermal comfort and environmental satisfaction in air-conditioned offices in Qatar, India, and Japan. Building and Environment, 206, 108297. https://doi.org/10.1016/j.buildenv.2021.108297
- Jia, X., Cao, B., Zhu, Y., & Liu, B. (2020). Thermal comfort in mixed-mode buildings: A field study in Tianjin, China. Building and Environment, 185, 107244. https://doi.org/10.1016/j.buildenv.2020.107244
- Kazanci, O. B., & Olesen, B. W. (2013). The effects of set-points and dead-bands of the HVAC system on the energy consumption and occupant thermal comfort. Climamed'13-7. Mediterranean congress of climatization proceedings book.
- Khoshbakht, M., Gou, Z., & Zhang, F. (2019). A pilot study of thermal comfort in subtropical mixed-mode higher education office buildings with different change-over control strategies. Energy and Buildings, 196, 194–205. https://doi.org/10.1016/j.enbuild.2019.05.030
- Kim, J., & de Dear, R. (2018). Thermal comfort expectations and adaptive behavioural characteristics of primary and secondary school students. Building and Environment, 127, 13–22. https://doi.org/10.1016/j.buildenv.2017.10.031
- Kim, J., & de Dear, R. (2021). Is mixed-mode ventilation a comfortable low-energy solution? A literature review. Building and Environment, 205, 108215. https://doi.org/10.1016/j.buildenv.2021.108215
- Kim, J., de Dear, R., Parkinson, T., Candido, C., Cooper, P., Ma, Z., & Saman, W. (2016). Field study of air conditioning and thermal comfort in residential buildings. 9th international Windsor conference: Making comfort relevant, 1023–1040.
- Luo, X., Eftekhari, M., Durrani, F., & Kanhirothkandi, D. M. (2019). Predicting thermal comfort in mixed-mode office building in the UK. ASHRAE Transactions, 125(1), 158–167.
- Manu, S., Shukla, Y., Rawal, R., Thomas, L. E., & de Dear, R. (2016). Field studies of thermal comfort across multiple climate zones for the subcontinent: India model for adaptive comfort (IMAC). Building and Environment, 98, 55–70. https://doi.org/10.1016/j.buildenv.2015.12.019
- Mustapa, M. S., Zaki, S. A., Rijal, H. B., Hagishima, A., & Ali, M. S. M. (2016). Thermal comfort and occupant adaptive behaviour in Japanese university buildings with free running and cooling mode offices during summer. Building and Environment, 105, 332–342. https://doi.org/10.1016/j.buildenv.2016.06.014
- Nicol, F., & Roaf, S. (2005). Post-occupancy evaluation and field studies of thermal comfort. Building Research & Information, 33(4), 338–346. https://doi.org/10.1080/09613210500161885
- Nicol, J. F., & Roaf, S. (2017). Rethinking thermal comfort. Taylor & Francis, 45, 711–716.
- Peng, Y., Antanuri, N., Lau, S.-K., Jebelli, B., Jusuf, S. K., Miller, C., Teo, Y. T., Chua, Y. X., & Chong, A. (2023). Experimental assessment of thermal and acoustics interactions on occupant comfort in mixed-mode buildings. Building and Environment, 110342.
- Rupp, R. F., de Dear, R., & Ghisi, E. (2018). Field study of mixed-mode office buildings in southern Brazil using an adaptive thermal comfort framework. Energy and Buildings, 158, 1475–1486. https://doi.org/10.1016/j.enbuild.2017.11.047
- Rupp, R. F., Kim, J., Ghisi, E., & de Dear, R. (2019). Thermal sensitivity of occupants in different building typologies: The Griffiths constant is a variable. Energy and Buildings, 200, 11–20. https://doi.org/10.1016/j.enbuild.2019.07.048
- Rupp, R. F., Parkinson, T., Kim, J., Toftum, J., & de Dear, R. (2022). The impact of occupant's thermal sensitivity on adaptive thermal comfort model. Building and Environment, 207, 108517. https://doi.org/10.1016/j.buildenv.2021.108517
- van Marken Lichtenbelt, W., Hanssen, M., Pallubinsky, H., Kingma, B., & Schellen, L. (2017). Healthy excursions outside the thermal comfort zone. Building Research & Information, 45(7), 819–827. https://doi.org/10.1080/09613218.2017.1307647
- Yang, L., Yan, H., & Lam, J. C. (2014). Thermal comfort and building energy consumption implications – A review. Applied Energy, 115, 164–173. https://doi.org/10.1016/j.apenergy.2013.10.062