
ABSTRACT
This article reports on a mixed-method longitudinal field study that was conducted using a tablet-based app capturing data on patients’ satisfaction with an outpatient clinic in Kalungu District, Uganda. The app was developed, piloted, and refined using clinician and patient feedback. Findings were reported and discussed in staff meetings, with change in reported levels of satisfaction assessed using descriptive statistical analysis and Chi2 tests. Qualitative data were collected. Satisfaction was relatively high at baseline and increased by 4.4%, and staff found the feedback actionable. Patients reported fewer delays and better treatment after introducing the app, with the proportion of “very dissatisfied” patients decreasing from 2.3% to zero after six weeks.
Background
In low-income settings, much attention has been given to the importance of increasing the availability and accessibility of health services, but insufficient focus has been paid to assessing their quality (Batbaatar et al. Citation2015). Only recently has patient satisfaction with healthcare interactions been conceptualised as a factor influencing confidence and future care-seeking behaviours (Andaleeb Citation2011; Svoronos, Macauley, and Kruk Citation2014; Vian et al. Citation2015).
Evaluation of patient satisfaction can contribute to improving healthcare services and provider behaviour by identifying and addressing issues important to the patient (Andaleeb Citation2001; Batbaatar et al. Citation2015; Mpinga and Chastonay Citation2011). Monitoring the association between satisfaction, health outcomes, and changes in clinical care is important yet the evidence base for the mechanism through which patient perspectives causes change must be more clearly conceptualised and evaluated (Dang et al. Citation2013). After collecting baseline data on satisfaction, patients in Lesotho reported improvements in care and decreased waiting times for treatment (Vian et al. Citation2015). There is, however, concern within the medical community that focusing on patient-identifiable issues decreases the attention to clinic care and safety, which may be more difficult, if not impossible, for the patient to comment on (Black Citation2013).
There is also confusion and debate about what types of data to collect, how to gather them, and perhaps most importantly, how healthcare providers can utilise them (Black Citation2013; Coulter et al. Citation2014). The effect of reporting patient experience to providers has shown mixed results at best (Al-Abri and Al-Balushi Citation2014). One continual challenge is how to integrate patient perspective into clinical practice in a way that is feasible and sustainable (Black Citation2013; Coulter et al. Citation2014; Dang et al. Citation2013).
While various generic and disease-specific tools exist to retrospectively measure patient satisfaction with healthcare (Black Citation2013; Onwujekwe, Etiaba, and Oche Citation2015), there is little evidence capturing patients’ level of satisfaction immediately after their visit, in an easy to access location and in a spontaneous manner. Unlike exit interviews or questionnaires, which require more reflection and recall, capturing a “fast” real-time response has not been studied before in healthcare settings in low-income countries (Kahneman Citation2011). This rapid method of collecting feedback may allow greater validity than traditional measures because of the high response rate, as well as being anonymous and responses being less inhibited than may occur in an exit interview. Feedback can also connect back to the clinic processes quickly to alert staff to issues like stock-outs.
Patient satisfaction is, however, only one element of good-quality health care. In Donabedian’s text, quality is broken down into three main domains: structure, process, and outcome (Donabedian Citation1988). The tool developed for this study focuses on the interpersonal aspects of process and on the structural component of patient satisfaction.
We hypothesised that immediate, patient-initiated, anonymous feedback using an app may capture candid sentiments about patients’ satisfaction with a clinic visit. We predicted that regular updates on performance would motivate healthcare providers to improve care, and thereby improve patient satisfaction.
The study had four main objectives:
To develop a tool which could capture patient satisfaction upon leaving a clinic with a feedback loop to staff.
To capture patients’ satisfaction immediately upon leaving the clinic.
To evaluate change in levels of satisfaction over time and explore if the app was perceived to influence patient satisfaction or healthcare provider behaviour.
To capture staff and patients’ feelings and opinions on the usefulness of the app.
Methods
The mixed-method longitudinal field study was conducted in three main stages: development, refinement, and piloting. Data collected during these phases included feedback from staff at consultation meetings, the patient satisfaction (PS) app, participant observations, and focus group discussions (FGDs) with healthcare workers and patients. Discussions with staff, field notes during piloting, and FGDs generated qualitative data, while the app generated quantitative data.
Ethical approval: This study was approved by the Uganda Virus Research Institute Research Ethics Committee and the Uganda National Council for Science and Technology.
Study site and population: The study was conducted at an outpatient primary healthcare clinic attached to a research organisation study site in Kalungu district of central Uganda. The clinic offers services for maternal and child health, malaria, certain common chronic diseases like hypertension, among other primary care needs. Approximately 20,000 people living in the surrounding area are eligible for free healthcare. The site, situated 40 kilometres from Masaka, the closest town, is rural and most residents in the area earn an income through the production and sale of agriculture produce and small-scale trade.
Development: The study team originally planned on collecting data on satisfaction with care received in a clinic and the type of sexual and reproductive health services that people wanted and could access. In early discussions with staff, it became clear that patients would be hesitant to provide personal information on tablets, to which they were unaccustomed. Therefore, rather than ask for detailed information about demographics, health interventions, and potentially stigmatising data on disease status, the study team decided that the tool and pilot phase of the research should be used to create familiarity with the tablets and the app and build trust within the community. In order to build confidence and encourage its use, the app was kept brief. By prioritising patient trust over collecting more detailed and robust data, we knowingly limited our ability to adjust for bias and confounders. However, given that this was a pilot study intended to gauge the feasibility and acceptance of novel technology, patient confidence was paramount.
Original tool: The app was constructed in two parts. Patients first select their overall level of satisfaction on a four-point scale ranging from “very satisfied” to “very dissatisfied”. A neutral option was not given because their positive or negative response directed them to follow-up questions. Depending on their answer, patients were taken through a pre-determined list of explanations as to why their visit was either satisfying or dissatisfying. For each item, patients indicate whether they agree or disagree. See for the list of reasons for satisfaction or dissatisfaction with their clinic visit.
Refinement: A Ugandan research assistant went to the clinic to get feedback from the clinic staff and patients. Before introducing the concept and draft of the app to the staff, she met with a clinic leader who advised that illiteracy and lack of exposure to technology in the area would be an obstacle. He also advised that to be acceptable to both staff and patients, confidentiality would need to be emphasised. He predicted that staff may feel they were being professionally evaluated and that patient would have concerns that their feedback would be reported to their clinician.
Seventeen staff members attended the meeting where the app was introduced and demonstrated. A social scientist took meeting minutes. A reoccurring concern was that staff felt they personally might be negatively assessed if the clinic is running late, which is reflective of clinic processes more than their professional skill or efficiency. It was reiterated that the study was trying to assess whether providing feedback can improve satisfaction, not to evaluate staff. They also suggest that questions be open-ended. The research team was unable to accommodate this suggestion due to low literacy among service users and technological limitations. While it may have been possible in a research setting, it would not have been a feasible or reproducible tool that clinics in low-income settings with limited human or technological resources could have implemented. Staff also suggested that people would not know how to use a tablet and that there should be demonstrations each day.
The list of reasons for (dis)satisfaction was supplemented based on discussions with staff. Originally, the four-point scale was intended to be presented using emoticons on a smile to frown continuum. Patients reported that the big (“very satisfied”) smile was perceived as being sarcastic. Therefore, the clearest representations of satisfaction were determined to be a “√√”, “√”, “x”, “xx” scale, changing colours from green (“very satisfied”) to red (“very dissatisfied”).
Piloting: Many suggestions were taken on board and changes made. An instructional DVD was made and played in the waiting room to familiarise patients with the tool. To ensure that low-literate people were included, a local language audio recording of all answers was produced and headphones provided. The app was loaded onto six tablets; five were mounted in a tent for people to use as they exited the clinic and one was used for demonstrations. The tablets were spaced apart to increase respondents’ privacy. A social scientist was stationed in the tent and available to assist when needed. Patients were invited to give feedback after each clinic visit so some people provided feedback more than once. Any comments, questions, or concerns were written down for later analysis and study and app improvement.
All adult patients were eligible to use the app, as were children attending appointments independently. Parents or guardians who brought sick children into the clinic responded based on their satisfaction with how they and their child were treated. No demographic or identifying information was collected. is a screenshot of the first question on the app, which was deemed as most appropriate in the pre-test, and was well-understood with the accompanying local language voice-over.
Figure 1. Screenshot of the patient satisfaction app.
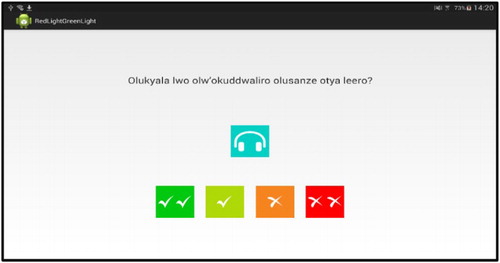
Table 1. Reasons for satisfaction/dissatisfaction.
Each Monday the research team emailed all clinical staff the results from the preceding week. Each email reminded staff about the study, reported how many people gave feedback, the levels of reported satisfaction, and gave two pie charts breaking down the reasons for satisfaction and dissatisfaction. The emails narratively summarised the two issues receiving the best and most critical feedback. Every other week, staff held meetings to discuss the feedback and decide what could be done to address concerns. Staff also posed questions to the research team for how they wanted the data interrogated in order to help understand which factors may have contributed to variable levels of satisfaction. The social scientist took detailed field notes during these meetings and sent summaries to the team for later analysis.
Following the completion of the study three focus group discussions were held: one each with female, male, and clinic staff, with eight, six, and five people, respectively.
Quantitative data and analysis: All quantitative data collected during the pilot using the app were exported to an Excel spreadsheet and analysed using STATA v14. A descriptive analysis was performed to include frequencies. Chi2 tests were used to compare categorical variables (time of day and satisfaction scores) where appropriate. A statistically significant result was present if p < 0.05.
The primary outcome was change in reported patient satisfaction level over time. It is an ordinal variable, scored “very satisfied”, “satisfied”, “dissatisfied”, or “very dissatisfied”. As baseline satisfaction was high, when multivariate analysis was conducted the variable was recoded as binary; “very satisfied” was kept as one category while the others were combined. To measure the association between the dependent binary variable, satisfaction score (very positive or not very positive) and independent variables (number of days, time of day), logistic regression was used for both univariate and multivariate analysis.
Qualitative data collection and analysis: Qualitative data were analysed by hand using a coding framework and explored the usability of the PS app and the tablets, and whether patients and staff believed the tool helped to improve quality of care.
Results
In all, 1,904 patients started to use the PS app. Sixteen (0.8%) did not finish it, leaving 1,888 complete responses to analyse from the six weeks. Over time, the proportion of patients who were “very satisfied” increased from 72% in week one to 76.4% in week six. The proportion of “very dissatisfied” decreased from 2.3% in week one to 0% in week six ().
Figure 2. Satisfaction scores as percentage stacked bars, by day.
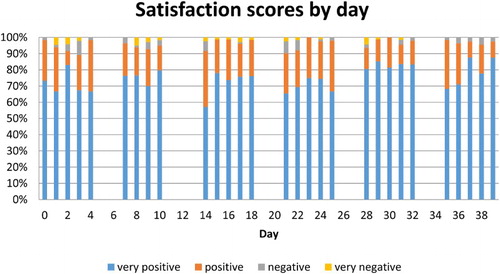
Over time, the odds of being “very satisfied” increased after adjusting for completing the app before or after 12 noon (). The increased odds of satisfaction as a result of change in one day are small, and the confidence interval for the odds ratio expressed to two decimal places includes 1.00. However, these results are unlikely to have occurred by chance, as the confidence interval is very narrow and the p-value is low (0.032). Time of day was included in the model because the proportion of very satisfied scores was significantly lower after 12 noon (chi2 = 8.08, p = 0.004). Typically, patients arrive early in the morning and wait to be seen. Patients who completed the app in the afternoon were less likely to be “very satisfied”. According to the predictions estimated by the logistic regression model, the probability of being very satisfied increased linearly over time from 73% at day 0 to 79.8% at day 39.
Table 2. Result of logistic regression model of binary satisfaction score adjusted for morning/afternoon.
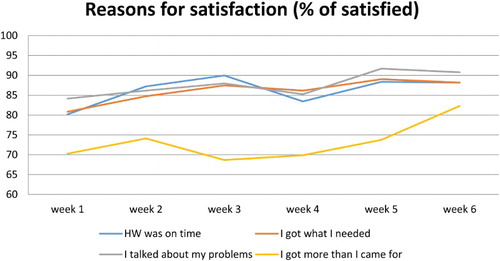
The frequency of reasons for satisfaction over time are shown in . The biggest increase was in the response “I got more than I came for”, especially in week six.
Figure 3. Reasons for satisfaction by week, as percentage of all participants.
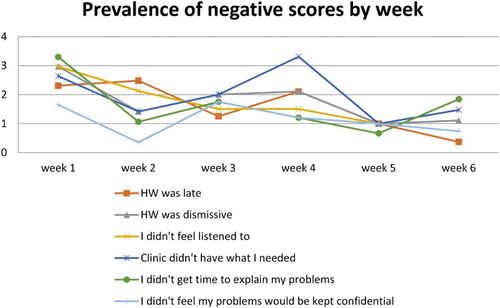
The PS app was sufficiently robust and sensitive to detect systemic challenges within the clinic. For example, when certain blood pressure medicines were unavailable in week four, patient dissatisfaction with “they didn't have what I needed” rose ().
Figure 4. Reasons for dissatisfaction by week, as percentage of all participants.
Staff perspectives: Prior to the study there was no system in place for patients to express their feelings and for staff to receive feedback. When patients gave feedback informally, staff felt the comments were unfair, attacking, personal in nature, or groundless. The staff valued and enjoyed the systematic and clinic-level feedback provided by the app and appreciated that they were able to understand better what patients wanted without being personally identified.
Through the feedback meetings with staff, problems and potential solutions were discussed, including introducing a patient triage system and better use of medical records. The PS app also encouraged discussions about stigma, particularly related to disease status and people’s fear of being identified as being HIV-positive by other patients or clinicians in their community.
The wording on some of the responses was felt to require further clarification. For example, staff wanted to know what was meant by “staff was late” as there are no set appointment times. They also wanted to know how patients interpreted “I did not get what I came for”. Despite assurances, staff were concerned they were being evaluated negatively for not being able to distribute medicines which were out of stock.
Patient perspectives: In both FGDs, patients were very enthusiastic about the app and encouraged others to participate in the study and provide honest feedback. They valued the tool for differing reasons: some liked being able to show their appreciation of receiving healthcare, while others felt empowered by having a mechanism to air grievances. The primary perceived benefits included feeling increasingly in control, decrease in delays, and faster service at medicine dispensing.
A few people who had had negative experiences and consequently no longer came to the clinic were drawn back into care. One man in a focus group said:
“My paternal grandmother had stopped coming to the clinic because of the too much delay that is here and she hated spending the whole day at the clinic. She stopped coming, yet she was on treatment for hypertension. But when she heard about the computers, she asked us to bring her for treatment because of the computer, because she now sees that there is immediate attention and speed. The level of customer care is now high.”
Discussion
Despite its importance, there is no unified body of scholarship on health provider accountability (Berlan and Shiffman Citation2012). Through our qualitative data, we can begin to understand potential mechanisms through which providing and receiving feedback may influence provider behaviour and patient satisfaction. This is particularly important when fiscal incentives are impossible or unsustainable. One mechanism could be simple sensitisation to the patient’s experience. Because the PS app asked reasons why a visit was satisfying or dissatisfying, the feedback was actionable and directive. When issues raised laid within the purview of management, the app elucidated which clinic-wide processes, like triage and medication re-ordering, needed to be assessed. Another possible mechanism by which satisfaction may have improved was through providing a forum to discuss broader issues, like stigma. These solutions may be more sustainable than those imposed from outside, as they were generated by the staff with resources available to them.
In this study, we could show that collecting feedback from patients and reporting it to staff was associated with increased patient satisfaction. Baseline satisfaction was high and so it was difficult to show substantial improvements over time. As Berlan and Shiffman show in their review of provider accountability in developing countries, NGOs, like where this study was conducted, are generally more focused than government clinics on improving equitable access to the poor (Berlan and Shiffman Citation2012). We would expect a larger improvement at a government clinic where baseline levels of satisfaction may be lower, assuming comparable levels of staff motivation and buy-in. In a review of private and public ambulatory care in low- and middle-income countries, private care (non-government provided care, whether for profit or not), patients indicated better communication, listening, access to services, and respectful treatment in private centres. This is important, as patients are more likely to return for care to places where they felt they were treated well. This has long-term implications as low- and middle-income countries have a greater burden of non-communicable disease which require more consistent contact with health services (Berendes et al. Citation2011). Local government officials have also approached the clinic where this research was conducted asking to use the app in government-run health facilities.
There were originally concerns expressed by both patients and staff that many people would use the app to falsely accuse health workers of maltreatment. While some patients did want to be able to specify who they saw, it was often in order to express gratitude. There was also the sense that the app was exclusively about evaluating staff and not the clinic itself. Some patients felt it was unfair to “blame” staff for not dispensing medicine that was unavailable at the time. It may be important in future iterations, to de-emphasise the role of staff and ask people to evaluate their visit more broadly to be able to improve a spectrum on influences on the clinic experience, including structural and procedural issues.
There are multiple sources of potential bias in this study. First, in order to minimise barriers to participation we did not collect demographic or health-related data. However, given the research activity at the site, including a longitudinal population cohort, the overall demographic and health status of the population is known. Second, it is possible that the high levels of satisfaction observed were influenced by a social desirably bias and respondents not wanting to appear ungrateful to the people who care for them (Bernhart et al. Citation1999). Third, we are unable to report on the percentage of clinic attendees who refused to use the app each day as the clinic does not maintain attendance records. However, by placing the tablets by the clinic exit and having a social scientist stationed there throughout each day, we can report that acceptability was high and overall refusals were low and decreased over the duration of the study. Finally, bias may have arisen from the most ill patients being the least able to complete the app. Because we were unable to collect more detailed data about the respondents, including potential confounders, this study could be easily improved before being replicated.
There was a substantial barrier to overcome in introducing the app in this setting given people’s unfamiliarity with and low level of confidence using such novel technology. Despite making an instructional DVD, holding daily presentations, and having a study team member by the tablets all day some people, particularly the elderly, needed substantial assistance. Therefore, this was not an intervention which could be left to collect data without some investment in human resources in similar settings. We predict that in urban, more literate settings with high touch-screen technology exposure there would be less need for such intensive teaching and encouraging, and shorter community learning time.
In this study, technology served both as a help and a hindrance. People were excited to see “computers” (tablets) and some parents even reported that their children wanted to study computer science when they were older after seeing them for the first time through the study. The community-level excitement generated by the tablets served as an incentive for some people to return to clinic services. Some patients re-engaged with care, not expressly because of the tablets or the app, but because of their belief that the study’s presence had improved the quality of care and the assurance that there was a way to report a problem should one occur.
Conclusion
This pilot longitudinal field study demonstrates a promising way to measure patient satisfaction and improve patient experience by gaining a better understanding between patients and healthcare workers. It was not invented to measure all aspects of quality of care but can provide patients with a confidential and non-confrontational way to express their concerns and for healthcare providers to “hear” them. Through this pilot we also learnt that the tool helped clinic mangers to improve internal processes and to be responsive more quickly. When replicated, it would be useful to collect more detailed respondent data to clarify the relationship between the intervention and outcome and increase generalisability. If appropriate, it could also be used in different health care settings to examine whether collecting data can improve uptake of important health services like prenatal check-ups or childhood vaccinations. If replicated in urban settings, there may be less need for detailed explanations and demonstrations on using touch-screen technology, making the intervention more cost-effective. However, this study is a useful starting place and shows promise for measure this important aspect of quality of care.
Acknowledgements
The study team would like to thank the MRC/UVRI for hosting this study and participants for sharing their experiences with us.
Disclosure statement
No potential conflict of interest was reported by the authors.
Notes on contributors
Emily Warren is a Research Fellow at the London School of Hygiene & Tropical Medicine, London, UK.
Ethel Nankya is a Fellow in infectious diseases at Boston Medical Centre, USA, and holds an MSc in Tropical Medicine and International Health from the London School of Hygiene & Tropical Medicine.
Janet Seeley is head of the Social Aspects of Health Programme at the MRC/UVRI Uganda Research Unit on AIDS, Entebbe, Uganda and a Professor of Anthropology and Health, London School of Hygiene & Tropical Medicine.
Sarah Nakamanya is a Social Science Field Supervisor at MRC/UVRI Uganda Research Unit on AIDS, Entebbe, Uganda.
Gershim Asiki is part of the MRC/UVRI Uganda Research Unit on AIDS, Entebbe, Uganda.
Victoria Simms is an Assistant Professor in Epidemiology at the London School of Hygiene & Tropical Medicine.
Alex Karabarinde is part of the MRC/UVRI Uganda Research Unit on AIDS, Entebbe, Uganda.
Heidi Larson is a Professor of Anthropology, Risk and Decision Science at the London School of Hygiene & Tropical Medicine, London, UK and Associate Clinical Professor at the University of Washington, Seattle, USA.
Additional information
Funding
References
- Al-Abri, R., and A. Al-Balushi. 2014. “Patient Satisfaction Survey as a Tool Towards Quality Improvement.” Oman Medical Journal 29 (1): 3–7. doi: 10.5001/omj.2014.02
- Andaleeb, S. 2001. “Service Quality Perceptions and Patient Satisfaction: A Study of Hospitals in a Developing Country.” Social Science & Medicine 52 (9): 1359–1370. doi: 10.1016/S0277-9536(00)00235-5
- Batbaatar, E., Javkhlanbayar Dorjdagva, Ariunbat Luvsannyam, and Pietro Amenta. 2015. “Conceptualisation of Patient Satisfaction: A Systematic Narrative Literature Review.” Perspectives in Public Health 135 (5): 243–250. doi: 10.1177/1757913915594196
- Berendes, S., Peter Heywood, Sandy Oliver, Paul Garner, and Rachel Jenkins. 2011. “Quality of Private and Public Ambulatory Health Care in Low and Middle Income Countries: Systematic Review of Comparative Studies.” PLoS Medicine 8 (4): e1000433: 1–10. doi: 10.1371/journal.pmed.1000433
- Berlan, D., and J. Shiffman. 2012. “Holding Health Providers in Developing Countries Accountable to Consumers: A Synthesis of Relevant Scholarship.” Health Policy and Planning 27 (4): 271–280. doi: 10.1093/heapol/czr036
- Bernhart, M.H., I.G.P. Wiadnyana, Haryoko Wihardjo, and Imbalos Pohan. 1999. “Patient Satisfaction in Developing Countries.” Social Science & Medicine 48 (8): 989–996. doi: 10.1016/S0277-9536(98)00376-1
- Black, N. 2013. “Patient Reported Outcome Measures Could Help Transform Healthcare.” BMJ 346: f167: 1–15. doi: 10.1136/bmj.f167
- Coulter, A., L. Locock, S. Ziebland, and J. Calabrese. 2014. “Collecting Data on Patient Experience is not Enough: They Must be Used to Improve Care.” BMJ 348: g2225: 1–4. doi: 10.1136/bmj.g2225
- Dang, B.N., Robert A. Westbrook, William C. Black, Maria C. Rodriguez-Barradas, Thomas P. Giordano, and D. William Cameron. 2013. “Examining the Link Between Patient Satisfaction and Adherence to HIV Care: A Structural Equation Model.” PloS one 8 (1): e54729: 1–7. doi: 10.1371/journal.pone.0054729
- Donabedian, A. 1988. “The Quality of Care: How Can it Be Assessed?” Jama 260 (12): 1743–1748. doi: 10.1001/jama.1988.03410120089033
- Kahneman, D. 2011. Thinking, Fast and Slow. London: Macmillan.
- Mpinga, E.K., and P. Chastonay. 2011. “Satisfaction of Patients: A Right to Health Indicator?” Health Policy 100 (2): 144–150. doi: 10.1016/j.healthpol.2010.11.001
- Onwujekwe, A., E. Etiaba, and A. Oche. 2015. “Patient Satisfaction with Health Care Services: A Case Study of the Federal Medical Centre, Makurdi, North Central Nigeria”.
- Svoronos, T., R.J. Macauley, and M.E. Kruk. 2014. “Can the Health System Deliver? Determinants of Rural Liberians’ Confidence in Health Care.” Health Policy and Planning czu065: 823–829.
- Vian, T., Nathalie McIntosh, Aria Grabowski, Elizabeth Limakatso Nkabane-Nkholongo, and Brian W. Jack. 2015. “Hospital Public–Private Partnerships in Low Resource Settings: Perceptions of How the Lesotho PPP Transformed Management Systems and Performance.” Health Systems & Reform 1 (2): 155–166. doi: 10.1080/23288604.2015.1029060