?Mathematical formulae have been encoded as MathML and are displayed in this HTML version using MathJax in order to improve their display. Uncheck the box to turn MathJax off. This feature requires Javascript. Click on a formula to zoom.
Abstract
A pseudo-bond graph is presented to model the heat transferred from the fuel rods to the coolant via its cladding in a generic nuclear reactor case study. Simulations performed using this model are used to explore the temperatures of the core components under ordinary and emergency scenarios, considering various conditions of coolant supply and reactor power output. The model is combined with a timed stochastic Petri net to produce a hybrid model, in which the reactor operation and fault status is determined by the Petri net and fed into the bond graph to examine the resulting impact on core temperatures, which in turn are fed back into the Petri net process. The results predict the distribution of the reactor operational durations before a disruption occurs. The model provides the temperature profiles attained by the cladding and fuel components, indicating a low probability of dangerous temperatures.
1. Introduction
It is expected that many of the existing nuclear reactors will be operated beyond their initially intended design life in order to meet future energy requirements and carbon targets. An ambition for future reactors is to achieve substantially improved operating lifetimes. To achieve this careful consideration must be given to their long-term asset management approach, and how the adopted asset management strategy will impact the plant risk and reliability. Care must be taken to capture the nuances of specific maintenance strategies. Since the longer operating lives imply that components are more likely to experience wear-out, the ability to model increasing failure rates is also essential.
Since their inception, fault trees and event trees have been the standard tools used to assess reactor risks. Fault Tree Analysis emerged in the early 1960s through the work of Watson (Citation1961) at Bell Laboratories. The goal of fault tree analysis is to express the causality of a hazardous system failure and quantify its probability and rate of occurrence which can be achieved by qualitative methods, such as kinetic tree theory (Vesely Citation1970). The first documented use of event trees is seen in the WASH 1400 report (Rasmussen Citation1975), produced in 1975 by a team led by Rasmussen developing nuclear plant risk assessment methodologies at the U.S. Nuclear Regulatory Commission (USNRC). An event tree starts with one initiating event on the left of the structure and charts rightwards all possible branching pathways produced by the events that follow (such as the success or failure of containment actions), inductively reaching various potential outcome states.
Both fault trees and event trees are well developed mature methodologies. As well as being used independently, the two have been used in conjunction (Xu & Dugan Citation2004), or augmented by binary decision diagrams (Andrews & Dunnett Citation2000). However, neither is suitable for this work. Their chief limitation is the need to assume independence between basic events and, in general, commercial implementations do not allow the use of non-constant failure rates, such as would be necessary to model ageing processes or component infant mortality. For the same reason, repair times cannot be appropriately represented, due to the compulsion to use exponential time distributions for processes which are certainly not random. In addition, the behaviour of complex maintenance, repair, and operational processes are not achievable with these methodologies. The Petri net approach offers an alternative methodology capable of capturing these features. Such a method enables the quality of safety assessments of nuclear power plants to be improved, in the light of the aim to achieve extended installation lifetimes. By contrast, modelling methodologies rooted in fault trees, event trees, and binary decision diagrams are not able to adequately describe progress through arbitrarily complex multistage processes with parallel tracks and intrasystem interdependencies. The suitability of Petri nets for modelling a wide range of problems is noted in a review of the methodology in the context of nuclear power plants by Jyotish et al. (Jyotish et al., Citation2022), although they also highlight the associated drawback of the resulting large state space, and thus, the computational expense of calculating a Petri net’s reachability graph.
This paper employs generalised stochastic Petri nets (Balbo Citation2007; Petri Citation1962; Schneeweiss Citation2004) with atomic firing for the modelling of its reactor component status – a methodology which is capable of the inclusion of arbitrarily detailed dynamic behaviour. The Petri net model, constructed to simulate the development of faults and the operational procedures of both routine maintenance and the response to emergency scenarios, is coupled with a simulation of the reactor core thermodynamics, achieved through the methodology of bond graphs (Paynter, Citation1961).
Literature providing examples of the use of Petri nets (Aldemir Citation2013; Kachur & Shakhova Citation2016; Kumar et al., Citation2019; Lee & Seong Citation2004; Németh et al., Citation2009; Ponciroli et al., Citation2016; Singh et al., 2017; Singh & Rajput, Citation2016) and bond graphs (Badoud et al., Citation2009; Bentaleb et al., Citation2018; Sosnovsky & Forget, Citation2013, Citation2014; Zhou et al., Citation2022) individually in a civil nuclear energy context is available, and, in more general contexts, previous work integrating Petri nets and bond graphs have shown the capability of their combined use (Allard et al., Citation1995; Allard et al., Citation1993; Borutzky et al., Citation1995; Bouhalouane et al., Citation2015, Citation2020; Ekanayake et al., Citation2019; Michel et al. Citation1993; Mokhtar & Hafid Citation2012; Wootton et al., Citation2019; Zanzouri & Tagina Citation2002). The most common means of unifying the methodologies seen is to tie the marking of the Petri net to switches within the bond graph, which add or remove connections (Allard et al., Citation1995; Bouhalouane et al., Citation2015, Citation2020; Michel et al., Citation1993; Mokhtar & Hafid Citation2012), but the use of independent models for verification purposes can also be found, such as the use of continuous Petri nets to confirm the output of a fluid processing system modelled by a bond graph (Pettersson & Lennartson, Citation1995). The use of Petri nets typically focuses on the procedural sequence of a system, but the work presented in this paper also contains extensive representation of the failure modes of the system that can occur during its continuous operation. Furthermore, the Petri nets in this work interact with the bond graph section of the model in a different way. Rather than acting as on-off switches as in the previous examples, the parameters of the components of the bond graph change dynamically with respect to the conditions represented by the Petri net. Similar modelling (Ponciroli et al., Citation2016) has been has been performed with a Petri net, where the bond graph capability is implemented in ModelicaFootnote1. While the models in this work are also implemented in Modelica, they are constructed in the formalism of bond graphs, and the hybridisation features two way communication, with the conditions resulting in the bond graph also able to trigger events in the Petri net. This is the principle purpose of this work; to demonstrate in a novel way the specific use of a Petri net failure model to drive the inputs to a thermal model expressed according to bond graph formalism which represents those same components and responds appropriately to their status, as well as likewise having a mechanism to change the state of the Petri net in turn. This provides an important advantage that neither achieves alone. In a Petri net model, the consequences of a failure mode must be understood, assumed, or explicitly known from historic cases, but coupled with a bond graph, they are translated directly into physical consequences. As the Petri net stochastically samples the failure state space, the spectrum of outcomes derived will reflect this in a way that performing predetermined test cases with the bond graph by itself will not. Characterising the range of physical outcomes is of particular interest in the context of a nuclear reactor as the primary threat posed by the system is deeply tied to the potential for runaway production of heat outstripping its capacity to extract thermal energy by coolant circulation.
Although the focus of this work is the nuclear context, this methodology could be adapted for any case where there is an interest in mapping system failure states to physical outcomes. This would only require a suitable Petri net to be constructed for the operational states and failure modes of that system and similarly that a bond graph be developed to model the energy domains of critical importance. For example, it may be useful to simulate electrical current, fluid mass transfer, or physical oscillations, etc. or any combination of these domains and others. In the case of additional complexity where transfer within multiple domains is coupled, the methodology can be further generalised by the multi-bond extension, such as in the work of Vasilyev et al. (Vasilyev et al., Citation2017), which uses the MultiBondLib package (Zimmer & Cellier Citation2006) to track in concert the propagation of temperature, enthalpy, mass, and pressure in a gaseous system.
2. Reactor case study
The example system used in the case study, shown in , is a nuclear reactor with modern features that are typical of a modern reactor design with an emphasis on passive safety. The design does not correspond to a specific power plant type, but serves for the purposes of the methodological illustration presented in this work. During normal operation, natural circulation of light water occurs between the core and four steam separators to provide reactor cooling. Steam is extracted at the separators and is used to drive a turbine to produce electricity. The coolant is returned to liquid form in the condenser, after which it is pumped back to the steam separators using three feed pumps. For successful operation only two of the three pumps are required to function, with the third being on stand-by, ready to provide a replacement in the event of failure of one the others. The usage of the pumps is cycled periodically to allow maintenance to be performed on the inactive pump. The cycling of the pumps also results in even wear of each unit. Maintenance and repair actions for all other components are performed when the reactor is offline.
Figure 1. Schematic overview of the case study reactor used in this work.
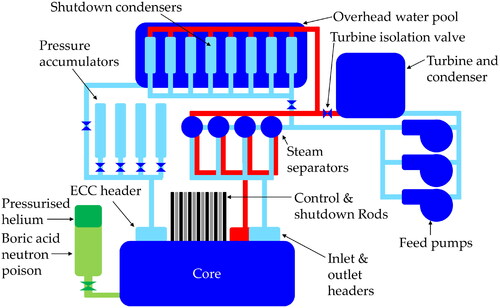
At full power, the reactor produces 9.2 × 10⁸ W of heat, with 2000 kg⋅s–1 of coolant flowing through the core, entering at 530 K. There are 450 coolant channels, each containing a Zircalloy-2 (Zr-2) cladded uranium dioxide (UO2) fuel rod, enclosed within calandrias filled with insulating carbon dioxide and separated from one another by the heavy water moderate fluid.
The reactor shutdown process begins by inserting the shutdown rods and by closing the turbine isolation valve, thereby directing coolant into the shutdown condensers instead of the to turbine. The eight shutdown condensers are arranged in pairs and reside in a large overhead pool of water which is used as a heat sink. Following the closure of the isolation valve, pressure builds in the shutdown condensers, thereby causing air operated valves (AOV) to open and allow the throughput of coolant. Each pair of shutdown condensers shares two AOVs, installed in parallel, such that the opening of either by itself is sufficient for circulation. Once online, at least half of the total shutdown condensation capacity is adequate, with anything less than that constituting a major failure, as does a fault in the overhead pool. The process of shutdown condensation lasts 40 days, during which, residual core decay heat is extracted, starting at 6% of full reactor thermal power and falling exponentially thereon, such that after one hour, 1.5% of full output is being emitted.
If a fault occurs in the pumps, turbine, condenser, or the pipes that feed them, the situation may be contained by ordinary shutdown. However, a break inducing coolant pressure loss between the core and the isolation valve will require emergency injection. This occurs first from four high pressure accumulators, operating for a period of 2.5 hours, before then transitioning to low pressure injection wherein water from the overhead pool submerges the reactor over a three-day period. The coolant delivered via high pressure injection from each accumulator relies on the successful opening of an AOV followed by a rupture disc. It is possible that the latter only partially opens, in which case, its accumulator is treated by the model as supplying half of its load. In total, at least half of the combined capacity of the accumulators is required to successfully deliver high pressure injection. The contribution of an accumulator may also be rendered unavailable if it spuriously activates before demand. To commence the low pressure injection phase, both a non-return valve and a rupture disc must open to allow flow from the overhead pool. If this rupture disc only partially opens, the flow contribution is halved and the injection period doubled.
The preferred method to shutdown the reactor is to use its 40 shutdown rods (SDS-1), but if more than two of these fail to properly insert, a boric acid (H3BO3) neutron poison is instead deployed (SDS-2). This entails the injection of the poison into the moderator fluid using a reservoir of pressurised helium, following which there is a substantial clean-up cost. The additional failure of SDS-2, constitutes a complete failure to shutdown the reactor.
If one steam separator circuit or one pressure accumulator fails, reactor shutdown is scheduled for six months from the time of the fault appearing. Should a second fail in that period, the reactor immediately transitions to shutdown. If a break emerges in SDS-2’s helium or boric acid supplies, immediate shutdown is required. An unplanned shutdown will occur if either turbine isolation valve spuriously closes, or if either of the boric acid or helium release valves spuriously opens.
There are a number of features of the reactor system that would not be captured well in a safety assessment based on some combination of fault trees, event trees, and binary decision diagrams. This is particularly true of the cycle of maintenance actions in the feed pumps with its staggered replacement of units, conditional on the availability of redundancy, as well as the mechanism for determining overall failure in relation to the number of pumps active, on standby, or being replaced at a given moment. It would also be a challenge to model in an elegant or practical way via the traditional methodologies such sections of the system where many components of the same type work in parallel, requiring that some fraction of their collective capacity be supplied, given the number of branching paths necessitated. In the most extreme case, one would have to have to account for every possible individual expression of failure mode of each of the full set of 40 shutdown rods in SDS-1.
3. Methodology
3.1. Petri nets
3.1.1. Overview
Stochastic Petri nets are used to model the occurrence of component failures on the plant systems, i.e. the appearance of failures, and for then representing the functionality of the plant during both normal and emergency circumstances. The dynamics of the system being modelled are captured in the structure of the Petri net where the system state at any moment is given by its marking.
A Petri net is a bipartite graph, of place and transition objects, with linkages known as arcs and markings provided by tokens, see . The role of a place is to store tokens and the role of a transition is to change the allocation of tokens residing in the places. A place is represented by a circle, within which tokens are drawn as black dots. The tokens can be used to denote any sort of information, such as: the condition of a component, the availability of resources (such as spares or maintenance engineers), or the state of the plant (such as a phase of operation).
Figure 2. A key to objects used in depictions of Petri nets in this work.
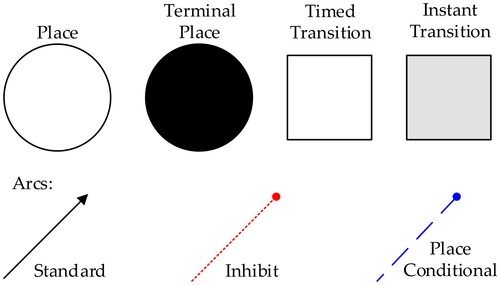
Transitions, represented by squares, perform the task of updating place marking by adding and removing tokens. These can represent the failure or repair of a component or a change in the state of an operation. To cause these dynamic changes in the Petri net, one transition is selected to fire at each step of the simulation. Arcs are used to establish the connections between the places and the transitions. The arcs appear as arrows, whose direction links the input places to the transition or the transition to the output places. The input places indicate the state of the system prior to the transition occurring. The output places define the system status following the transition. The arcs therefore indicate whether the transition will take or give tokens. The number of tokens a place gains or loses after a transition is determined by the multiplicity of the connecting arc, known as its weight. The default weight is one, and if any other value is taken, it is indicated adjacent to the arc. The occurrence of a transition is known as its firing. Prior to firing, the conditions must exist for this to be possible. When this state is achieved the transition is said to be enabled. The incoming arcs of a transition determine whether it is enabled. For a transition to be enabled, the input place for each of its incoming arcs must hold at least as many tokens as the weight of arc linking it to the transition. Once enabled, the transition may fire immediately (instant transitions are grey), or after a delay determined by the parameterisation of the transition (timed transitions are white), discussed in more detail in section 3.1.3. The process of transition firing is illustrated in , where each place is labelled with a ‘P’ and the transition is indicated with a ‘T’. Firing removes the associated arc multiplicity of tokens from each of the input places and deposits the associated arc multiplicity of tokens on each of the outputs places If a transition and place are connected by an incoming arc and an outgoing arc of equal weight, the arc is drawn as a single double headed arrow. The pair is collectively named a test arc and an example is seen connecting P3 and T1 in (a), (b), and (c) of .
Figure 3. An illustration of Petri net transition firing is given in (a) to (c) and examples of the extended Petri net objects used in this work are given in (d) to (f).
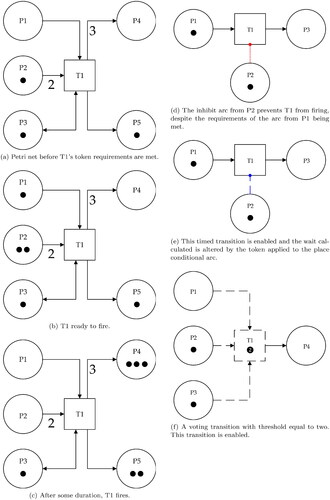
In addition to enabling a transition it is also possible to suppress a transition. Suppression is achieved by an inhibit arc. As seen in , an inhibit arc is drawn as a red dotted line and connects a single place to a transition, the arc has a circular head (rather than an arrow). When the number of tokens on a place is at least equal to the arc weight is satisfied, it prevents the firing of the connecting transition. Other useful features that can be exploited in Petri nets include the place conditional arc, and the voting transition, seen in respectively. A place conditional arc also features a circular head, but is given a blue dashed line. Its role is to alter the firing delay distribution of a timed transition, depending on the state of its input place (see Section 3.1.2). A voting transition functions similarly to an ordinary transition in all respects except its conditions to fire. Instead of requiring that all arcs weights are satisfied, a voting transition requires only that a threshold number arcs satisfy the requirement. The threshold is given by a number written in a black circle (e.g. ❷) below the label of the transition. Regardless of the extent to which the threshold is passed, a voting arc behaves normally with respect to all of its satisfied arcs in relation to token removal. Places from all unsatisfied arcs are ignored. Voting transitions and their incoming arcs are distinguished by dashed edges. The behaviour of outgoing arcs is as for a normal transition, as indicated by the solid arc representation. Test arcs connected to a voting transition default to the dashed line appearance.
3.1.2. Firing delay distributions
There are many options available to determine the firing delay distribution for timed transitions. The simplest of these is the fixed delay, where the transition is scheduled to fire after a set duration, a, when enabled. A transition can also have a uniform distribution, which schedules a firing time up to a value, u, such that its probability density function is given by:
(1)
(1)
where t is the delay from the enabling of the transition to its firing. A pair of transitions with a fixed delay and a uniform distribution, is useful for creating branching pathways in the Petri net, using arbitrarily small values of a and u of a ratio such as to produce a given probability.
A cyclic distribution is given parameterised by two variables c and ω. Upon being enabled, the transition is scheduled to fire when the simulation clock next reaches a non-zero integer multiple of c, offset by the value of ω. For example, two transitions both required to fire once an hour, but thirty minutes apart, would be parameterised with c = 1, ω = 0, and c = 1, ω = 0.5.
The Weibull Distribution (Jiang & Murthy, Citation2011; Papoulis & Pillai, Citation2002) is well suited to modelling component failure rates and is widely used in reliability engineering for this reason. The form used in this work has two parameters, η, which characterises the time at which approximately two thirds of such components are expected to fail, and β, which specifies whether the component experiences infant mortality, i.e. high probability of early failure given by , or ageing, i.e. increasing likelihood of failure as time passes given by
. For β = 1, a constant rate of failure is achieved, equivalent to an exponential distribution of failure times. The probability density function of the Weibull distribution,
is given by:
(2)
(2)
Repair times are sometimes modelled with the log-normal distribution, which returns a value whose logarithm is normally distributed (Dennis & Patil Citation1987). This is produced by applying the exponential function to a normally distribution random variable (Clarke & Cooke, Citation1978), whose mean and standard deviation are given by μ and σ. Consequently, the resulting probability density function, , is:
(3)
(3)
As discussed in section 3.1.1, place conditional arcs modify the firing delay of their transition. To do so, a factor P is calculated, such that:
(4)
(4)
where Wi and Ni are respectively the weight of the ith place conditional arc and the number of tokens on the corresponding place. This value is used to scale a parameter from the distribution of the transition (a, u, c, η, or μ, depending on type) such as to produce a modification of the resulting firing delay in inverse proportion to P. The purpose of this is to permit arbitrary specification of time to fire alteration in relation to the token markings of any number of places. Unlike other arc types, a place conditional arc does not require that its weight be an integer.
3.1.3. Petri net integration
The Petri net modelling presented in this work is implemented with the in-house software, Macchiato (Wootton et al., Citation2022), developed at the University of Nottingham.
Monte Carlo simulation (Metropolis & Ulam Citation1949) is used to perform computational experiments of potential life histories of the system modelled, randomly sampling transition firing delays in accordance with their parameters, as discussed in Section 3.1.2. The simulation proceeds in steps where each step fires one transition. At each step, Macchiato assesses which transitions are enabled and schedules a time to fire to transitions that were not enabled for the previous step. The enabling conditions of a transition must continue to be met on every step prior to its firing, otherwise, it will become unenabled and its scheduled firing time will be discarded. When a transition fires, the scheduled firing time of other transitions is not altered unless the consequent change in tokens disrupts their requisite enabling marking. In the case that multiple transitions are scheduled to fire at the same time, the conflict is resolved by first giving priority to instant transitions, and then choosing a transition at random if a scheduling conflict still remains.
Each simulation continues until a terminal state is reached, indicated by the places given black fill. Many simulations are performed, in batch sizes chosen to check convergence, such that statistical analysis may evaluate the system performance. These statistics provide predictions of system performance metrics, such as the time spent in a particular state, or the probability of specified events, and the Petri net model is deliberately structured as to be conducive to this end.
3.2. Bond graphs
3.2.1. Overview
Bond graphs are a general modelling methodology for the movement of energy through a system, such as to allow the representation of multiple energy domains (e.g., electrical, mechanical, thermal) as part of a single cohesive model. This is achieved using the concept of the dynamical analogy, which recognises the common features found in the equations that describe the behaviour of many otherwise-unrelated physical phenomena. For example, the act of storing electrical energy by using a potential difference to push charge into a capacitor is akin to the act of using force to store potential energy in a spring as described by Hooke’s law. The bond graph methodology uses two generalised concepts as its basis for describing physical system dynamics. These are effort, which is analogous to electrical potential difference, mechanical force, hydraulic pressure, etc., and flow which is analogous to electric current, translational or angular velocity, volumetric transfer rate, etc. The efforts and flows for a bond graph are denoted and
respectively. The pathways for the transfer of energy throughout the system are called bonds, drawn as
 , with positive directionality marked by the half-arrowhead. Each bond has its own local value of effort and flow, such that for N bonds,
(5)
(5)
Each bond much have exactly one element connected to its beginning point and to its end point. Elements are categorised by their number of ports, with the total number of ports being the number of connections to bonds that the element can take. Three single-port elements represent instances of generalised concepts in the system. The resistor element, symbolised as R, represents resistance, acting to dissipate energy in a manor analogous to an electrical resistor or friction in a mechanical system. The capacitor element, symbolised as C, represents compliance, storing energy as would an electrical capacitor or a spring. The inductor element, symbolised as I, represents inertance, which is equivalent to momentum in a mechanical system or the behaviour of coiled wire in an electric circuit. Resistor, capacitor, and inductor elements can only link to an input bond, never an output. Each of these elements is parameterised by a single value, denoted R, C, and I, in accordance with its type, and each has associated governing equations which act on the effort and force (e and f) of the bond connecting to the element, such that for a resistor,
(6)
(6)
for a capacitor,
(7)
(7)
and for an inductor,
(8)
(8)
The variables p and q are referred to as integrated effort and integrated flow and are equivalent to the time-integrated counterparts of effort and flow respectively, i.e. magnetic flux or mechanical impulse for the former and charge transfer or displacement for the latter.
There are two more single-port elements, these being the source/sink of effort and the source/sink of flow, symbolised as Se and Sf respectively. Such an element is referred to as a source when its bond is directed away from it and as a sink when the bond is directed into it. The purpose of sources/sinks is to apply some value of effort or flow to their bond as an input to the system, constant or otherwise. For example, in a hydraulic system, the rate at which fluid is pumped into a system would be a source of flow and a drain where fluid leaves the system in accordance to its pressure would be a sink of effort.
The two-port elements come in two forms known as the transformer and the gyrator, which are symbolised by TR and GY respectively. As illustrated in , both must have one input bond and one output bond. The transformer represents behaviour analogous to an electrical transformer or a mechanical lever, applying a scale factor, , to the flow variables and its reciprocal to the effort variables, such that the relationship between the in and out bonds is given by,
(9)
(9)
Figure 4. The two-port bond graph elements, corresponding to EquationEquations (9)(9)
(9) and Equation(10)
(10)
(10) .
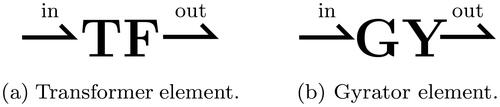
The gyrator is typically used to perform conversions between energy domains, such as a motor producing kinetic energy from electricity, or a turbine, which does the inverse. It governs the relationship between the input and output bond in terms of the parameter, , which sets the effort of the latter by the flow of the former and the flow of the latter by the effort of the former, such that,
(10)
(10)
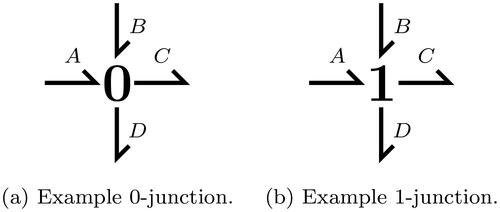
The multi-port elements, known as junctions, split flow or effort, with these roles fulfilled by the 0-junction and 1-junction respectively. The 0-junction, symbolised by 0, rules that all its input and output efforts are equal in value and that the sum of its input flows must equal its output flows. For instance, a 0-junction with input bonds A and B and output bonds C and D would be governed by,
(11)
(11)
with this configuration illustrated in . The 1-junction, symbolised by 1, establishes the reverse conditions, such that for the same configuration of bonds, see , a 1-junction would be governed by,
(12)
(12)
Figure 5. The two multi-port bond graph elements in the configurations described by EquationEquations (11)(11)
(11) and Equation(12)
(12)
(12) .
From EquationEquations (11)(11)
(11) and Equation(12)
(12)
(12) is evident that either multi-port junction with one input and one output bond would be trivial, i.e. equivalent to a single continuous bond, whereas a multi-port junction with two input or two output bonds would effectively be equivalent to a transformer element with
. Similarly, two junctions of the same type linked directly by a bond would functionally act as a single instance of that element.
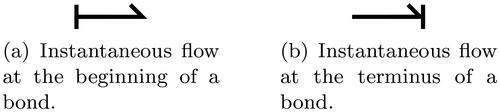
The act of solving a bond graph is aided by the concept of causality, which determines the dependence or independence of each variable of state. Causality is an indication of the side of a bond that experiences the instantaneous effort and which experiences instantaneous flow. These are never the same, and of the two, the latter is marked with a perpendicular line on the bond, as illustrated in . As a consequence of this convention, sources and sinks of flow must necessarily link to the causal end of a bond, and likewise, the reverse is true for sources and sinks of effort. Inductors are causal with respect to flow and therefore always connect to the causal end of their bond, while capacitors are causal with respect to effort and therefore never do. Transformers require that one bond be causal and the other be non-causal, and gyrators require that their bonds be either both causal or both non-casual. It follows from EquationEquations 11(11)
(11) and Equation12
(12)
(12) , that 0- and 1-junctions require exactly one causal bond and exactly one non-causal bond respectively, with the remaining bonds being otherwise. Resistors can take either relationship, with their causality determined to fit with their surrounding elements. However, contradictions in causality can arise. Under such circumstances, it is permissible to reverse the causality of the bond to a capacitor or inductor to resolve the conflict. Conventionally, the bond is marked with the symbol,
, to indicate where this has occurred. When a bond graph model is complete and causality is established, simulation of the system may be performed. This is done via the numerical time integration of all the governing equations of the elements of the bond graph, taking reference of the mutual dependencies created by the bonds and their causal orientations.
Figure 6. The marking of causal relations on bonds.
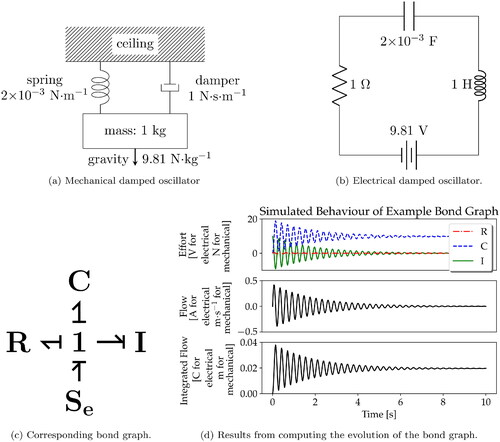
In it is illustrated how two physically different systems, in this case (a) a mass suspended by a spring and a damper and (b) an electrical circuit, can result in the same bond graph structure and produce analogous behaviour. Representation of these systems in bond graph form is seen in (c), with the spring and capacitor being the C element, the damper and the resistor being the R element, and the mass and the inductor being the I element. The force of gravity and the potential difference from the battery are represented by the source of effort, Se. As the components are physically bonded in the mechanical case, and in series in the electrical case, the flow, i.e. the velocity and the current respectively, must be equal throughout the system. Therefore a 1-junction must be used. With the mass and the capacitor initially at rest and uncharged respectively, the resulting evolution of the systems is visible in (d). The results are entirely agnostic regarding their applicability to the mechanical or electrical systems, with the only requirement being to substitute the appropriate units. It is seen that the flow oscillates around zero with ever-decreasing amplitude, with the integrated flow tending to a value greater than its initial value, which is to say that the mass settles at a position hanging below its starting point, and that the capacitor accumulates some charge. The transfer between potential and kinetic or electrical energy is implicitly seen in the anti-correlated oscillations of the effort values.
Figure 7. In (a) and (b) two damped oscillator systems are found, implemented in mechanical and electrical form respectively, with parameters chosen to so as to give directly analogous results. The same structure is produced when these systems are represented as bond graphs, as seen in (c). The mechanical system is defined such that the spring is neither stretched nor compressed at the beginning of the simulation and displacement of the mass is given relative to its initial position, with downwards taken as positive for the sake of convenience. The mass is initially at rest and the capacitor has no initial charge. With the appropriate substitution of units, the resulting evolution of the model, shown in (d), is applicable to either system.
3.2.2. Thermal Pseudo-bond graphs
The power flowing across a bond is the product of the effort and flow, and traditionally is formally required to have this dimensionality, i.e. energy transfer per unit time, such that for a system with energy transfer rate, ,
(13)
(13)
However, it is most convenient to represent the thermal domain in such terms that effort is defined as temperature and flow is defined as enthalpy change per unit time, which does not conform to this requirement. Although this has no practical impact on the execution of the models, it does therefore mean that they are correctly referred to as pseudo-bond graphs (Karnopp Citation1978).
In a thermal pseudo-bond graph, heat is introduced to the system via a source of flow and is allowed to flow out into a sink of effort. The temperature of a specific object in the system is modelled with a capacitor element, whose value is determined by the mass and specific heat capacity of the object. The rate of heat transfer between two objects in thermal contact is modelled by a resistor element, whose value is calculated from the combined effects of the relevant heat transfer modes (conduction, convection, etc.). Alternatively, a separate resistor element can be used for each mode. An example bond graph representation of two objects in thermal contact is given in .
Figure 8. Pseudo-bond graph representing two objects in thermal contact. The 0-junctions are added to demonstrate how the objects would connect to the rest of a larger system.
3.2.3. Implementation
The bond graph in this work was constructed in the Modelica language (Fritzson & Engelson, Citation1998), using the BondLib package (Cellier & Nebot, Citation2005). The model was then exported as a Functional Mock-Up Unit (FMU)Footnote2. The PyFMI packageFootnote3 Andersson et al., Citation2016 provided the means to read the FMU and the Python interface used to integrate it with the Petri net developed in Macchiato.
3.3. Hybridisation
To produce a hybrid Petri net-bond graph requires an interface to manage the transfer of information in both directions. It must be possible to vary the inputs to the bond graph, for example those values that correspond to the operational state parameters such as coolant throughput or reactor thermal energy production. The state of these inputs is calculated by reading the marking of the Petri net to determine the status of the components relevant to these values. Similarly, the state of bond graph must be monitored such that if simulated values exceed specified limits, intervention can be taken in the form of changes to the Petri net marking. For example, if fuel rod temperatures exceed acceptable levels in the bond graph, the interface can initiate the shutdown process in the Petri net model by adding a token to a relevant place. As the state of components then evolve as part of reactor shutdown, the bond graph in turn will receive updated input values to reflect the new information seen by the interface.
A system is considered coherent if the linkage of component failures can be achieved by the use of Boolean OR and AND logic (Brînzei & Aubry Citation2018). However, this can only be said to apply in an idealised case, ignoring that fault propagation in a real system is dependant on the correct function of items such as pipes and wires to contribute to specific failure modes. This is implicitly true of the propagation of faults through the Petri net and additionally so with regards to the communication through the hybridisation interface, with the input parameters fed to the bond graph being at times a function of the state of both working and failed components.
4. Hybrid model
4.1. Petri net
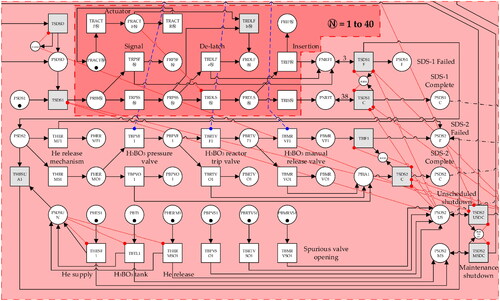
The Petri net component of the model with its initial token marking is illustrated in , with the transition parameters given in . The part of the Petri net used to model different functions are each indicated using a different colour. The parts of the system highlighted are: the circulation of primary coolant, shutdown condensation, emergency coolant injection, reactor shutdown systems, and the conditions for simulation termination. With regards to the terminal states, if either shutdown condensation or core submersion occurs and one of the two shutdown systems completes successfully, a safe shutdown of the reactor is achieved, with a token arriving at PSafe. One of three safe terminal states is then chosen:
Figure 9. The Petri net used to model the operational states and component failures of the reactor system. Its sections are coloured to mark their function: blue – primary coolant circulation, green – shutdown condensation, yellow – emergency coolant injection, red – reactor shutdown systems (shutdown rods and boric acid moderator injection), wherein the dark section is repeated 40 times in parallel, and black – terminal reactor states. These sections (excluding the terminal states) can be found in separated form in the appendix, see , and a detailed explanation of the structure and function of the model is given in section 4.1. The firing delay type for each of the timed transitions and the corresponding parameters are found in .
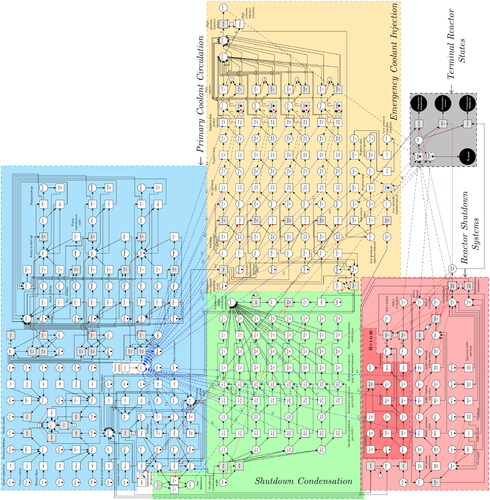
Table 1. Parameters for the transitions of the Petri net seen in . All times are given in hours. Values are drawn either from the system description, or estimated from historic data or expert opinion
PScheduledMaintenance, if the reactor reaches shutdown after its normal shutdown period
PEarlyMaintenance, if the reactor was deliberately shut down for maintenance or repair prior to the end of the scheduled operating period
PUnplannedShutdown, if the reactor was shut down as a result of spurious SDS-2 activation (The Petri net is configured such that this outcome will result regardless of whether the scheduled shutdown period has been reached or not, so an operator may give consideration to the clean-up cost associated with boric acid injection)
If the reactor enters a state where it cannot safely shut down through the use of its own systems, a token is instead added to PUnsafe, recording that outside intervention would then be necessary to avert catastrophe.
Throughout the model, the progressive increase in likelihood of a valve failing to open or close on demand is achieved by a place conditional relationship from PVA to all relevant transitions, which receives an additional token from TVA1 at the end of each year.
In the primary coolant section of the Petri net, there are structures to represent the failure of the components of each of the steam circuits. As the failure any one of those components will disable its entire circuit, its status is recorded at PCCb[1–4]. When a steam circuit component fails, a token is added to PCCa[1–4], causing TCP[1–4] to remove the initial token from PCCb[1–4] and add one to PCCN. The first token to arrive at PCCN will enable TMSS1, setting the six month maintenance shutdown countdown, and the arrival of a second token will enable TMSS2, thus placing a call for reactor shutdown immediately instead; the firing of either transition adds a token to PTIVD0. In the case of a third steam circuit being lost during the shutdown condensation process, TCCF records the occurrence of of a primary coolant fault at PCFE, which in turn places a call for emergency coolant injection. Failure of either the inlet and outlet headers or the coolant channels, TIH1 and TRCC1 respectively, places an immediate call for both shutdown and emergency injection, whereas a failure of a section of the pipe to the turbine, the turbine itself, or the main condenser only actions the former. This is because the latter group of components sits beyond the turbine isolation valves, meaning that in the event of a fault it can be physically separated from the core. The process to close the turbine isolation valves begins when TTIV0 fires as a result of a token reaching PTIVD0 (or if a valve closes spuriously, see TTIVa[1–2]). If the first valve closes successfully, see TTIVa1, this is sufficient, but if it fails to shut, or fails open once shut (see TTIVba1 and TTIVFOF1), the second valve is required. If it too fails, a call is made for emergency coolant injection.
The three feed pumps, two which are required to be online to return coolant from the main condenser, can fail either mechanically or electrically while in use, see TFPMF[1–3] and TFREF[1–3], and their repair is performed by the firing of TFPMFR[1–3] and TFPEFR[1–3] respectively, after which, the repaired pump ready to be brought online to replace one of the others as needed. The readiness of each a pump is recorded by a token at PFSB[1–3], such that TFPBAT[1–3] fires if a pump activation demand arises via the addition of a token at PFPD. When attempting to bring a pump online, it can be either successfully activated, TFPA[1–3], or fail on demand, TFPAF[1–3]. In the latter case, TFPFTSR[1–3] represents the repair process that must be performed before another attempt can be made. The routine maintenance of a pump is queued when TFPRQ[1–3] fires (these three transitions are offset such as to be spread evenly over the maintenance period), placing a demand for one of the pumps to replace it. If a replacement is successfully brought online, a token is placed at PFPDA, allowing TFPRW1 to fire, thereby taking the pump to be maintained offline. Otherwise, the pump continues to operate until its replacement is ready. After maintenance work is complete, represented by TFPRC[1–3], the pump is then available to replace another when required. TFPFL[1–3] and TFPWK[1–3][a–b] track the number of failed feed pumps, respectively adding and subtracting tokens from PFFP. If the tally of failures reaches two, TFPCF fires to mark the failure of the feed pump system and thus the emergence of a primary coolant fault.
The shutdown condensation commences operation when TSC0[a–b] fires, following the closure of one of the isolation valves as recorded by PTIVC[1–2]. The successful opening and failure of the AOVs are represented by TSCAOVOa[a–b][1–4] and TSCAOVF[a–b][1–4], after which TSCPSS[1–4][i–ii] and TSCCAL[1–4][i–ii] respectively model the occurrence of rupture and calcification of each pipe connecting to the steam separator circuits.
The arrival of a token at PCFE prompts the commencement of emergency core coolant injection via the firing of TECC, which takes the initial token from PECC0 to signify that the process as begun (as emergency injection can occur only once while the reactor is running). The first phase is high pressure injection via the pressure accumulators. The successful activation of each pressure accumulator is modelled by TPAO[1–4] and its failure on demand by TPAMFa[1–4], or by TPAMFb[1–4] in the case that the accumulator has already spuriously fired, see TPAFO[1–4]. Spurious firings are tallied at PPAMR and the transitions TPAM1 and TPAM2 fire after six months and immediately, following one and two such failures respectively. Once operational, the coolant from the pressure accumulator must pass through an AOV and a rupture disc in sequence, the successful opening of which is modelled by TPAAOVO[1–4] and TPARDO[a–b][1–4] respectively, and recorded by the arrival of two tokens at PPASA. The failure of the two valves occur with the firing of TPAAONF[1–4] and TPARDF[1–4], and are recorded at PPASFT. The partial opening of the rupture disc when TPARDP[1–4] fires, causes only half of the pressure accumulators contribution to be made available, delivering one token to PPASA and PPASFT each. Five tokens reaching PPASFT signifies the immediate failure of high pressure injection. Otherwise, TPASA fires after two and a half hours, during which period, the connecting pipe must stay intact. If it fails, the contribution of its accumulator is transferred from PPASA to PPASFT by TPAPR[a–b][1–2].
After the completion of the high pressure injection phase, low pressure injection begins from the gravity driven overhead pool, marked by the arrival of a token at PGDWP0. This coolant must pass through a non-return valve followed by a rupture disc, the successful opening of which is respectively modelled by TLPNRO1 and TLPRDO[a–b]1. The firing of TLPNRF1 and TLPRDF1 represent their respective failures, while TLPRDP1 represents the partial opening of the rupture disc. The complete failure of either valve or the unavailability of coolant from the overhead pool results in the failure of low pressure injection, respectively modelled by TLPF and TLPOHP. The successful completion of low presure injection, and thus submersion of the core, is marked by the arrival of a token at PLPC, either with the firing of TLPO1 after 72 hours if the rupture disc is fully open, or with the firing of TLPP1 after 144 hours if partially open.
The reactor shutdown systems stand idle until a demand is placed, represented by the addition of a token at PSDSD. The first of these, SDS-1, cuts reactivity via 40 shutdown rods. Each rod must respond to the activation signal, correctly de-latch, and insert into the core, with the success and failure of these processes represented by TRPSS[1–40], TRDLS[1–40], and TRIS[1–40], and TRPSF[1–40], TRDLFa[1–40], and TRIF[1–40], respectively. The de-latching process relies on an actuator, which can fail prior to use, see TRACTF[1–40]. If is this is not repaired before demand, see TRACTR[1–40], its rod is not available. This is marked by a token at PRACTF[1–40], the presence of which blocks the firing of TRDLS[1–40], causing TRDLFb[1–40] to fire instead. The number of successful insertions is recorded at PNRIT and failures at PNRFT. Providing at least 38 of the 40 rods enter the core, reactivity is sufficiently quelled to achieve shutdown. However, if three or more rods fail, a subcritical state cannot be achieved, necessitating that a demand be placed for the neutron poison injection system, SDS-2.
Before use of SDS-2, the supplies of helium and boric acid must have remained intact. If ether are compromised, as represented by THESF1 and TBTL1 respectively, then it is necessary to perform an early reactor shutdown, as marked by the arrival of a token at PSDS2MS. An instance of spurious activation of the helium release mechanism, see THERMSO1, or spurious opening of any one of the three values releasing the boric acid, see TBPVSO1, TBRTVSO1, and TBMRVSO1, causes an unplanned shutdown by introducing undesired neutron poison to the core, marked by a token at PSDS2US. Otherwise, if all components of SDS-2 are ready for use, when a demand arrives the helium release mechanism either activates successfully or fails, respectively represented by THERMS1 and THERMF1. In the latter case, the next step is to open any one of the three valves capable of enabling flow of the boric acid poison. These are the pressure valve, the reactor trip valve, and the manual release valve, and SDS-2 attempts to open them in that order, represented by TBPVO1, TBRTVO1, and TBMRVO1, respectively, with the failure of each being given by TBPVF1, TBRTVF1, and TBMRVF1. If either the helium release mechanism or all three of the aforementioned valves fail, a token is placed on PSDS2F, marking the failure of SDS-2 and thus a complete failure to achieve reactor shutdown. Otherwise, successful completion of SDS-2 is marked by the addition of a token at PSDS2C.
4.2. Bond graph
4.2.1. Structure and parameters
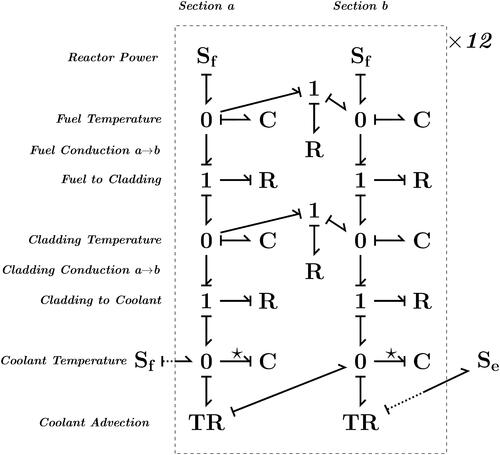
A bond graph model is used to simulate the temperature of critical core components, which aims to be adequately detailed for the demonstration, rather than providing a comprehensive simulation of reactor thermodynamics or neutronics. Specifically, the transfer of heat within a single coolant channel is considered. Within each channel, there are twelve clusters of 50 uranium dioxide fuel pins, cladded with Zircaloy-2. Thus, heat produced by the fuel is conducted through the cladding, into the coolant, which advectively carries thermal energy along the length of the channel and out of the core, as illustrated in . Each fuel cluster is also modelled in two parts lengthways, requiring the inclusion of longitudinal conduction. Therefore, in total, the bond graph model requires a total of 72 thermal capacitor elements, 72 resistor elements, of which, 48 to control temperature flow between fuel, cladding, and coolant, and 24 for longitudinal flow, and 24 transformer elements modelling the transfer of thermal energy by the motion of coolant. The model contains 25 flow source elements, with 24 providing the heat produced by the reactor and one to provide the initial thermal energy of the coolant as it enters, with a sink of effort at the end of the sequence removing the thermal energy leaving the channel in departing fluid. illustrates the repeated structure of the bond graph model.
Figure 10. Heat flow mechanisms between the fuel rod and the fluid in the core coolant channels. Not to scale.
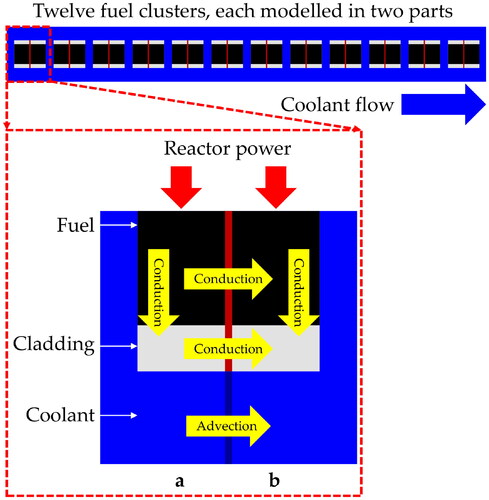
Figure 11. Pseudo-bond graph to model heat transfer in a nuclear reactor core from fuel pin clusters in a fuel rod to coolant fluid, separated by a layer of cladding. A fuel rod is comprised of twelve sets of 50 clusters, with each modelled in two sections, labelled a and b, with longitudinal conduction. Note that the coolant heat sources and sink elements only connect to the first and last sections respectively, and intermediate sections’ transformer elements attach to their successive neighbour. This bond graph represents the thermal transfer process shown schematically in . Each of the twelve units corresponds to one of the fuel pin clusters arranged in series along the length of a rod. The parameters for this model are given in .
Each fuel pin is 0.25 m long with a diameter of 4.5 × 10⁻³ m, covered in a 5 × 10⁻⁴ m thick layer of cladding. The total surface area contact between fuel and cladding for a cluster of 50 pins is therefore 0.354 m2, and 0.392 m2 between the cladding and the surrounding coolant. The combined cross-sectional area of the fuel pins is 3.18 × 10⁻³ m2 and 7.46 × 10⁻⁴ m2 for the cladding layer, and their total volumes are 7.96 × 10⁻⁴ m3 and 1.87 × 10⁻⁴ m3 respectively. Enveloping the clusters is a 0.1 m layer of coolant with a volume of 0.392 m3 per cluster. Given 450 rods, 4.44 kg⋅s–1 passes through each individual channel, and with each having 12 fuel clusters, the thermal power contribution of a single cluster is 1.70 × 10⁵ W. Given the aforementioned decay heat profile during shutdown, the flow value of a reactor power source element in the bond graph, , is given by
(14)
(14)
where
is its output at full normal operation,
is the time at which shutdown is initiated, and λ is a decay constant equal to
s−1. The coolant also brings thermal energy into the core in proportion to its initial temperature,
, and the incoming mass flow rate,
, such that its power contribution,
, for a fluid of specific heat capacity, cp, is
(15)
(15)
Three material properties key to parameterising the bond graph model are thermal conductivity, specific heat capacity, and density, and these are given for the fuel, cladding, and coolant in . The value for a given capacitance element in the bond graph is given by C, such that,
(16)
(16)
where V is its volume, and ρ and cp are the density and specific heat capacity of the material. For conduction between two capacitors in contact, the resistor element value,
, is given by
(17)
(17)
where A is the surface area of contact,
and
are the lengths of the object along the axis of heat flow, and k1 and k2 are their thermal conductivities (Holman Citation1990). The resistance contribution from convection where the cladding and coolant are in contact,
, is
(18)
(18)
where hc is the convection heat transfer coefficient (Holman Citation1990), with value 5 × 10⁴ W⋅(m
K)–1 for forced convection of water in a pipe (Whitelaw Citation2011). The overall value of the resistor element connecting coolant and cladding,
, is therefore
(19)
(19)
Table 2. Material properties of the fuel, cladding, and coolant used in the case study reactor
The transfer rate of thermal energy by coolant advection, , is given by,
(20)
(20)
where
is temperature of coolant upstream from the relevant transformer element. Recalling that the fuel clusters are modelled in two parts, the resulting values for the elements of the bond graph model are given in .
Table 3. Values for the elements of the bond graph found in
4.2.2. Test cases
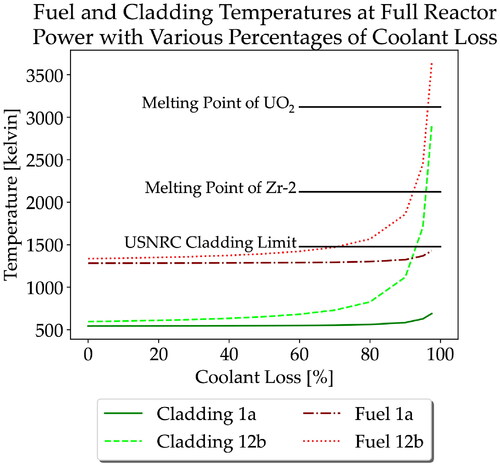
To gain an understanding of the temperatures produced by the bond graph under controlled conditions representing different reactor states, a few simple test cases are presented. First the temperatures reached in normal operation where considered. In , initial temperatures are set at 300 K for all components and the system is allowed to run until a steady state is reached, in this case 10 minutes. From the beginning to end of the channel, temperatures range from 535 K to 587 K, for the coolant, 543 K to 596 K for the cladding, and 1283 K to 1336 K for the fuel. In , the temperatures reached at full reactor power by the cladding and fuel across a range of coolant flow rate reductions are found. As the first and last sections of the bond graph have the minimum and maximum temperatures respectively, for the sake of visual clarity only sections 1a and 12b are plotted. For small losses of coolant, temperatures remain relatively stable for both the first and last section, but in the latter case, it is seen that temperatures escalate rapidly for extreme losses of coolant. Between a 90% to 100% loss of coolant, both fuel and cladding reach their melting points (3138 K (PubChem 2020) and 2122 K (Whitmarsh Citation1962) respectively). The USNRC stipulates a legal temperature limit of 1477 K for the cladding of reactors with Zr-2/UO2 fuel rods (United States Nuclear Regulatory Commission Citation2021), as Zr-2 is prone to exothermic chemical reactions at temperatures of this magnitude (Terrani et al., Citation2014), and this threshold is breached at a loss of coolant between 90% and 95%.
Figure 12. Coolant temperature during normal operation of the reactor with full power and coolant supply.
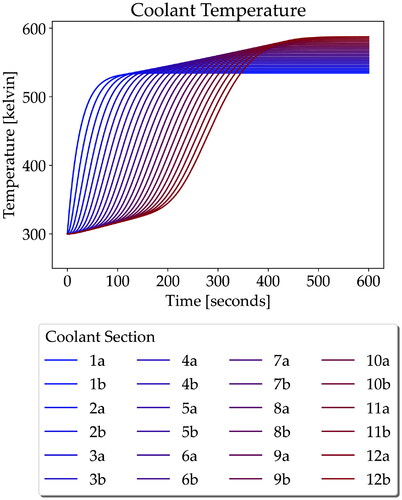
Figure 13. Cladding temperature during normal operation of the reactor with full power and coolant supply.
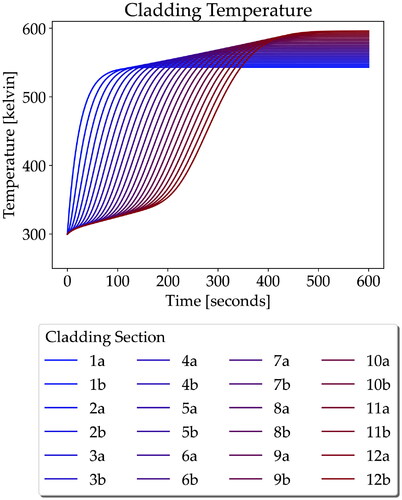
Figure 14. Fuel temperature during normal operation of the reactor with full power and coolant supply.
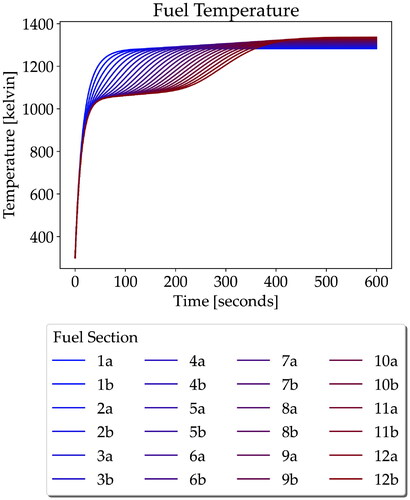
Figure 15. Temperatures of the first and last sections of fuel and cladding with full reactor thermal power input for various losses of coolant, given with respect to full normal flow rate. Their melting points (PubChem, 2020; Whitmarsh, Citation1962) and the USNRC legal limit for cladding temperature (United States Nuclear Regulatory Commission, Citation2021) are marked for reference.
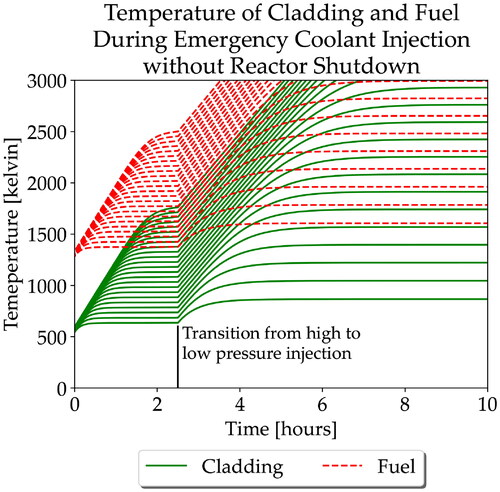
Cladding and fuel temperatures during shutdown condensation are shown in and . In the former, the reactor shutdown process completes normally, but in the latter, it fails, and it is shown that temperatures rapidly exceed acceptable limits. In and the fuel and cladding temperatures are shown during emergency coolant injection, respectively with and without successful reactor shutdown at the beginning of the process. In both scenarios, no remaining coolant flow contribution from the normal coolant circulation process or the shutdown condensers is included. The examples demonstrate that, providing the reactor is properly shutdown, the emergency coolant injection process alone is sufficient to cope with decay heat removal. Without shutdown however, temperatures quickly exceed the melting temperatures of the fuel and cladding if injection is the only source of coolant flow.
Figure 16. Temperature of cladding and fuel during the first 25 hours of shutdown condensation, with successful reactor shutdown.
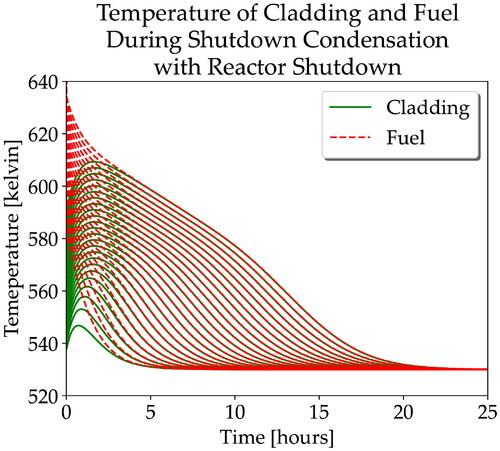
Figure 17. Temperature of cladding and fuel during the first 10 hours of shutdown condensation, without successful reactor shutdown. The temperature axis is truncated slightly below the melting point of UO2 as such results would be unphysical.
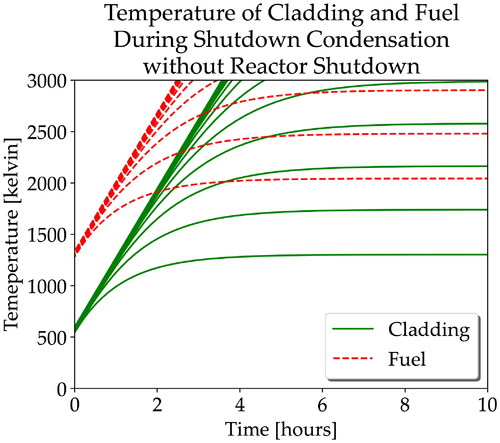
Figure 18. Temperature of cladding and fuel in the first 10 hours of emergency coolant injection, with simultaneous successful reactor shutdown.
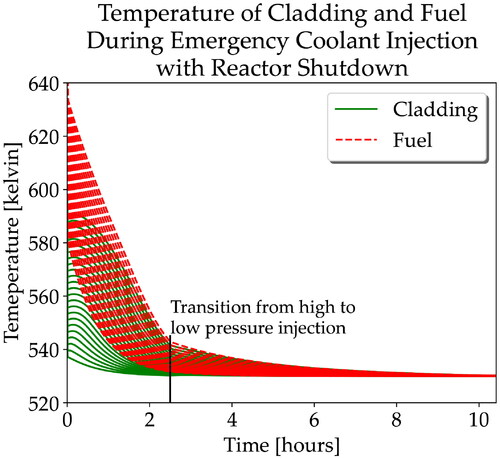
Figure 19. Temperature of cladding and fuel in the first 10 hours of emergency coolant injection, without reactor shutdown. The temperature axis is truncated slightly below the melting point of UO2 as such results would be unphysical.
4.3. Interface
The hybrid model proceeds by taking a single step forward in the Petri net, and then running the bond graph simulation until the clocks of the two models match, at which point, the temperatures of the fuel and cladding elements are inspected to see if they remain within acceptable limits. If the cladding exceeds the aforementioned USNRC limit, a reactor shutdown will be requested (if not already in progress), but if its temperature cannot be held below 1500 K, or if the fuel reaches its melting point, the simulation will end with core damage deemed to have occurred. Otherwise, the hybrid model continues taking steps forward in the Petri net and correspondingly advancing the bond graph until the end of three years of reactor operation plus the 40 day shutdown period. The values of reactor power and the coolant mass flow rate are updated to match the condition of the reactor on the basis of the state of the Petri net at the end of the most recent step. Reactor power is set by EquationEquation (14)(14)
(14) , with the time of completion of either SDS-1 or SDS-2 in the Petri net setting the value of
. In , coolant flow is given for different modes of reactor operation with respect to the full normal rate of supply. Note that if injection is ongoing during either normal operation or shutdown condensation, its coolant contribution is added to the flow rate of the former, rather than replacing it. Breaks in the coolant pathways ways will cause reductions in the mass of fluid passing through the coolant channels and the full list of effects is given in . The hybrid model can terminate in any of the states described in section 4.1 as well as with the either the fuel or cladding reaching the maximum permissible temperatures.
Table 4. Coolant contributions for various modes of operation of the nuclear reactor coolant system, given as a percentage of full normal operational flow
Table 5. Coolant supply reductions resulting from breaks in the reactor coolant system
5. Results and discussion
A total 1.5 × 10⁵ iterations of the hybrid model were performed, representing over 1000 core hours of simulation time, plus a few tens of hours for the subsequent file transfers and data processingFootnote4. The predicted probabilities of each possible outcome are seen in , and the distribution of times at which early maintenance shutdown or unplanned shutdown occurred are shown in and respectively, with giving the probability that the reactor will continue to operate uninterrupted for a given duration from start-up until shutdown. displays the distribution of the minimum coolant mass flow across all iterations, and and likewise show the distribution of maximum temperatures across the cladding and fuel components.
Figure 20. Predicted time of early shutdown for maintenance simulated by the hybrid Petri net-bond graph. Percentages are given relative to all outcomes.
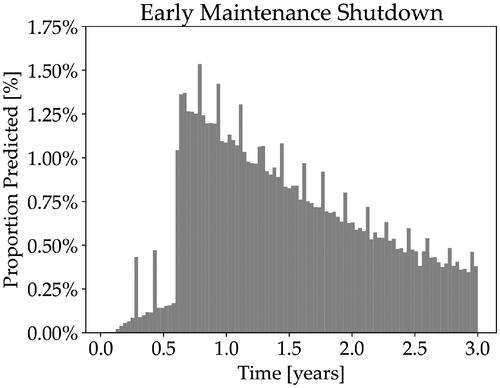
Figure 21. Predicted time of unplanned shutdown caused by spurious neutron poison injection simulated by the hybrid Petri net-bond graph. Percentages are given relative to all outcomes.
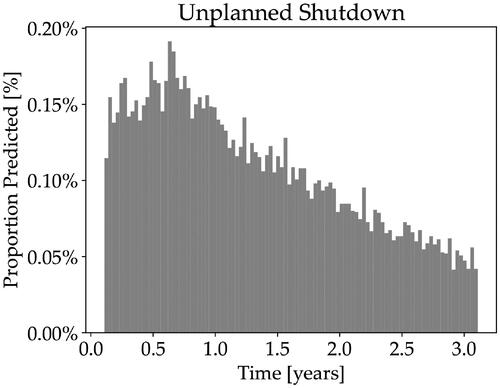
Figure 22. Probability with respect to time of the reactor system operating uninterrupted without encountering a critical failure or the need to shut down for repair simulated by the hybrid Petri net-bond graph.
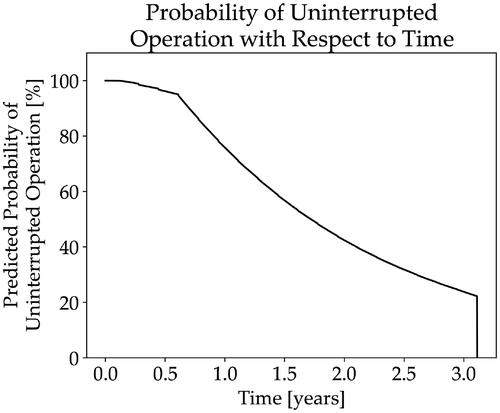
Figure 23. Predicted range of the minimum coolant mass flows simulated by the hybrid Petri net-bond graph.
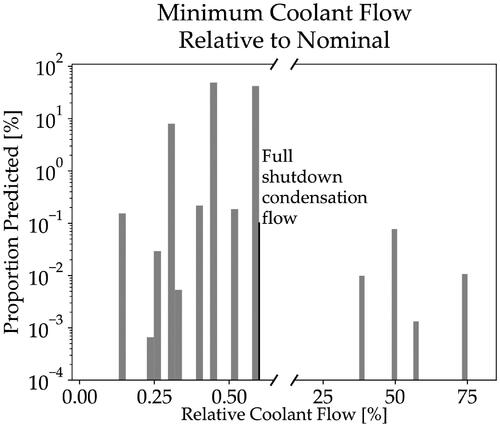
Figure 24. Predicted range of the maximum cladding temperatures simulated by the hybrid Petri net-bond graph.
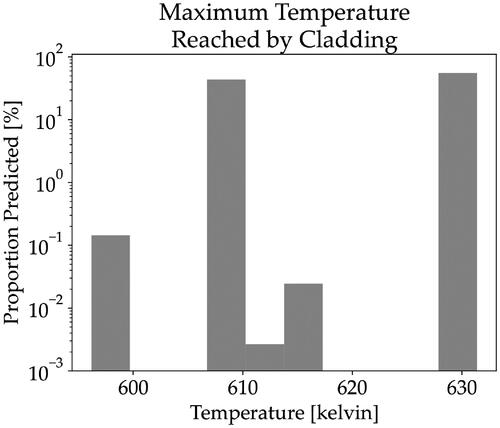
Figure 25. Predicted range of the maximum fuel temperatures simulated by the hybrid Petri net-bond graph.
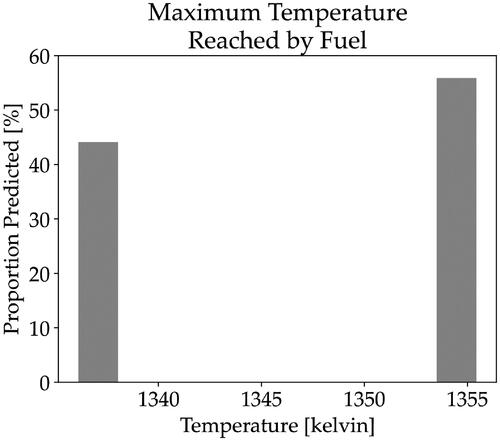
Table 6. Predicted probabilities of outcomes from reactor operation
As seen in , a probability less than one in four is predicted for reaching the end of the full scheduled operational period, with the most likely outcome being early shutdown at a little above 65%. The mean time predicted for the latter such cases is about half way through the full period. A probability of slightly more than one in ten is found for unplanned shutdown from spurious SDS-2 deployment, with this outcome having a mean time a little over 40% of the full scheduled period. Overall, the reactor is predicted to operate for about 60% of the intended duration on average.
Inspecting data from the Petri net further, two prominent features stand out; Firstly the six month delay from the first steam circuit or pressure accumulator fault until early shutdown (providing no other faults of the same type) is visible in both and , as the probability of reactor shutdown increases substantially after this point. Secondly, spikes in shutdown likelihood are seen periodically, corresponding to the periods when one of the feed pumps was being serviced, meaning that no redundancy was available. Although these two occurrences are not directly relevant to the ‘unplanned shutdown’ outcome, their consequences are still visible in , with the probability distribution of reactor operational period being reflected in the former, as the reactor can only experience spurious shutdown system activation when it is running. In , probabilities of faults relevant to these events are found (refer to for the probability of unplanned shutdown resulting from spurious SDS-2 action). Consistent with their prominence in the aforementioned figures, there is a high probability of two concurrent steam circuit failures and of a failure to provide sufficient feed pump capacity. However, more extreme events, such as three concurrent steam circuit failures or sufficient disruption to the supply of coolant to warrant emergency injection are an order of magnitude less likely.
Table 7. Probabilities calculated for the occurrence of events of particular interest in the reactor system
From it is seen that disruptions to coolant remained manageable within the sampled population, and this is reflexed in the distribution of temperatures observed in and (Note that the small number minimum coolant flow values in the tens of percent on represent failure of isolation valve closure). While increases above the nominal values are seen, neither the cladding nor the fuel reach temperatures that would be considered dangerous, placing the probability of encountering such an event during the period from reactor activation to shutdown below 0.0007%. Given the mean operational duration for all outcomes seen in , this implies that dangerous temperatures occur in the cladding or fuel at a rate below (3.596 ± 0.004)×10–6 per year of operation.
6. Conclusions
In this research, a bond graph approach was developed to model the heat transfer process in the interaction between a nuclear reactor fuel rod and the fluid in its surrounding coolant channel. The model has been used to predict temperatures for the fuel and its cladding during both normal operation and shutdown condensation, providing that in the latter case proper reactor shutdown is achieved. Furthermore, it is shown that adequate heat extraction is provided to safely remove post-shutdown decay heat if it were to be necessary to rely on the emergency coolant injection system alone.
The results from the combination of the bond graph model with a Petri net, demonstrate how the hybrid methodology can be used to translate changes in the state of the reactor and faults generated by the Petri net into physical changes in the thermodynamics at the core of the reactor. The data indicates a low probability of dangerous temperatures arising in the cladding or fuel for the case study system. The developed model has the potential to simulate differing initial conditions and alternative reactor scenarios which feature various other configurations of fuel, cladding, and coolant circulation.
The methodology presented has some limitations which future work could conceivability address. For a complex system, construction of the model can be extensively time consuming, which impedes rapid turnaround of safety assessment feedback to design engineers. However, parts of this process have the potential to be automated, particularly with respect to the Petri net. The degree of communication between the two parts of the model could be expanded. For instance, the bond graph presented can trigger events in the Petri net, but it would also be helpful for the temperatures calculated to be used to adjust the probability of component failures where relevant. Similarly, a bond graph model could additionally be used to simulate coolant pressure for same purpose. The simulation process is relatively costly in terms of CPU time expended, but this is not an issue with the methodology itself and could be mitigated with a bespoke software application.
Disclosure statement
No potential conflict of interest was reported by the author(s).
Additional information
Funding
Notes
1 The Modelica Association – Modelica Association, www.modelica.org
2 Functional Mock-up Interface, www.fmi-standard.org
3 modelon-community/Pyramid – GitHub, www.github.com/modelon-community/PyFMI
4 The computation was performed on three desktop computers, respectively with a four-core 3.2 GHz CPU (3.6 GHz boost) and 16 GB of RAM, a six-core 3.2 GHz CPU (4.6 GHz boost) and 8 GB of RAM, and a 16-core 2.5 GHz CPU (4.8 GHz boost) and 32 GB of RAM, all running Python 3.8.5 (Anaconda) with PyFMI 2.8.5 on Ubuntu 20.04.3 LTS.
References
- Aldemir, T. (2013). A survey of dynamic methodologies for probabilistic safety assessment of nuclear power plants. Annals of Nuclear Energy, 52, 113–124. https://doi.org/10.1016/j.anucene.2012.08.001
- Allard, B., Helali, H., Lin, C.-C., & Morel, H. (1995). Power Converter Average Model Computation using the Bond Graph and Petri Net Techniques. In Ieee pesc (pp. 830–836). https://doi.org/10.1109/pesc.1995.474913
- Allard, B., Morel, H., & Chante, J.-P. (1993). Power electronic circuit simulation using bond graph and Petri network techniques. In Proceedings of IEEE Power Electronics Specialist conference - PESC'93. https://doi.org/10.1109/PESC.1993.471933
- Andersson, C., Åkesson, J., & Führer, C. (2016). PyFMI: A Python Package for Simulation of Coupled Dynamic Models with the Functional Mock-up Interface. Technical Report in Mathematical Sciences, 2016(2). https://portal.research.lu.se/en/publications/pyfmi-a-python-package-for-simulation-of-coupled-dynamic-models-w
- Andrews, J. D., & Dunnett, S. J. (2000). Event-tree analysis using binary decision diagrams. IEEE Transactions on Reliability, 49(2), 230–238. https://doi.org/10.1109/24.877343
- Badoud, A., Khemliche, M., & Latreche, S. (2009). Modeling, simulation and monitoring of nuclear reactor using directed graph and bond graph. International Journal of Computer and Systems Engineering, 3(1), 71–80.
- Balbo, G. (2007). Introduction to Generalized Stochastic Petri Nets. In M. Bernardo & J. Hillston (Eds.), Formal Methods for Performance Evalutation – 7th International School on Formal Methods for the Design of Computer, Communication and Software Systems, SFM 2007., may/june 2007, advanced lectures, lecture notes in computer science (Vol. 4486, pp. 83–131). Springer.
- Barringer & Associates, Inc. (2010). (Last edited: Weibull Reliability Database For Failure Data For Various Components. www.barringer1.com/wdbase.htm Accessed November 2018.
- Bentaleb, T., Pham, M. T., Eberard, D., & Marquis-Favre, W. (2018). Bond graph modeling and analysis of intermediary cooling system of a nuclear power plants [Paper presentation]. 2018 Ieee International Conference on Industrial Technology (Icit), (pp. 93–98). https://doi.org/10.1109/icit.2018.8352158
- Borutzky, W., Dauphin-Tanguy, G., & Thoma, J. U. (1995). Advances in bond graph modelling: theory, software, applications. Mathematics and Computers in Simulation, 39(5–6), 465–475. https://doi.org/10.1016/0378-4754(95)00106-6
- Bouhalouane, M., Larbi, S., & Haffaf, H. (2015). Combining bond graphs and petri nets formalism for modelinghybrid dynamic systems. In The 10th International Conference on Future Networks and Communications (Fnc 2015), Procedia Computer Science (Vol. 56, pp. 252–259.). https://www.sciencedirect.com/science/article/pii/s1877050915016865
- Bouhalouane, M., Sekhri, L., & Haffaf, H. (2020). On extending transitions logic in hybrid dynamic systems based on bond graph and Petri nets combination. International Journal of System of Systems Engineering, 10(1), 1–23. https://doi.org/10.1504/ijsse.2020.105421
- Brînzei, N., & Aubry, J.-F. (2018). Graphs models and algorithms for reliability assessment of coherent and non-coherent systems. Proceedings of the Institution of Mechanical Engineers, Part O: Journal of Risk and Reliability, 232(2), 201–215. https://doi.org/10.1177/1748006X17744381
- Cellier, F. E., & Nebot, À. (2005). The Modelica Bond Graph Library. In Proceedings of the 4th International Modelica Conference, Hamburg (pp. 57–65).
- Clarke, G. M., & Cooke, D. (1978). A Basic Cource in Statistics. (2004, 5th ed.). John Wiley & Sons Ltd.
- Dennis, B., & Patil, G. P. (1987). Lognormal Distributions, Theory and Applications. In E. L. Crow & K. Shimizu, Eds. Marcel Dekker.
- Eide, S. A., & Calley, M. B. (1993). Generic component failure database. Proceedings of PSA International Topical Meeting pp 1175, 2.
- Eide, S. A., Chmielewski, S. V., & Swantz, T. O. (1990). Generic Component Failure Data Base for Light Water and Liquid Sodium Reactor PRAs. Idaho National Engineering Laboratory. https://www.osti.gov/biblio/10117849
- Ekanayake, T., Dewasurendra, D., Abeyratne, S., Ma, L., & Yarlagadda, P. (2019). Model-based fault diagnosis and prognosis of dynamic systems: a review. Procedia Manufacturing, 30, 435–442. https://doi.org/10.1016/j.promfg.2019.02.060
- Energy and light. (2008). The Open University. (p.179)
- Fritzson, P., & Engelson, V. (1998). Modelica – A unified object-oriented language for system modeling and simulation. Jul E. (ed) ECOOP’98 – Object-Oriented Programming. ECOOP 1998. Lecture Notes in Computer Science, 1445.
- Holman, J. P. (1990). Heat Transfer. (2010, 10th ed.). McGraw-Hill Higher Education.
- IAEA. (1988). IAEA-TECDOC-478 Component Reliability Data for Use in Probabilistic Safety Assessment. (Tech. Rep.). International Atomic Energy Agency.
- Incropera, F. P., & de Witt, D. P. (1990). Fundamentals of Heat and Mass Transfer. Wiley.
- Jiang, R., & Murthy, D. N. P. (2011). A study of Weibull shape parameter: Properties and significance. Reliability Engineering & System Safety, 96(12), 1619–1626. https://doi.org/10.1016/j.ress.2011.09.003
- Jyotish, N. K., Singh, L. K., & Kumar, C. (2022). A state-of-the-art review on performance measurement petri net models for safety critical systems of NPP. Annals of Nuclear Energy, 165, 108635. https://doi.org/10.1016/j.anucene.2021.108635
- Kachur, S. A., & Shakhova, N. V. (2016). Turbine generator status diagnostic system based on petri nets. Nuclear Energy and Technology, 2(2), 81–84. https://doi.org/10.1016/j.nucet.2016.05.002
- Karnopp, D. (1978). Pseudo bond graphs for thermal energy transport. Journal of Dynamic Systems, Measurement, and Control, 100(3), 165–169. https://doi.org/10.1115/1.3426363
- Kumar, P., Singh, L. K., & Kumar, C. (2019). Performance evaluation of safety-critical systems of nuclear power plant systems. Nuclear Engineering and Technology, 52(3), 560–567. https://doi.org/10.1016/j.net.2019.08.018
- Lee, S. J., & Seong, P. H. (2004). Development of automated operating procedure system using fuzzy colored petri nets for nuclear power plants. Annals of Nuclear Energy, 31(8), 849–869. https://doi.org/10.1016/j.anucene.2003.12.002
- Metropolis, N., & Ulam, S. (1949). The Monte Carlo method. Journal of the American Statistical Association, 44(247), 335–341. https://doi.org/10.1080/01621459.1949.10483310
- Michel, P., Maschke, B., & Manesse, G. (1993). Bond-Graph Enumeration of the Configurations of Power Static Converters [Paper presentation]. International Conference on Systems, Man and Cybernetics, In Proceedings of IEEESystems Man and Cybernetics Conference - SMC, Le Touquet, France, 1993, (Vol. 1, pp. 251–256). https://ieeexplore.ieee.org/document/384753
- Miller, C. F., W. H., Hubble, M. T., & Brown, S. R. (1982). Data summaries of Licensee Event Reports of valves at US commercial nuclear power plants: January 1, 1976 to December 31, 1980 (Tech. Rep.).– Prepared for U.S. Nuclear Regulatory Commission. EG and G Idaho, Inc.
- Mokhtar, B., & Hafid, H. (2012). An hybrid Bond Graph approach using Petri Net [Paper presentation].16th IEEE Mediterranean Electrotechnical Conference, 438–441. https://ieeexplore.ieee.org/document/6196467
- Morris, S. (2019). Failure Rate Estimates for Mechanical Components. www.reliabilityanalyticstoolkit.appspot.com/mechanical_reliability_data
- Németh, E., Bartha, T., Fazekas, C., & Hangos, K. M. (2009). Verification of a primary-to-secondary leaking safety procedure in a nuclear power plant using coloured Petri nets. Reliability Engineering & System Safety, 94(5), 942–953. https://doi.org/10.1016/j.ress.2008.10.012
- Papoulis, A., & Pillai, S. U. (2002). Probability, Random Variables and Stochastic Processes. (4th ed.; C. F. Shultz & M. L. Flomenhoft, Eds.). McGraw Hill.
- Paynter, H. M. (1961). Analysis and Design of Engineering Systems. The M.I.T. Press.
- Petri, C. A. (1962). Kommunikation mit Automaten. (Unpublished doctoral dissertation) Technical University Darmstadt.
- Pettersson, S., & Lennartson, B. (1995). Hybrid Modelling focused on Hybrid Petri Nets. In 2nd european workshop on real-time and hybrid systems (pp. 303–309).
- Ponciroli, R., Cammi, A., Lorenzi, S., & Luzzi, L. (2016). Petri-net based modelling approach for ALFRED reactor operation and control system design. Progress in Nuclear Energy, 87, 54–66. https://doi.org/10.1016/j.pnucene.2015.10.009
- Popov, S. G., Carbajo, J. J., Ivanov, V. K., & Yonder, G. L. (2000). Thermophysical Properties of MOX and UO2 Fuels Including the Effects of Irradiation. (Tech. Rep. No. ORNL/TM-2000/351). Fissile Materials Disposition Program, Oak Ridge National Laboratory.
- PubChem. (2020, Februrary). Uranium dioxide. U.S. National Library of Medicine National Center for Biotechnology Information www.pubchem.ncbi.nlm.nih.gov/compound/Uranium-dioxide
- Rasmussen, N. C. (1975). Reactor safety study: An assessment of accident risks in US commercial nuclear power plants (WASH-1400) (Tech. Rep.). US Nuclear Regulatory Commission.
- Reliability Eta Beta database. (2020, January (www.reliabilityetabeta.com)).
- Schneeweiss, W. G. (2004). Petri Net Picture Book (an Elementary Introduction to the Best Pictorial Description of Temporal Changes). LiLoLe – Verlag GmbH (Publ. Co. Ltd.).
- Singh, L., & Rajput, H. (2016). Safety analysis of life critical software systems: a case study of nuclear power plant. IETE Technical Review, 34(3), 333–339. https://doi.org/10.1080/02564602.2016.1190305
- Singh, L. K., Vinod, G., & Tripathi, A. K. (2016). Early prediction of software reliability: A case study with a nuclear power plant system. Computer Magazine, 49(1), 52–58. https://doi.org/10.1109/mc.2016.15
- Sinha, R. K., & Kakodkar, A. (2006). Design and development of the AHWR – the Indian thorium fueld innovative nuclear reactor. Nuclear Engineering and Design, 236(7-8), 683–700. https://doi.org/10.1016/j.nucengdes.2005.09.026
- Smith, D. J. (1981). Reliability, Maintainability and Risk. Practical Methods for Engineers including Reliability Centred Maintenance and Safety-Related Systems. (2005, 7th edition ed.). Elsevier Butterworth-Heinemann.
- Sosnovsky, E., & Forget, B. (2013). Bond graphs for spatial kinetics analysis of nuclear reactors. Annals of Nuclear Energy, 56, 208–226. https://doi.org/10.1016/j.anucene.2013.01.012
- Sosnovsky, E., & Forget, B. (2014). Bond graph representation of nuclear reactor point kinetics and nearly incompressible thermal hydraulics. Annals of Nuclear Energy, 68, 15–29. https://doi.org/10.1016/j.anucene.2013.12.013
- Terrani, K. A., Zinkle, S. J., & Snead, L. L. (2014). Advanced oxidation-resistant iron-based alloys for LWR fuel cladding. Journal of Nuclear Materials, 448(1–3), 420–435. https://doi.org/10.1016/j.jnucmat.2013.06.041
- United States Nuclear Regulatory Commission. (2021, October). (Last edited: § 50.46 Acceptance criteria for emergency core cooling systems for light-water nuclear power reactors.) www.nrc.gov/reading-rm/doc-collections/cfr/part050/part050-0046.html .
- Vasilyev, A., Andrews, J., Jackson, L., Dunnett, S., & Davies, B. (2017). Component-based modelling of PEM fuel cells with bond graphs. International Journal of Hydrogen Energy, 42(49), 29406–29421. https://doi.org/10.1016/j.ijhydene.2017.09.004
- Vesely, W. E. (1970). A time-dependent methodology for fault tree evaluation. Nuclear Engineering and Design, 13(2), 337–360. https://doi.org/10.1016/0029-5493(70)90167-6
- Watson, H. A. (1961). Launch control safety study. (Tech. Rep.). Bell Labs.
- Whitelaw, J. H. (2011). (Last edited: CONVECTIVE HEAT TRANSFER. www.thermopedia.com/es/content/660/ Accessed February 2018.
- Whitmarsh, C. L. (1962). Review of Zircaloy-2 and Zircaloy-4 Properties Relevant to N.S. Savannah Reactor Design (Tech. Rep. Nos. ORNL-3281 UC-80 – Reactor Technology TID-4500). Oak Ridge National Laboratory. (17th edition)
- Wootton, M. J., Andrews, J., Lloyd, A. L., Smith, R., Arul, A. J., Vinod, G., Prasad, S.H., Garg, V. (2019). Petri nets and pseudo-bond graphs for a nuclear reactor primary coolant system. Proceedings of the 29th European Safety and Reliability Conference, 3831–3839.
- Wootton, M. J., Andrews, J. D., Lloyd, A. L., Smith, R., Arul, A. J., Vinod, G., Prasad, M. H., & Garg, V. (2022). Risk modelling of ageing nuclear reactor systems. Annals of Nuclear Energy, 166, 108701. https://doi.org/10.1016/j.anucene.2021.108701
- Xu, H., & Dugan, J. B. (2004). Combining dynamic fault trees and event trees for probabilistic risk assessment. In Annual Symposium Reliability and Maintainability, 2004 - RAMS. IEEE. pp. 214–219. https://ieeexplore.ieee.org/document/1285450
- Zanzouri, N., & Tagina, M. (2002). A comparative study of hybrid system monitoring based on bond graph and petri net modelling. In Ieee International Conference on Systems, Man and Cybernetics (Vol. 4, pp. 6.). https://ieeexplore.ieee.org/document/1173226
- Zhou, Z., Ma, Z., Jiang, Y., & Peng, M. (2022). Fault diagnosis using bond graphs in an expert system. Energies, 15(15), 5703. https://doi.org/10.3390/en15155703
- Zimmer, D., & Cellier, F. E. (2006). The modelica multi-bond graph library. In Proceedings of the 5th International Modelica Conference (pp. 559–568.). https://www.semanticscholar.org/paper/the-modelica-multi-bond-graph-library-zimmer-cellier/91fafc9f858b4ee487df4ee326946cdcc98eaba8
Appendix
A.1. Nomenclature
A.1.1. Equations
a Duration to fire for a fixed duration Petri net transition
t Time
…)
u Maximum firing time for a uniform distribution Petri net transition
c Firing interval for cyclic Petri net transition
ω Firing offset for cyclic Petri net transition
η Weibull distribution shape parameter
β Weibull distribution scale parameter
μ Mean of the natural logarithm of the firing time of a log-normal Petri net transition
σ Standard deviation of the natural logarithm of the firing time of a log-normal Petri net transition
P Modifying factor for a place conditional Petri net arc
Wi Weight of ith place conditional arc
Ni Tokens held by place connecting to ith place conditional arc
e Effort value of a bond
f Flow value of a bond
R Value of bond graph resistor element
C Value of bond graph capacitor element
I Value of bond graph inductor element
p Integrated effort
q Integrated flow
λ Decay constant
T Temperature
cp Specific heat capacity
ρ Density (mass per unit volume)
V Volume
k Thermal conductivity
hc Convection heat transfer coefficient
A Surface area of contact
A.1.2. Petri net model objects
Initialisms relating to their function are used to assign labels to places and transitions. Where multiple objects fulfil the same role in duplicated components, they are referenced in the text using the common part of their label with the remainder written in square brackets, e.g. LABEL[1–4], which would indicate the objects LABEL1, LABEL2, LABEL3, and LABEL3.
Places Place objects are drawn as circles with labels starting with ‘P’.
General Places with white colouration have no special properties
Terminal Places with black colouration end the simulation when they receive a token.
● Initial tokens held by a place are marked as black dots.
Transitions Transitions are drawn as squares with labels starting with ‘T’.
Timed White transitions fire after delay once their enabling conditions are met in accordance with a given probability distribution.
Instant Grey transitions fire with no delay from when they were enabled.
Voting Transitions with a dot-dash border only require that a given threshold of their incoming arcs have their weight met. This threshold is marked in black circle on the transition.
Arc Arcs are drawn as lines between places and transitions with a arrowhead or circle marking their direction. A number written adjacent to an arc denotes its weight. An unadorned arc has weight equal to one.
 Standard arc
 Test arc pair
 Standard arc incoming to voting transition
 Inhibit arc
 Place conditional arc
A.1.3. Bond graph symbols
R Resistor element (dissipates energy)
C Capacitor element (stores energy)
I Inductor element (inertance behaviour)
Se Source/sink of effort
Sf Source/sink of flow
TR Transformer element (applies scale factor)
GY Gyrator element (converts between energy domains)
0 Equal effort multi-port junction
1 Equal flow multi-port junction
 Bond (arrow head denotes positive directionality)
 Bond with instantaneous flow at start
 Bond with instantaneous flow at end
A.1.4. Initialisms, abbreviations, and chemical formulae
USNRC United States Nuclear Regulatory Commission
Zr-2 Zircalloy-2
UO2 Uranium Dioxide
AOV Air operated valve
SDS-1 Shutdown system one (rods)
SDS-2 Shutdown system two (boric acid injection)
H3BO3 Boric acid
FMU Functional mock-up unit
H2O Light water
A.2. Petri net sections
The individual sections of the Petri net model seen in are visible separately in .
Figure A.1 Primary coolant circulation section of the Petri net seen in .
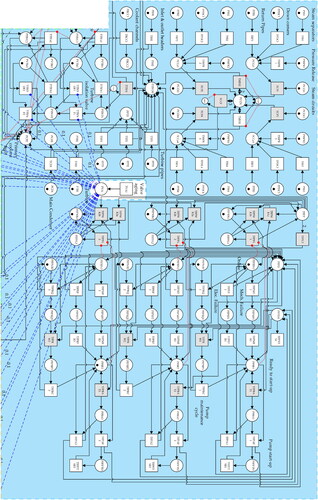
Figure A.2 Shutdown condensation section of the Petri net seen in .
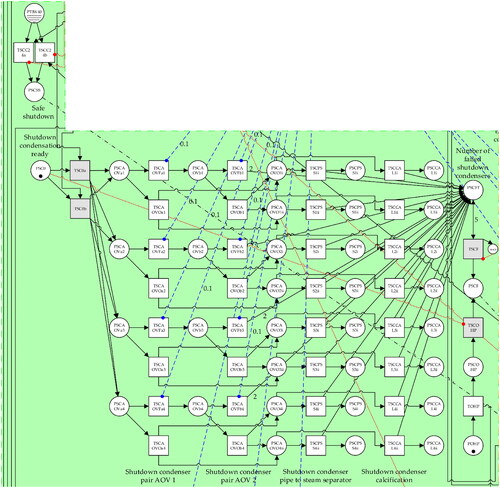
Figure A.3 Emergency coolant injection section of the Petri net seen in .
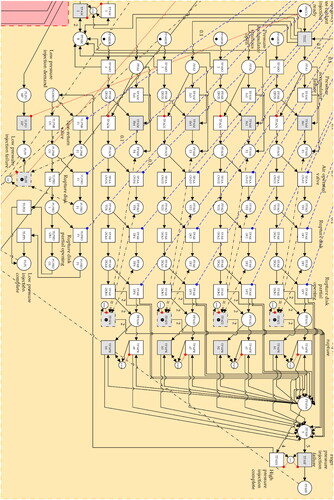
Figure A.4 Emergency coolant injection section of the Petri net seen in .