
 ?Mathematical formulae have been encoded as MathML and are displayed in this HTML version using MathJax in order to improve their display. Uncheck the box to turn MathJax off. This feature requires Javascript. Click on a formula to zoom.
Abstract
Low folate status is a risk factor for birth defects. We studied concentrations of red blood cell (RBC)- and serum folate in 198 German women in relation to information on dietary folate intake, demographic and lifestyle factors. Median serum- and RBC-folate levels were; (14.7 and 589 nmol/L, respectively. Serum < 7.0 nmol/L or RBC-folate < 405 nmol/L were observed in 3.5% and 18.7% of the women, respectively. Three per cent of the women had both lowered serum and RBC-folate. Whereas RBC-folate > 952 nmol/L (optimal levels around conception) were observed in 9.6%. Serum- and RBC-folate were positively associated; they showed the expected correlations with homocysteine, but only weak correlations with folate intake. Younger age, lower fibre and higher carbohydrate intakes were associated with lower blood folate. Thus, folate intake of approximately 278 µg/d was not sufficient to achieve optimal folate status in young women. In conclusion, in the absence of fortification with folic acid, the majority of the women did not achieve folate status that is optimal for prevention of birth defects.
Introduction
Low concentrations of red blood cell (RBC)-folate in women around conception predicts the risk of neural tube defects (NTDs) in the child (Daly et al. Citation1995). There is a dose–response relationship between women’s RBC-folate levels and NTD risk (Crider et al. Citation2014). Levels above >906 nmol/L (Molloy and Scott Citation1997) provide optimal prevention of folate-sensitive NTDs (Crider et al. Citation2014; World Health Organization Citation2015). Whereas levels >340 nmol/L are associated with a lower risk for folate deficiency anaemia. Achieving RBC-folate levels >906 nmol/L is more likely when using folate-containing supplements or folic acid fortified foods (Shi et al. Citation2014; Shere et al. Citation2016). Fortification of staple foods with folic acid is the most effective way to improve folate status and prevent conditions caused by folate deficiency (van Gool et al. Citation2018). Folic acid fortification is not applied in Europe and using preconceptional supplements is not common among young women (Bestwick et al. Citation2014). The incidence of NTDs is high (Obeid et al. Citation2015) and folate intake and status are low in Europe compared with countries applying fortification (Smulders et al. Citation2007; Bakker et al. Citation2009).
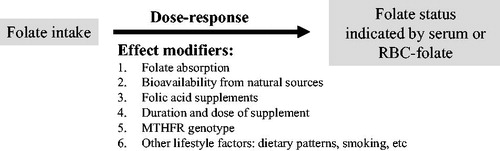
There is an association between folate intake and blood markers (Hoey et al. Citation2007; Hopkins et al. Citation2015), but this association is not linear over the whole intake range and may differ according to sources of folate (natural diet or folic acid) (Hoey et al. Citation2007). Berti et al. (Citation2012) reported 23% higher RBC-folate concentrations for doubling the intake (Berti et al. Citation2012). Another study among healthy women (12–49 years) estimated that every 10% increase in folate intake is associated with a 6% increase (95%CI: 4%, 9%) in RBC-folate level and a 7% (95%CI: 1%, 12%) increase in serum/plasma folate (Marchetta et al. Citation2015). Several factors influence the association between folate intake and status markers such as using fortified products or supplements containing folic acid (Hoey et al. Citation2007), folate requirements, absorption, and polymorphisms in folate metabolising enzymes (). Demographic and lifestyle factors such as sex (Hopkins et al. Citation2015), age (Bailey et al. Citation2015), smoking (Rasmussen et al. Citation2000) and education (Shi et al. Citation2014) indirectly affect the relationship between folate intake and status (Hoey et al. Citation2007) and may thus modulate the risk of birth defects. The impact of these factors can be significant in populations with low dietary folate intakes.
Figure 1. Folate intake is a determinant of folate status. The relationship is influenced by several effect modifiers. Therefore, a dose–response relationship between intake and status markers is not necessarily present in a population with a generally low intake and no additional sources of folate.
A total folate intake as low as 200 µg dietary folate equivalent (DFE)/d may prevent anaemia in young women (Sauberlich et al. Citation1987). A dietary intake in the range between 300 and 400 µg DFE/d (Standing Committee on the Scientific Evaluation of Dietary Reference Intakes Citation1998; Krawinkel et al. Citation2014; Bailey et al. Citation2015) can prevent depletion of folate stores, but it is unlikely to be sufficient in achieving optimal RBC-folate concentrations to prevent birth defects. A folate intake ≥450 µg DFE/d has been reported to be necessary to achieve preventive RBC-folate on long term (Marchetta et al. Citation2015).
Most reports from European women who are not exposed to mandatory fortification with folic acid have focussed on folate status and its role in pregnant women (Brough et al. Citation2009; Vandevijvere et al. Citation2012). Determinants of folate status in women of childbearing age have received less attention (de weerd et al. Citation2002; Brough et al. Citation2009; Ohrvik et al. Citation2018). The objective of the current study was to investigate determinants of folate biomarkers; serum and RBC-folate, and plasma total homocysteine (tHcy) in young German women not exposed to mandatory folic acid fortification and not receiving additional folate from supplements.
Subjects and methods
Study setting, participants and design
The original study was designed to investigate the effect of 2 doses of vitamin D on vitamin D status in young women (Pilz et al. Citation2017). The current report is concerned with baseline folate status that was a secondary outcome of the original study. The study was conducted between January and May 2016 in Germany. Healthy women aged between 18 and 45 years were invited to participate through announcements in local newspapers and media. Exclusion criteria included taking supplements containing folate or vitamin D during the last 2 months, vascular diseases, diseases that affect intestinal absorption (i.e. pernicious anaemia, colitis ulcerosa, Crohn disease), history of cancer, diabetes, any acute infections or treatment with antibiotics or antifolate, and BMI < 17 kg/m2 or >30 kg/m2.
Two hundred one women who fulfilled the inclusion criteria and provided a baseline blood sample at visit I were included in the present study. The study population consisted of 198 women (median age 25 years) who provided information on dietary intake and lifestyle and blood samples for measurements of folate markers (Figure S1).
The ethical principles for medical research involving human subjects stated in Helsinki Declaration were considered. The medical ethics commission of the Baden-Württemberg region has reviewed and approved the study (approval number: F-2015-102) and all participants provided a signed consent.
Dietary intake and lifestyle factors
Information on dietary intakes was collected using food diary protocol filled on 3 consecutive days prior to visit 1 and again 8 weeks later (prior to visit 3). The protocol was distributed during the screening visit and had to be filled before the first visit. It consisted of a self-administered booklet that asks participants to report the frequency of consumption and portion size of approximately 120 pre-defined items typical to the German lifestyle. The results of the food frequency protocol were analysed using EBISPro software (version 2016, SPSS Inc., Chicago, IL) based on a country-specific nutrient content database [Bundeslebensmittelschlüssel (BLS) Version 3.02 and USDA Version 28, SPSS Inc., Chicago, IL]. Intake of folic acid through voluntary fortification was not evaluated because of the lack of this information in the BLS database. Total energy intake and intakes of macro- and micronutrients were evaluated. The participants took part in a supplementation trial in the following 8 weeks after the first visit and were instructed to avoid folate fortified products that are sporadically available in the German food market. Mean dietary folate intake at baseline was higher than that after 8 weeks [mean (SD) of the 198 women = 317 (160) µg/d at baseline and 293 (137) µg/d after 8 weeks; p = .029]. The intake data in the present study were the mean of 2 × 3-d average intake data from two protocols repeated within 8 weeks (visits 1 and 3).
Information was collected on age, BMI, hormonal contraceptive usage, education, number of children (parity) and lifestyle factors such as smoking and physical activity. The main outcomes of the present study were RBC- and serum folate in relation to folate intake (exposure). Lifestyle factors such as smoking, using oral contraceptive hormones, intake of other nutrients and physical activity were considered potential predictors for folate markers.
Blood samples and processing
Blood collection took place in the morning after ≥10 h overnight fasting. Blood was collected into empty tubes and those containing K+EDTA or K+EDTA plus NaF (for plasma glucose). Serum and K+EDTA-whole blood samples were centrifuged and separated within 30 min of blood collection. For the measurement of whole blood folate, whole blood haemolysates were immediately prepared by diluting whole blood with 0.5% ascorbic acid (dilution factor 1:27) and incubation for 3 h at ambient temperature. After separation (plasma, serum) or preparation (blood haemolysates), samples were immediately frozen at −70 °C until analyses of the biomarkers. All markers were measured using aliquots that were not thawed before.
Biochemical assays
Concentrations of serum- and whole blood folate were measured by using Chemoluminescence immunoassay (IMMULITE 2000, Siemens Healthcare Diagnostics GmbH, Eschborn. Germany). The concentrations of RBC-folate (nmol/L) were calculated according to the recommendation of the Centres for Disease Control and Prevention by adjusting for haematocrit and serum folate measured in the same individual:
The concentrations of tHcy were measured in EDTA plasma by using commercially available reagents (Chromsystems Instruments & Chemicals GmbH, Gräfelfing, Germany) and a reversed phase-high-pressure liquid chromatography connected to a fluorescence detector. The between-day coefficients of variation (CV%) for the folate assay were 8.8% at 3.6 nmol/L and 5.2% at 24.9 nmol/L. The CVs% for the tHcy assay were ≤8.2% at 10.0 µmol/L and 20.6 µmol/L.
Blood count (in K+ EDTA whole blood), glucose (in NaF-plasma) and markers of liver and kidney functions (in serum) were measured. Measurements of liver markers, creatinine and blood count were conducted on the same day of blood collection using routine methods.
Folate assay specific cut-off
The lowest cut-off for optimal RBC-folate in young women (906 nmol/L) has been derived by using chloramphenicol resistant Lactobacillus rhamnosus and folic acid as calibrator (Molloy and Scott Citation1997). The corresponding cut-off value when using L. rhamnosus with 5-methylfolate as calibrator is 748 nmol/L (L. rhamnosus/folic acid = −43.5239 + 1.2697 * L. rhamnosus/5-methylfolate) (Pfeiffer et al. Citation2016). The results of RBC-folate obtained by using IMMULITE 2000 assay are slightly lower than those obtained by using a microbiological assay (L. rhamnosus/5-methyl folate) (Pfeiffer et al. Citation2016). To convert RBC-folate levels from the microbiological assay (L. rhamnosus/5-methylfolate) to IMMULITE 2000, a correction factor has been suggested (Colapinto et al. Citation2014): predicted microbiological assay (L. rhamnosus/5-methylfolate) = −22.95 + 0.81 * IMMULITE 2000. Thus, the IMMULITE 2000 adjusted cut-off that corresponds to the original 906 nmol/L (from L. rhamnosus/folic acid) is approximately 952 nmol/L [=(748 + 22.95)/0.81]. The corresponding cut-offs for deficiency in term of haematological symptoms are the following: 340 nmol/L for L. rhamnosus/folic acid; 305 nmol/L for L. rhamnosus/5-methylfolate; and 405 nmol/L for the IMMULITE 2000 assay [=(305 + 22.95)/0.81].
Similar conversion equations for serum folate between L. rhamnosus/5-methylfolate and IMMULITE 2000 assays were not published. Thus, for serum folate, we used the cut-off 7 nmol/L from the L. rhamnosus/5-methylfolate assay to define deficiency as a risk factor for haematological manifestations (megaloblastic anaemia). The present study was not primarily planned to study the prevalence of folate deficiency or insufficiency on a population level. However, we provided the estimates for folate deficiency and insufficiency to enable comparison with other similar studies.
Statistical analyses
Data analyses were performed using SAS 9.3 (SAS Inc., Cary, NC), SPSS 24.0 (SPSS, Chicago, IL) and Graph Pad Prism Version 5.04 (GraphPad Software, La Jolla, CA). The sample size estimation was based on the main outcome of the original intervention trial to detect differences in the response to two doses of vitamin D. The distributions of the continuous variables were tested by using the Shapiro–Wilk test. The majority of the variables were not normally distributed and thus a non-parametric test, Mann–Whitney test, was used to compare the concentrations of the biomarkers between the independent groups. Results are presented as median (25th–75th percentiles). The Chi-square test was used for testing the differences in categorical variables between the independent groups.
Kruskall–Wallis test was used for comparisons of the variables between more than two independent groups. When Kruskal–Wallis test was significant, two sided tests and Bonferroni correction were applied for paired comparisons to find out which groups were significantly different.
Stepwise multiple linear regression analysis was applied to study whether sociodemographic factors, lifestyle factors or nutrient intakes can predict RBC-folate concentrations.
All statistical tests were two-sided and p values < .05 were considered statistically significant and those between 0.05 and 0.10 were considered to indicate a tendency.
Results
Folate intake and biomarkers
The median concentrations of folate markers were the following: 14.7 nmol/L for serum folate, 589 nmol/L for RBC-folate and 7.3 µmol/L for plasma tHcy (). According to the classical definition of folate deficiency, serum folate < 7.0 nmol/L was observed in seven women of the 198 (3.5%), RBC-folate < 405 nmol/L (IMMULITE 2000 specific cut-off) was found in 37 women (18.7%), and lowered serum and RBC-folate were found in six women (3.0%). Fifteen women had haemoglobin level < 12.0 g/l (according to WHO criteria for non-pregnant women), two of them had also RBC-folate levels < 405 nmol/L. Only 19 women (9.6%) had RBC-folate levels ≥ 952 nmol/L (IMMULITE 2000 specific cut-off for optimal RBC-folate).
Table 1. Characteristics of the 198 participants and their folate markers.
Intake amounts of macro- and micronutrients from the 2 × 3 d dietary protocols are shown in . The median daily energy intake was 1856 kcal. The median contributions of carbohydrates, fats and proteins to total energy intake were 47%, 37% and 16%, respectively. The median daily intake of folate was 278 µg/d [(25th–75th percentiles) = 229–361] (not adjusted for caloric intake) or 154 µg/1000 kcal.
Table 2. Nutrient intakes in 198 German women of childbearing age.
Folate markers and intakes according to RBC- and serum folate
Concentrations of RBC-folate were stratified into quartiles (). The median RBC-folate in the lowest quartile was 380 nmol/L versus 901 nmol/L in the highest quartile (difference 521 nmol/L ∼ 137%). The concentrations of serum folate were higher among women with higher RBC-folate concentrations. The median serum folate concentration in the lowest RBC-folate quartile was 12.1 nmol/L versus 20.4 nmol/L in the upper RBC-folate quartile (difference 8.3 nmol/L or 69%; p = .001). The concentrations of plasma tHcy did not differ significantly according to quartiles of RBC-folate ().
Table 3. Concentrations of folate biomarkers, dietary intakes and characteristics of 198 German women according to quartiles of RBC-folate.
The intake of dietary folate (µg DFE/d) was generally low and did not differ significantly between the RBC-folate quartiles. Total energy intake, and the intakes of carbohydrates, fat and proteins did not differ significantly between the quartiles. Only the intake of fibre was low in the lowest quartile of RBC-folate (between-groups p = .012), though no dose-response relationship between fibre intake and RBC-folate was found. Higher concentrations of RBC-folate were associated with older age (p = .025), and tended to be associated with the percentage of physically active women (p = .058) (). The percentage of smokers, hormone users, women with children or education levels did not differ between RBC-folate quartiles.
We further studied folate intakes and RBC-folate according to serum folate (). The concentrations of serum folate were suggestively divided into 4 nmol/L intervals based on conventional reference intervals (7–45 nmol/L). The median serum folate in the highest range of serum folate (> 23 nmol/L) was 32.3 nmol/L versus 5.9 nmol/L in the lowest range (< 7.0 nmol/L). However, folate intakes did not differ between serum folate intervals. In contrast, the concentrations of RBC-folate were higher at higher serum folate (). The median RBC-folate that corresponded to serum folate > 23.0 nmol/L (i.e. covers the upper reference range) was 856 nmol/L, but only 26.5% of the women in this group achieved RBC-folate concentrations ≥952 nmol/L ().
Table 4. Folate intake and concentrations of RBC-folate and serum folate according to serum-folate in 198 young German women not receiving any folate supplements.
Determinants of folate markers
shows concentrations of serum- and RBC-folate and tHcy according to categories of several potential determinants. Lower serum concentrations of folate were associated with low folate intake (<280 µg/d), low fibre intakes (<21 g/d), being smoker, and using hormone contraceptives as compared with the corresponding opposite categories.
Table 5. Concentrations of folate markers in German young women according to lifestyle, demographic or dietary determinants.
Analogous to serum folate, consuming fibre <21.0 g/d was associated with lower concentrations of RBC-folate, while women reported being physically inactive had lower RBC-folate. A tendency towards lower RBC-folate concentrations was found in women using hormonal contraceptives (p = .056) and in those without children (p = .081) as compared with the corresponding opposites categories.
The correlations between folate intake and markers (serum and RBC-folate and plasma tHcy) are shown in Table S1. There were weak associations between folate intake and serum folate (r = 0.145, p = .041) and RBC-folate (r = 0.126, p = .077). RBC-folate and serum folate showed a strong positive correlation (r = 0.589, p < .001), while tHcy showed significant but weak correlations with serum (r = −0.193, p = .006) and RBC-folate (−0.163, p = .021).
When all factors are considered in a stepwise multiple linear regression analysis, predictors of RBC-folate concentrations were age and fibre intake as positive determinants and carbohydrate intake as a negative determinant of RBC-folate ().
Table 6. Stepwise multiple linear regression analysis to predict dietary and lifestyle factors with significant influence on RBC-folate concentrations in 198 German women not receiving any supplement.
Discussion
The present study has shown that in a population not exposed to mandatory folic acid fortification, 90% of women of childbearing age who were not receiving additional sources of folate did not achieve adequate RBC-folate concentrations to prevent neural tube defects. Lowered RBC-folate levels in the range associated with haematological symptoms was detected in 18.7% of the women. Factors that were significantly associated with higher RBC-folate concentrations were higher age and healthy lifestyle factors such as higher intake of fibre, and being physically active. Serum concentrations of folate showed direct associations with intakes of folate and fibre, but negative associations with smoking, and using hormonal contraceptives.
The intake of folate in the present study (median 278 µg/d) is comparable with earlier estimates in this population (Flynn et al. Citation2009) or estimates from other European studies (Rasmussen et al. Citation2000), but higher than that reported in women between 19 and 51 years participating in the German National Survey (180 µg/d) (DGE Citation2013), which could be due to using different dietary protocols and intake tables or to the high proportion of educated women in the study population. Inaccuracies in estimating folate intake (Park et al. Citation2013) may also play a role. We observed diverse associations between RBC-folate on the one hand and carbohydrates and fibre intakes on the other hand. This could be due to dietary patterns or to sources of food folate (i.e. whole grain products), absorption or bioavailability. Bread and vegetables are main contributors to daily folate intake (31.2% and 37.7%, respectively) in German women (DGE Citation2012) which are also the main sources of fibre and could explain the association of RBC-folate with fibre. A carbohydrate-rich diet could be associated with less folate rich foods. The negative association between RBC-folate and carbohydrate intake in our study could reflect that bad sources of carbohydrate were consumed which are expected to be a poor source of folate.
The relationship between folate intake and status biomarkers
We observed no dose–response relationship between RBC-folate or serum folate and folate intake. However, there was some evidence of a threshold effect (<280 µg/d versus ≥280 µg/d) where serum folate was 2.1 nmol/L higher (p = .029) and RBC-folate was 73 nmol/L higher (p = .113) in the upper intake range compared with the lower intake range (). The relationship between folate intake and biomarkers has been intensively studied under controlled dietary intake (O'Keefe et al. Citation1995), depletion (Kauwell et al. Citation2000), in observational studies without any intervention (Hoey et al. Citation2007; Dominguez-Salas et al. Citation2013; Ohrvik et al. Citation2018) or in meta-analyses (Berti et al. Citation2012; Duffy et al. Citation2014; Marchetta et al. Citation2015). The association between folate intake and biomarkers showed mixed evidence (Park et al. Citation2013; Ohrvik et al. Citation2018). Polymorphisms in folate metabolising enzymes (Ashfield-Watt et al. Citation2002; Crider et al. Citation2011), folate absorption or food sources, or consuming fortified foods can affect the association between food folate and folate biomarkers.
In a controlled intake study, up to 300 µg/d total folate intake were unable to prevent depletion of serum and RBC-folate over time in young women (O'Keefe et al. Citation1995). A positive balance was achieved only when total folate intake was increased to ≥400 µg/d (O'Keefe et al. Citation1995). Blood or serum folate show a dose–response relationship with folic acid intakes in the range between 50 µg/d and <400 µg/d (on the top of dietary folate) (Duffy et al. Citation2014). The doubling of folic acid intake in this range was associated with 63% higher serum folate and 37% higher RBC-folate (Duffy et al. Citation2014). No dose–response association with folate markers was observed above this range (Duffy et al. Citation2014). The association of folate markers and folate intake from diet plus supplements or fortified foods has been studied in pregnant, lactating and non-pregnant women (Berti et al. Citation2012). Berti et al. reported that doubling of total folate intake (diet plus supplementary or from fortification) was associated with 47% higher serum/plasma folate, 23% higher RBC-folate and 7% lower tHcy (Berti et al. Citation2012). Berti et al. assumed a mean dietary folate intake of 247 μg/d when dietary folate was not measured in the original studies; the authors assumed also a linear relationship on the ln–ln-scale between intake and marker levels. However, the response of RBC-folate to folate intake could be non-linear over the whole intake range (Marchetta et al. Citation2015), suggesting that the absence of association between intake and RBC-folate at a relatively low folate intake in our study is expected.
Low folate, disease prevention and impact on nutrition policy
It is of great concern that 90% of the women in the present study have insufficient folate status to provide optimal prevention of neural tube defects should the women become pregnant and if they did not take supplements well in advance. A recent publication argued that approximately 86% of the German population have adequate folate status defined as serum folate > 10 nmol/L (4.4 ng/ml) (Mensink et al. Citation2016). The same report showed that approximately 3% of women of reproductive age had serum folate < 6.8 nmol/L (3 ng/ml) while low socioeconomic status was associated with lower folate (Mensink et al. Citation2016). From a public health perspective, our results are alarming especially with regard to how folate deficiency and folate insufficiency should be defined on a population level. Folate intake in Germany could be sufficient to prevent anaemia in the majority of individuals, but is obviously not sufficient to prevent serious health outcomes occurring every year and causing deaths or long-term morbidities to approximately 800–1000 births per year in this country.
The limitations of the current study deserve mentioning. First, we may have underestimated folate intake from voluntary fortification. However, the intake after 8 weeks (when participants were asked not to consume fortified products) was slightly lower than the baseline intake (approximately 30 µg/d). This difference could represent the intake from fortified foods. In addition, the concentrations we reported are very similar to those from Irish women not consuming any voluntary fortified products (Hoey et al. Citation2007). Second, the participants were mostly educated and diseases that may affect folate absorption were excluded. Thus, folate status is expected to be even lower in a population-based study in women of childbearing age than in the present study. Finally, folate assays show analytical deviations. Because the immunological assay provides lower RBC-folate than the original microbiological assay, we used adjusted cut-off values for optimal RBC-folate (Pfeiffer et al. Citation2016). An assay-specific cut-off of 952 nmol/was estimated to be equivalent to the original 906 nmol/L. The present study could be limited by using an immunological folate assay instead of the reference method.
In summary, we observed folate deficiency defined as lowered RBC-folate in 18.7% of the women, lowered serum folate in 3.5% and lowered both markers in 3%. Only 9.6% of the women achieved concentrations of RBC-folate > 952 nmol/L. Low serum folate was partly explained by low intake of folate and fibre, smoking and using contraceptive hormones, while low RBC-folate was explained by low intake of fibre, low physical activity, contraceptive usage and parity.
Conclusion
Dietary folate intake was not sufficient to achieve optimal folate status for prevention of NTD in the majority of German women who are not exposed to mandatory folate fortification and not taking supplemental folate. Women’s serum or RBC-folate levels were partly determined not only by dietary folate intake but also by lifestyle and intakes of macronutrients. The results reflect the urgent need for a population wide strategy to improve folate status in women to prevent folate-responsive NTDs in this country.
Figure S1 and Table S1
Download PDF (242.9 KB)Disclosure statement
No potential conflict of interest was reported by the authors.
Related Research Data
References
- Ashfield-Watt PA, Pullin CH, Whiting JM, Clark ZE, Moat SJ, Newcombe RG, Burr ML, Lewis MJ, Powers HJ, McDowell IF. 2002. Methylenetetrahydrofolate reductase 677C->T genotype modulates homocysteine responses to a folate-rich diet or a low-dose folic acid supplement: a randomized controlled trial. Am J Clin Nutr. 76:180–186.
- Bailey LB, Stover PJ, McNulty H, Fenech MF, Gregory JF III, Mills JL, Pfeiffer CM, Fazili Z, Zhang M, Ueland PM, et al. 2015. Biomarkers of nutrition for development-folate review. J Nutr. 145:1636S–1680S.
- Bakker DJ, de Jong-van den Berg LT, Fokkema MR. 2009. Controlled study on folate status following folic acid supplementation and discontinuation in women of child-bearing age. Ann Clin Biochem. 46:231–234.
- Berti C, Fekete K, Dullemeijer C, Trovato M, Souverein OW, Cavelaars A, Dhonukshe-Rutten R, Massari M, Decsi T, Van't Veer P, Cetin I. 2012. Folate intake and markers of folate status in women of reproductive age, pregnant and lactating women: a meta-analysis. J Nutr Metab. 2012:470656.
- Bestwick JP, Huttly WJ, Morris JK, Wald NJ. 2014. Prevention of neural tube defects: a cross-sectional study of the uptake of folic acid supplementation in nearly half a million women. PLoS one. 9:e89354.
- Brough L, Rees GA, Crawford MA, Dorman EK. 2009. Social and ethnic differences in folic acid use preconception and during early pregnancy in the UK: effect on maternal folate status. J Hum Nutr Diet. 22:100–107.
- Colapinto CK, Tremblay MS, Aufreiter S, Bushnik T, Pfeiffer CM, O'Connor DL. 2014. The direction of the difference between Canadian and American erythrocyte folate concentrations is dependent on the assay method employed: a comparison of the Canadian Health Measures Survey and National Health and Nutrition Examination Survey. Br J Nutr. 112:1873–1881.
- Crider KS, Devine O, Hao L, Dowling NF, Li S, Molloy AM, Li Z, Zhu J, Berry RJ. 2014. Population red blood cell folate concentrations for prevention of neural tube defects: Bayesian model. BMJ. 349:g4554.
- Crider KS, Zhu JH, Hao L, Yang QH, Yang TP, Gindler J, Maneval DR, Quinlivan EP, Li Z, Bailey LB, et al. 2011. MTHFR 677C->T genotype is associated with folate and homocysteine concentrations in a large, population-based, double-blind trial of folic acid supplementation. Am J Clin Nutr. 93:1365–1372.
- Daly LE, Kirke PN, Molloy A, Weir DG, Scott JM. 1995. Folate levels and neural tube defects. Implications for prevention. JAMA. 274:1698–1702.
- de Weerd S, Thomas CM, Cikot RJ, Steegers-Theunissen RP, de Boo TM, Steegers EA. 2002. Preconception counseling improves folate status of women planning pregnancy. Obstet Gynecol. 99:45–50.
- DGE (Deutsche Gesellschaft für Ernährung). 2012. Ernährungsbericht. 12: p. 40–85.
- DGE (Deutsche Gesellschaft für Ernährung). 2013. Referenzwerte für die Nährstoffzufuhr Folat; in Referenzwerte für die Nährstoffzufuhr [Bonn: D-A-CH (Deutsche Geselschaft für Ernährung, Österreichische Geselschaft für ernährung, Schweizerische Vereinigung für Ernährung)]; p. 127–152.
- Dominguez-Salas P, Moore SE, Cole D, da Costa KA, Cox SE, Dyer RA, Fulford AJ, Innis SM, Waterland RA, Zeisel SH, et al. 2013. DNA methylation potential: dietary intake and blood concentrations of one-carbon metabolites and cofactors in rural African women. Am J Clin Nutr. 97:1217–1227.
- Duffy ME, Hoey L, Hughes CF, Strain JJ, Rankin A, Souverein OW, Dullemeijer C, Collings R, Hooper L, McNulty H. 2014. Biomarker responses to folic acid intervention in healthy adults: a meta-analysis of randomized controlled trials. Am J Clin Nutr. 99:96–106.
- Flynn A, Hirvonen T, Mensink GB, Ocke MC, Serra-Majem L, Stos K, Szponar L, Tetens I, Turrini A, Fletcher R, Wildemann T. 2009. Intake of selected nutrients from foods, from fortification and from supplements in various European countries. Food Nutr Res. 53. DOI:10.3402/fnr.v53i0.2038.
- Hoey L, McNulty H, Askin N, Dunne A, Ward M, Pentieva K, Strain J, Molloy AM, Flynn CA, Scott JM. 2007. Effect of a voluntary food fortification policy on folate, related B vitamin status, and homocysteine in healthy adults. Am J Clin Nutr. 86:1405–1413.
- Hopkins SM, Gibney MJ, Nugent AP, McNulty H, Molloy AM, Scott JM, Flynn A, Strain JJ, Ward M, Walton J, et al. 2015. Impact of voluntary fortification and supplement use on dietary intakes and biomarker status of folate and vitamin B-12 in Irish adults. Am J Clin Nutr. 101:1163–1172.
- Kauwell GP, Lippert BL, Wilsky CE, Herrlinger-Garcia K, Hutson AD, Theriaque DW, Rampersaud GC, Hutson AD, Theriaque DW, Rampersaud GC, Cerda JJ, Bailey LB. 2000. Folate status of elderly women following moderate folate depletion responds only to a higher folate intake. J Nutr. 130:1584–1590.
- Krawinkel MB, Strohm D, Weissenborn A, Watzl B, Eichholzer M, Barlocher K, Elmadfa I, Leschik-Bonnet E, Heseker H. 2014. Revised D-A-CH intake recommendations for folate: how much is needed? Eur J Clin Nutr. 68:719–723.
- Marchetta CM, Devine OJ, Crider KS, Tsang BL, Cordero AM, Qi YP, Guo J, Berry RJ, Rosenthal J, Mulinare J, et al. 2015. Assessing the association between natural food folate intake and blood folate concentrations: a systematic review and Bayesian meta-analysis of trials and observational studies. Nutrients. 7:2663–2686.
- Mensink GB, Weissenborn A, Richter A. 2016. Folatversorgung in Deutschland. Journal of Health Monitoring. 1(2) DOI:10.17886/RKI-GBE-2016-034.2.
- Molloy AM, Scott JM. 1997. Microbiological assay for serum, plasma, and red cell folate using cryopreserved, microtiter plate method. Meth Enzymol. 281:43–53.
- O'Keefe CA, Bailey LB, Thomas EA, Hofler SA, Davis BA, Cerda JJ, Gregory JF III. 1995. Controlled dietary folate affects folate status in nonpregnant women. J Nutr. 125:2717–2725.
- Obeid R, Pietrzik K, Oakley GP Jr, Kancherla V, Holzgreve W, Wieser S. 2015. Preventable spina bifida and anencephaly in Europe. Birth Defects Res Part A Clin Mol Teratol. 103:763–771.
- Ohrvik V, Lemming EW, Nalsen C, Becker W, Ridefelt P, Lindroos AK. 2018. Dietary intake and biomarker status of folate in Swedish adults. Eur J Nutr. 57:451–462.
- Park JY, Vollset SE, Melse-Boonstra A, Chajes V, Ueland PM, Slimani N. 2013. Dietary intake and biological measurement of folate: a qualitative review of validation studies. Mol Nutr Food Res. 57:562–581.
- Pfeiffer CM, Sternberg MR, Hamner HC, Crider KS, Lacher DA, Rogers LM, Bailey RL, Yetley EA. 2016. Applying inappropriate cutoffs leads to misinterpretation of folate status in the US population. Am J Clin Nutr. 104:1607–1615.
- Pilz S, Hahn A, Schon C, Wilhelm M, Obeid R. 2017. Effect of two different multimicronutrient supplements on vitamin D status in women of childbearing age: a randomized trial. Nutrients. 9. doi: 10.3390/nu9010030.
- Rasmussen LB, Ovesen L, Bulow I, Knudsen N, Laurberg P, Perrild H. 2000. Folate intake, lifestyle factors, and homocysteine concentrations in younger and older women. Am J Clin Nutr. 72:1156–1163.
- Sauberlich HE, Kretsch MJ, Skala JH, Johnson HL, Taylor PC. 1987. Folate requirement and metabolism in nonpregnant women. Am J Clin Nutr. 46:1016–1028.
- Shere M, Kapur BM, Koren G. 2016. Folate status of women in Toronto: implications of folate fortification and supplementation. Can J Public Health. 106:e509–e513.
- Shi Y, De GM, MacFarlane AJ. 2014. Socio-demographic and lifestyle factors associated with folate status among non-supplement-consuming Canadian women of childbearing age. Can J Public Health. 105:166–e171.
- Smulders YM, Smith DE, Kok RM, Teerlink T, Gellekink H, Vaes WH, Stehouwer CD, Jakobs C. 2007. Red blood cell folate vitamer distribution in healthy subjects is determined by the methylenetetrahydrofolate reductase C677T polymorphism and by the total folate status. J Nutr Biochem. 18:693–699.
- Standing Committee on the Scientific Evaluation of Dietary Reference Intakes and its Panel on Folate. 1998. Chapter 8 Folate; in Dietary Reference Intakes for Thiamin, Riboflavin, Niacin, Vitamin B6, Folate, Vitamin B12, Pantothenic Acid, Biotin, and Choline Institute of Medicine (US). Washington (DC): National Academies Press (US). p. 196–305.
- van Gool JD, Hirche H, Lax H, De SL. 2018. Folic acid and primary prevention of neural tube defects: a review. Reprod Toxicol. DOI:10.1016/j.reprotox.2018.05.004.
- Vandevijvere S, Amsalkhir S, Van OH, Moreno-Reyes R. 2012. Determinants of folate status in pregnant women: results from a national cross-sectional survey in Belgium. Eur J Clin Nutr. 66:1172–1177.
- World Health Organization. 2015. Guidelines: optimal serum and red blood cell folate concentrations in women of reproductive age for prevention of neural tube defects. ISBN: 978 92 4 154904 2.