
Abstract
Although the effect of isolated nutrients on plasma parathyroid hormone (PTH) is somewhat familiar, the effect of multiple nutrients on plasma PTH level has not yet been studied. The aim of this study was to identify groups of food items that are associated with the plasma PTH level in healthy individuals.
This cross-sectional study enrolled 1180 healthy individuals from Croatia with plasma PTH levels inside the referent values. A food frequency questionnaire containing 58 food items was completed to evaluate the dietary intake. We used principal component analysis to reduce food items into dietary groups, followed by linear regression analysis to test the association between dietary groups and the level of PTH.
The results indicate that different sorts of vegetables (p = .006), sausages, salami, mushrooms, eggs (p = .033), as well as white bread (p = .009) are associated with the increase, while bran bread (p = .009) is associated with the decreased plasma PTH level.
Introduction
Parathyroid hormone (PTH) is a polypeptide hormone secreted from four small parathyroid glands located in the backside of the thyroid gland (Lofrese and Lappin Citation2018). PTH is secreted in response to small changes of blood ionised calcium in order of maintenance calcium homeostasis. Serum calcium inversely affects PTH secretion. If the level of serum calcium is low, PTH promotes bone resorption and releases calcium from the bones. In case of high serum calcium levels, calcium binds to the receptors on parathyroid glands and inhibits the production and release of PTH (Mihai and Farndon Citation2000).
Although the major physiological regulator of PTH secretion is serum calcium, serum phosphate and vitamin D also modulates its secretion. Elevated levels of serum phosphate stimulate PTH secretion, presumably by lowering extracellular calcium level (Lederer Citation2014). The principal function of vitamin D in the maintenance of calcium and phosphate homeostasis is the increase of calcium absorption from the intestine (Christakos Citation2012). PTH stimulates calcium reabsorption in kidneys through the synthesis of active vitamin D metabolite 1,25(OH)2D3, which enhances intestinal calcium absorption, reduces urinary calcium and increases phosphate excretion (Nissenson and Jüppner Citation2013).
Pathological conditions linked to the altered level of serum PTH are hyperparathyroidism and hypoparathyroidism. Hyperparathyroidism is characterised by increased activity of the parathyroid glands. The causes of hyperparathyroidism are diverse; it can occur due to intrinsic abnormal changes which affects excretion of PTH or due to extrinsic abnormal change altering calcium homoeostasis and subsequently stimulating the production of PTH (Fraser Citation2009). Hypoparathyroidism occurs in rare cases when the secretion of PTH is low or absent, which results in low-serum calcium and increased serum phosphorus (Abate and Clarke Citation2016).
Serum PTH level is dependent on different environmental (diet and physical activity) as well as genetic factors (Hunter et al. Citation2001; Bouassida et al. Citation2006; Paik, Farwell et al. Citation2012b). If alterations of serum PTH levels have a pathological background, patients should be medically treated. However, if altered PTH levels are due to nutrition deficiencies, consumption of calcium and vitamin D supplements, accompanied by exercise and weight loss could help to decrease PTH levels and reduce the risk of developing hyperparathyroidism (Sai et al. Citation2011; Paik, Curhanet al. Citation2012a; Cheng et al. Citation2014; Vaidya et al. Citation2016).
The effect of nutrients on PTH level has been moderately studied. Higher concentration of serum PTH have been observed in vegans and adult females with plant food-based adopted diet (Merrill and Aldana Citation2009; Hansen et al. Citation2018), however, lower PTH concentrations were observed in early pubertal children frequently consuming vegetables (Tylavsky et al. Citation2004). Low-protein diet has been associated with increment as well as in decrement of PTH level (Giannini et al. Citation1999; Kerstetter et al. Citation2000). Chronic alcoholism leads to lower bone mineral density (BMD) and higher fracture risk due to various factors, including abnormal vitamin D and parathyroid function (Felson et al. Citation1995; Ilich and Kerstetter Citation2000). Phytochemicals decrease PTH level in rats, if taken as a supplement (Zhu et al. Citation2012).
We determined the effect of multiple nutrients (dietary factors) on plasma parathyroid hormone level. The goal of this study was to identify groups of food items that are associated with the plasma PTH level in healthy individuals.
Materials and methods
This cross-sectional study was performed on samples obtained through the “10,001 Dalmatians” project (Rudan et al. Citation2009). Initially, 2820 adult individuals originating from the Dalmatian region of South Croatia, i.e. from the city of Split (N = 1.003) and the islands of Korcula (N = 923) and Vis (N = 894) were included in the study. We excluded individuals who underwent parathyroid surgery, who had plasma PTH levels falling outside of the normal reference range, who were taking vitamin D and/or calcium supplementation or other medications that could affect PTH levels (including bisphosphonates, drugs for bone diseases, selective oestrogenic receptor modulators, oestrogen, oral and inhaled corticosteroids and diuretics), as well as individuals with missing data on PTH level or dietary intake data. After these exclusions, a total of 1180 individuals were available for the analysis. A written informed consent was obtained from all participants before entering the study and the study protocol was approved by the Ethical board of the University of Split, School of Medicine (No: 2181-198-03-04-14-0031).
Plasma PTH levels were determined by radio-immunoassay method (RIA) in the Laboratory of Biochemistry, Department of Nuclear Medicine, University Hospital Split. RIA ran on the Scintillation counter liquid samples, Capintec, and 125I served as a marker. The concentrations of PTH in the plasma were determined using commercial kits (DIAsourcehPTH -120 min-IRMA Kit, DIAsourceImmunoAssays S.A, Belgium). The reference range of plasma PTH levels is 12.26 – 35.50 pg/ml.
At the recruitment, participants completed a food-frequency questionnaire (FFQ) that contained questions on the frequency of consumption of 54 foods and beverages. Each question had five possible answers regarding the usual frequency of consumption (every day, 2–3 times a week, once a week, occasionally, and never). An additional section contained four questions on the frequency of fat consumption with three possible answers (always, sometimes, never). For the analysis, an equivalent weekly intake for those categorical responses was calculated as follows: every day (assigned as 7 times a week), 2–3 times a week (2.5), once a week (1), occasionally (0.5 – once in two weeks), and never (0), while the responses on the frequency of fat consumption were converted as follows: always (7), sometimes (2.5), and never (0).
We have tested the association between PTH and several potential confounders, including age, sex, body mass index (BMI), physical activity, creatinine level, uric acid level, calcium level, bone mineral density (BMD) and BMD score. Level of physical activity was assessed by using the question that asked participants if they are engaged in any sport activity with three possible answers: no, sometimes and yes. Creatinine level was measured using creatininase based fotometry, uric acid level using uricase UV fotometry, and calcium levels using o-cresolphtalein fotometry. Bone mineral density was measured at the heel. All these data were available from the “10 001 Dalmatians” project resources.
The data are presented as the frequencies (percentages) for categorical variables and as mean ± standard deviation (SD) for continuous variables in . Pearson’s correlation coefficient was calculated for numerical variables, while t-test and ANOVA were used to asses association between groups in PTH level. We applied Principal Component Analysis (PCA) to data from the FFQ to reduce the list of 58 food items to key dietary groups (factors) (for details see (Matana et al. Citation2017)). Food items with absolute factor loadings >0.30 were considered as contributing to a factor.
Table 1. Characteristics of study participants.
Finally, to examine dietary factors associated with plasma PTH level, we perform multiple linear regression analysis where dietary groups were independent variables and PTH level was a dependent variable. The linear regression model was controlled for: sex, age, body mass index (BMI), and serum calcium levels. p Values <.05 were considered to be statistically significant. Statistical analyses were performed using Statistical Package Software for Social Science, version 16 (SPSS Inc, Chicago, IL, USA).
Results
A total of 1180 individuals were enrolled in this study. The general characteristics of the study population are shown in . Women had higher PTH levels than men and increasing PTH was significantly correlated with increasing age and body mass index (). Physical activity was not significantly associated with PTH (). The correlation of PTH and serum calcium was significant but weak (r = 0.134, p < .001), while correlations of PTH and creatinine level, uric acid level, bone mineral density (BMD), and BMD T score were not significant ().
Appropriateness of the data for factor analysis was supported by the Kaiser–Meyer–Olkin measure of sampling adequacy (0.76) and Bartlett’s test of sphericity (p < .001).
Eighteen dietary factors accounting for 53.85% of the total variance in food intake were extracted by factor analysis. The identified factors and their corresponding loading values are presented in . The factors were generally in accordance with conventional dietary groups.
Table 2. The factor loadings of foods for the 18 dietary groups (factors) identified using principal component analysis.
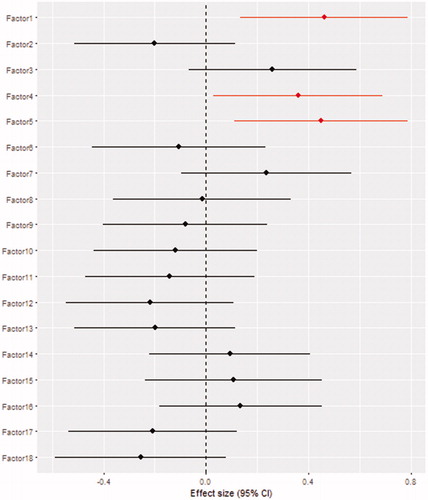
Linear regression analysis revealed that the dietary group with high loadings for root vegetables, leafy vegetables, fruity vegetables, flower vegetables, and canned and pickled vegetables was positively associated with the plasma PTH level (β = 0.46, SE =0.17, p = .006), as well as the dietary group with high loadings for sausages, salami, mushrooms and eggs (β = 0.36, SE =0.17, p = .033). The dietary group with high-negative loading for bran bread and positive loading for white bread was also positively associated with the plasma PTH level (β = 0.45, SE =0.17, p = .009). Other dietary groups did not show statistically significant association with plasma PTH level. Results from the logistic regression analysis are shown in .
Figure 1. Effect sizes and 95% confidence intervals obtained from the linear regression analysis for the association of dietary groups (factors) with plasma PTH level. Statistically significant dietary factors are the lines that do not intersect with the vertical line.
Discussion
This study revealed that three dietary groups (factors) are positively associated with the plasma PTH levels in 1180 healthy individuals. Frequent consumption of dietary factor 1 (root vegetables, leafy vegetables, fruity vegetables, flower vegetables, and canned and pickled vegetables) was positively associated with the plasma PTH level, as well as frequent consumption of dietary factor 4 (sausages, salami, mushrooms, and eggs). Frequent consumptions of white bread (factor 5) was positively associated with the plasma PTH level while frequent consumption of bran bread (factor 5) showed negative association with PTH level.
Various vegetables (factor 1) are associated with increased levels of PTH. Vegetables are dietary items generally high in calcium with moderate phosphorus levels (US FAD Administration Citation2017; Briggs and Wahlqvist Citation2010a; Henderson et al. Citation2002). Although vegetables are high in calcium, the bioavailability of calcium derived from plants is much lower due to fibres, phytates and oxalates, co-factors naturally present in plants (Buzinaro et al. Citation2006). Also, the plants are often treated with pesticides and the result of that exposure effect the increase of blood phosphorus and a decrease in total blood protein level, which could result in elevated PTH levels (Hu et al. Citation2015). The results of our study are in accordance with the study performed on adult females that adopted plant food-based diet, resulting in increased PTH levels (Merrill and Aldana Citation2009). Higher serum PTH levels was also detected in a study questioning to which extent a vegan diet has a negative impact on bone health (Hansen et al. Citation2018). A study by Tylavsky et al. showed a beneficial effect of vegetables on BMI accompanied by lower PTH levels in early pubertal children (Tylavsky et al. Citation2004), which is not necessarily in discordance with previous findings since PTH concentrations may not be driven by the same mechanism in adolescents as in adults (Cadogan et al. Citation1998). Children have a growing skeleton with the increased buffering bone capacity, thus having a different dietary effect on bone tissue density and calcium release than adults (Tylavsky et al. Citation2004).
Frequent consumption of sausages, salami, mushrooms and eggs (factor 4) is also positively associated with the plasma PTH level. Sausages, salami and eggs are rich in phosphorous (Briggs and Wahlqvist Citation2010b; Henderson et al. Citation2002) that can influence the increment of PTH levels through dietary intake. Additives (nitrate and nitrite) are usually added to sausages and salami for its antimicrobial properties, as well as its desirable effects on colour, flavour and texture (SCF 1995). Frequent consummation of nitrites can induce kidney injury and result in secondary hyperparathyroidism, as it was recently reported (Peng et al. Citation2018). Likewise, mushrooms contain plenty of phosphorus but are also rich in ergosterol, a precursor of vitamin D2 that is metabolised identically as cholecalciferol (vitamin D3) (Bernas and Jaworska Citation2017). However, the conversion of ergosterol into the cholecalciferol is poor (Armas et al. Citation2004; Chun et al. Citation2016), hence the calcium absorption in intestine and resorption in kidneys is likely to be reduced (Nissenson and Jüppner Citation2013). The joint effect of all factors could influence on the increment of PTH levels.
Positive association with the plasma PTH level was obtained for white bread (factor 5), while frequent consumption of bran bread (factor 5) was negatively associated with PTH plasma levels. Due to differences in composition (Bjorck and Elmstahl Citation2003; Fardet Citation2010), white and bran bread differently affect body weight and abdomen fat. Reducing white bread is associated with lower gains in weight and abdominal fat, while there were no differences for bran bread (Serra-Majem and Bautista-Castano Citation2015). Since serum PTH is positively associated with BMI (Kamycheva et al. Citation2004; Kovesdy et al. Citation2007; Drechsler et al. Citation2011), frequent consumption of white bread could be logical explanation for positive association with PTH plasma levels, while frequent consumption of bran bread, which is rich with numerous bioactive compounds and does not affect BMI changes, is negatively associated with PTH plasma levels.
Nutrition and lifestyle modulate the pattern of PTH secretion. The secretion of PTH occurs in circadian rhythm, with a small increase in the late afternoon and a larger broader increase in late evening into early morning (Fraser et al. Citation2004). In fasting condition nocturnal rise in PTH concentration abolishes (Fraser et al. Citation1994). Animal studies showed that modifying food intake can reduce bone resorption (Li and Muhlbauer Citation1999).
Bone quality, characterised as bone composition, is influenced by microarchitecture and microdamage and does not have to be ultimately related with BMD (Sukumar et al. Citation2011). The mechanical bone strength and composition is subjected to change due to the lacunar canaliculy system modification. A network of channels that represent the lacunar canaliculy system is influenced by osteocytes embedded in bones and variations are measured at micron scale (Gardinier et al. Citation2018). Long-term manipulation of PTH secretion alters bone cell function, resorption and remodelling (Schlemmer and Hassager Citation1999; Fraser et al. Citation2004; Joseph et al. Citation2007). It is possible that variations of PTH within the normal range affect bone composition.
Individuals with higher PTH values should not base their diet on vegetables, mushrooms and eggs, and should reduce the intake of dietary items that contains nitrite/nitrate additives and items that increases BMI. Their diet should be based on dietary items that enable the maintenance of BMI and thus the PTH level, such as brain bread.
This is the first cross-sectional study preformed on comprehensive nutrients intake for the level of PTH in healthy individuals and the result are in accordance with previously published studies, with the new insights regarding the contribution of sausages, salami, mushrooms, eggs, bran and white bread. The identified food factors had mild effect on PTH level; but still they explained some of the variability in the PTH levels. There are some limitations in the present study. The study is cross-sectional and associations could only be inferred. Food frequency questionnaire was self-reported and qualitative assessment of food intake was collected only, however, they still provide relevant dietary information. Sociodemographic variables were controlled, but other unmeasured confounding factors could still be present, such as vitamin D and phosphorus level.
Conclusion
This is the first study that undertook comprehensive evaluation of food intake and observed the effect of dietary factors on plasma PTH levels. In summary, we demonstrated the association of root vegetables, leafy vegetables, fruity vegetables, flower vegetables, and canned and pickled vegetables, sausages, salami, mushrooms, eggs and white bread with the increase in plasma PTH level, while bran bread was associated with the decreased plasma PTH level. We discussed the possible explanation for such findings; the increase in PTH levels could be due to low calcium plant-based absorption, additives in salami and sausages, the presence of ergosterol in mushrooms and higher BMI due to frequent consumption of white bread, in difference to bran bread, which is rich with numerous bioactive compounds, does not affect BMI and is associated with decrease in PTH levels. Variations of plasma PTH within the normal range can probably affect bone strength and composition.
Acknowledgements
We would like to thank all participants of this study and acknowledge invaluable support of the local teams in Zagreb and Split, especially that of the Institute for Anthropological Research, Zagreb, Croatia.
Disclosure statement
The authors declare no conflict of interest.
Additional information
Funding
References
- Abate EG, Clarke BL. 2016. Review of hypoparathyroidism. Front Endocrinol (Lausanne). 7:172
- Armas LA, Hollis BW, Heaney RP. 2004. Vitamin D2 is much less effective than vitamin D3 in humans. J Clin Endocrinol Metab. 89:5387–5391.
- Bernas E, Jaworska G. 2017. Culinary-medicinal mushroom products as a potential source of vitamin D. Int J Med Mushrooms. 19:925–935.
- Bjorck I, Elmstahl HL. 2003. The glycaemic index: importance of dietary fibre and other food properties. Proc Nutr Soc 62:201–206.
- Bouassida A, Latiri I, Bouassida S, Zalleg D, Zaouali M, Feki Y, Gharbi N, et al. 2006. Parathyroid hormone and physical exercise: a brief review. J Sports Sci Med. 5:367–374.
- Briggs D, Wahlqvist M. 2010a. Calcium. [accessed 2018 Mar 21]. http://apjcn.nhri.org.tw/server/info/books-phds/books/foodfacts/html/data/data5c.html.
- Briggs D, Wahlqvist M. 2010b. Phosphorus. [accessed 2018 Mar 21]. http://apjcn.nhri.org.tw/server/info/books-phds/books/foodfacts/html/data/data5f.html.
- Buzinaro EF, Almeida RN, Mazeto GM. 2006. Bioavailability of dietary calcium. Arq Bras Endocrinol Metabol. 50:852–861.
- Cadogan J, Blumsohn A, Barker ME, Eastell R. 1998. A longitudinal study of bone gain in pubertal girls: anthropometric and biochemical correlates. J Bone Miner Res. 13:1602–1612.
- Cheng SP, Liu CL, Liu TP, Hsu YC, Lee JJ. 2014. Association between parathyroid hormone levels and inflammatory markers among US adults. Mediators Inflamm. 2014:709024.
- Christakos S. 2012. Recent advances in our understanding of 1,25-dihydroxyvitamin D(3) regulation of intestinal calcium absorption. Arch Biochem Biophys. 523:73–76.
- Chun RF, Hernandez I, Pereira R, Swinkles L, Huijs T, Zhou R, Liu NQ, Shieh A, Guemes M, Mallya SM, et al. 2016. Differential responses to vitamin D2 and vitamin D3 are associated with variations in free 25-hydroxyvitamin D. Endocrinology 157:3420–3430.
- Drechsler C, Grootendorst DC, Boeschoten EW, Krediet RT, Wanner C, Dekker FW. 2011. Changes in parathyroid hormone, body mass index and the association with mortality in dialysis patients. Nephrol Dial Transplant. 26:1340–1346.
- Fardet A. 2010. New hypotheses for the health-protective mechanisms of whole-grain cereals: what is beyond fibre? Nutr Res Rev. 23:65–134.
- Felson DT, Zhang Y, Hannan MT, Kannel WB, Kiel DP. 1995. Alcohol intake and bone mineral density in elderly men and women. The Framingham Study. Am J Epidemiol. 142:485–492.
- Fraser WD. 2009. Hyperparathyroidism. Lancet. 374:145–158.
- Fraser WD, Ahmad AM, Vora JP. 2004. The physiology of the circadian rhythm of parathyroid hormone and its potential as a treatment for osteoporosis. Curr Opin Nephrol Hypertens. 13:437–444.
- Fraser WD, Logue FC, Christie JP, Cameron DA, O'Reilly DS, Beastall GH. 1994. Alteration of the circadian rhythm of intact parathyroid hormone following a 96-hour fast. Clin Endocrinol (Oxf). 40:523–528.
- Gardinier JD, Al-Omaishi S, Rostami N, Morris MD, Kohn DH. 2018. Examining the influence of PTH(1-34) on tissue strength and composition. Bone. 117:130–137.
- Giannini S, Nobile M, Sartori L, Dalle Carbonare L, Ciuffreda M, Corro P, D'Angelo A, Calo L, Crepaldi G. 1999. Acute effects of moderate dietary protein restriction in patients with idiopathic hypercalciuria and calcium nephrolithiasis. Am J Clin Nutr. 69:267–271.
- Hansen TH, Madsen MTB, Jorgensen NR, Cohen AS, Hansen T, Vestergaard H, Pedersen O, Allin KH. 2018. Bone turnover, calcium homeostasis, and vitamin D status in Danish vegans. Eur J Clin Nutr. 72:1046–1054.
- Henderson L, Gregory J, Swan G. 2002. The National Diet and Nutrition Survey: adults aged 19–64 years. Vol 1. Types and quantities of foods consumed. London: TSO.
- Hu R, Huang X, Huang J, Li Y, Zhang C, Yin Y, Chen Z, Jin Y, Cai J, Cui F. 2015. Long- and Short-Term Health Effects of Pesticide Exposure: A Cohort Study from China. PLoS ONE. 10:e0128766.
- Hunter D, De Lange M, Snieder H, MacGregor AJ, Swaminathan R, Thakker RV, Spector TD. 2001. Genetic contribution to bone metabolism, calcium excretion, and vitamin D and parathyroid hormone regulation. J Bone Miner Res. 16:371–378.
- Ilich JZ, Kerstetter JE. 2000. Nutrition in bone health revisited: a story beyond calcium. J Am Coll Nutr. 19:715–737.
- Joseph F, Chan BY, Durham BH, Ahmad AM, Vinjamuri S, Gallagher JA, Vora JP, Fraser WD. 2007. The circadian rhythm of osteoprotegerin and its association with parathyroid hormone secretion. J Clin Endocrinol Metab. 92:3230–3238.
- Kamycheva E, Sundsfjord J, Jorde R. 2004. Serum parathyroid hormone level is associated with body mass index. The 5th Tromsø study. Eur J Endocrinol. 151:167–172.
- Kerstetter JE, Svastisalee CM, Caseria DM, Mitnick ME, Insogna KL. 2000. A threshold for low-protein-diet-induced elevations in parathyroid hormone. Am J Clin Nutr. 72:168–173.
- Kovesdy CP, Ahmadzadeh S, Anderson JE, Kalantar-Zadeh K. 2007. Obesity is associated with secondary hyperparathyroidism in men with moderate and severe chronic kidney disease. Clin J Am Soc Nephrol. 2:1024–1029.
- Lederer E. 2014. Regulation of serum phosphate. J. Physiol. (Lond.) 592:3985–3995.
- Li F, Muhlbauer RC. 1999. Food fractionation is a powerful tool to increase bone mass in growing rats and to decrease bone loss in aged rats: modulation of the effect by dietary phosphate. J Bone Miner Res. 14:1457–1465.
- Lofrese JJ, Lappin SL. 2018. Physiology, endocrine, parathyroid. Treasure Island FL: StatPearls Publishing LLC.
- Matana A, Torlak V, Brdar D, Popovic M, Lozic B, Barbalic M, Perica VB, Punda A, Polasek O, Hayward C, et al. 2017. Dietary Factors Associated with Plasma Thyroid Peroxidase and Thyroglobulin Antibodies. Nutrients 9:1186.
- Merrill RM, Aldana SG. 2009. Consequences of a plant-based diet with low dairy consumption on intake of bone-relevant nutrients. J Womens Health (Larchmt). 18:691–698.
- Mihai R, Farndon JR. 2000. Parathyroid disease and calcium metabolism. Br J Anaesth. 85:29–43.
- Nissenson RA, Jüppner H. 2013. Parathyroid hormone. 8th ed. In: Rosen CJ, editor. Primer on the metabolic bone diseases and disorders of mineral metabolism. New Jersey: John Wiley & Sons; p. 208–214.
- Paik JM, Curhan GC, Taylor EN. 2012. Calcium intake and risk of primary hyperparathyroidism in women: prospective cohort study. BMJ. 345:e6390.
- Paik JM, Farwell WR, Taylor EN. 2012. Demographic, dietary, and serum factors and parathyroid hormone in the National Health and Nutrition Examination Survey. Osteoporos Int. 23:1727–1736.
- Peng T, Hu Z, Yang X, Gao Y, Ma C. 2018. Nitrite-induced acute kidney injury with secondary hyperparathyroidism: case report and literature review. Medicine. 97:e9889.
- Rudan I, Marusic A, Jankovic S, Rotim K, Boban M, Lauc G, Grkovic I, Dogas Z, Zemunik T, Vatavuk Z, et al. 2009. "10 001 Dalmatians:" Croatia launches its National Biobank. Croat Med J. 50:4–6.
- Sai AJ, Walters RW, Fang X, Gallagher JC. 2011. Relationship between vitamin D, parathyroid hormone, and bone health. J Clin Endocrinol Metab. 96:E436–E446.
- SCF, 1995. Report of the scientific committee for food. Opinion of the scientific committee for food on: nitrates and nitrite. Brussels: European Commission.
- Schlemmer A, Hassager C. 1999. Acute fasting diminishes the circadian rhythm of biochemical markers of bone resorption. Eur J Endocrinol. 140:332–337.
- Serra-Majem L, Bautista-Castano I. 2015. Relationship between bread and obesity. Br J Nutr. 113 Suppl 2: S29–S35.
- Sukumar D, Schlussel Y, Riedt CS, Gordon C, Stahl T, Shapses SA. 2011. Obesity alters cortical and trabecular bone density and geometry in women. Osteoporos Int. 22:635–645.
- Tylavsky FA, Holliday K, Danish R, Womack C, Norwood J, Carbone L. 2004. Fruit and vegetable intakes are an independent predictor of bone size in early pubertal children. Am J Clin Nutr. 79:311–317.
- US FAD Administration. 2017. Vegetables Nutrition Fact. [accessed 2018 Mar 21]. https://www.fda.gov/Food/LabelingNutrition/ucm114222.htm.
- Vaidya A, Curhan GC, Paik JM, Wang M, Taylor EN. 2016. Physical activity and the risk of primary hyperparathyroidism. J Clin Endocrinol Metab. 101:1590–1597.
- Zhu H, Ding L, Xiao H, Ni W, Xue F, He Z. 2012. Pharmacological evaluation of LiuWei Zhuanggu Granules in rats. Molecules. 17:8001–8009.