
Abstract
The major aim of this controlled, randomised, open-labelled, parallel-grouped, clinical trial was to investigate whether supplementation with different dosages of omega-3 fatty acids (0.5 g/d and 1 g/d) from a plant-based fatty acid supplement affected omega-3-indices (O3I) in well-nourished, healthy people. In addition, the combined ingestion of the plant-based fatty acid supplement, together with an encapsulated fruit, vegetable and berry (FVB) juice powder concentrate, was applied in order to observe the absorption of certain micronutrients and to examine some aspects related to the safe consumption of the products. The data demonstrate that the intake of only 0.5 g/day of omega-3 fatty acids from of a vegan supplement was able to increase the O3I significantly after 8 and 16 weeks. The combined ingestion with the FVB supplement concurrently increased serum concentrations of specific vitamins and carotenoids without effects on hepatic, kidney and thyroid function or changes in blood lipids.
Introduction
Omega-3 fatty acids (n3FAs) have been of great interest to researchers for many years. Evidence from various studies shows the importance of these compounds on humans’ health and their positive effects on the cardiovascular system and blood lipids regulation (EFSA 2009; Mozaffarian and Wu Citation2011; Skulas-Ray et al. Citation2011; Leslie et al. Citation2015; Del Gobbo et al. 2016; Harris et al. Citation2017a), cognitive performance/reserve (Abubakari et al. Citation2014; Bo et al. Citation2017; Amen et al. Citation2017), bone health (Mangano et al. Citation2014; Jorgensen et al. Citation2016; Kuroda et al. Citation2017; Lavado-Garcia et al. Citation2018) and gastrointestinal function (Calder Citation2009; Costantini et al. Citation2017). The omega-3 polyunsaturated fatty acids (n3 PUFA) eicosapentaenoic acid (EPA) and docosahexaenoic acid (DHA) are essential fatty acids that humans are not able to synthesise, hence have to be supplied through the diet. Rich sources of n3FAs include fatty fish such as salmon, tuna and sardines, as well as krill and algae. National and international public health departments (NHMRC Citation2013; USDHHS&USDA Citation2015; FMHWA Citation2017) recommend a weekly consumption of 150–300 g of fish and seafood to the general healthy adult population in order to ingest appropriate amounts of EPA and DHA. Based on the current body of scientific evidence the Global Organisation of EPA and DHA (GOED) even recommends 500 mg of EPA and DHA per day, in order to lower the risk of coronary heart disease (CHD), 700 mg/day of EPA and DHA (of which at least 300 mg should be DHA) for pregnant and lactating women and 1000 mg/day or more for secondary prevention of CHD, for maintenance of normal blood pressure and lowering triglycerides (GOED Citation2017). Evidence from nutrition surveys show that these goals are rarely met, as the mean intakes of fish and fish oils are below recommendations (NHMRC Citation2013; FMHWA Citation2017; PHE Citation2019; Richter et al. Citation2019; Thompson et al. Citation2019).
The omega-3 index (O3I) proposed by Harris and von Schacky, is described as the content of DHA and EPA expressed as percentage from FAs occurring in the cell membranes of red blood cells (erythrocytes) and is inversely associated with the risk for CHD mortality (Harris and Von Schacky Citation2004; Harris Citation2009; Harris et al. Citation2017a). There is a strong correlation observed between the value of the O3I and the dietary intake of n3FAs. Therefore, it can be used as a surrogate for assessing tissue levels of EPA and DHA. An index of less than 4% is associated with a tenfold risk of sudden cardiac death in comparison to an O3I greater than 8%. Low indices may also be a risk factor for coronary artery disease and for complications of congestive heart failure (von Schacky Citation2009). A recent study suggested that higher O3Is were associated with greater longevity in post-menopausal women and may reduce the risk of death across a spectrum of causes (Harris et al. Citation2017b).
Canada was the first nation to include the O3I in its nutrition survey and found that the average value for adults was only 4.5%. Less than 3% of Canadians had levels greater than 8%, in the low risk range. Interestingly, 43% had O3I levels below 4%, in the high risk zone (Langlois and Ratnayake Citation2015).
Researchers compared O3Is across the globe, evaluating data from 298 studies. The map they created shows that regions with high EPA and DHA blood levels (>8%) include the Sea of Japan, Scandinavia and populations that have no western dietary habits, while extremely low levels (<4%) were found in North, Central and South America, Europe, the Middle East, Southeast Asia, and Africa (Stark et al. Citation2016). A recent study by Walker et al. (Citation2019) concluded that 2200 mg/d n3 would be needed to increase O3I from 2% to 8% in 13 weeks, 1500 mg for an increase from 4% to 8% and 750 mg for an increase from 6% to 8%. In order to reach an O3I of 8% over the course of a lifetime, lower n3 intake is required. For example, in Japan where the average O3I of the population is >8%, daily intake of n3 is between 800–1000 mg.
Due to the fact that there are restricted resources regarding fish, exploiting alternative sources of n3FAs (i.e. plant derived) are of great interest.
The aim of this study was to test the bioavailability of different doses (0.5 g and 1 g) of a plant derived n3 food supplement, assessed by changes on O3I following 16 weeks of supplementation, as well as to investigate if there was a dose dependent effect. Secondary objectives included to assess if ingestion of a plant derived n3 food supplement (0.5 g) in combination with a fruit, vegetable and berry (FVB) juice powder concentrate had an effect on micronutrient absorption and some aspects of products´ safety and subjects' serum lipid levels.
Materials and methods
Study design and description of interventions
This was a randomised, controlled, open-labelled, 4 arm, parallel-grouped, clinical trial.
Participants were randomised into the control group, where they had to adhere to their habitual diet, or to one of the three intervention groups. Subjects in group 2 were asked to ingest two capsules of the fatty acid blend (Juice Plus+® Omega Blend, The Juice Plus+® Company, Tennessee) per day, containing 0.5 g n3FA, in group 4 to consume four capsules per day, containing 1.0 g n3FA and in group 8 to consume two capsules (0.5 g n3FA) and six FVB capsules (Juice Plus+® Premium, The Juice Plus+® Company, Tennessee) per day. The subjects were asked to ingest the capsules twice daily with meals and with ad libitum water. The fatty acid blend contained plant-derived FAs from algae (Schizochytrium sp.) and from many different plant seeds including raspberries, pomegranate, tomatoes and sea buckthorn. The daily supply of 2 capsules of this vegan n3FA supplement provided 225 mg DHA and 190 mg EPA.
The FBV juice powder concentrate derived from the following 36 fruits, vegetables, and berries: concord grape, blueberry, cranberry, blackberry, bilberry, raspberry, redcurrant, blackcurrant, elderberry, green tea, ginger root, grape seed, artichoke leaf, cocoa, pomegranate, apple, orange, pineapple, cranberry, peach, acerola cherry, papaya, beet root, date, prune, carrot, parsley, beet, kale, broccoli, cabbage, tomato, spinach, sugar beet, garlic, as well as oat and rice bran. A daily supply of 6 capsules provided 2.91 mg/4850 IU ß-carotene, 490 μg vitamin A, 18.7 mg/28 IU vitamin E, 159 mg vitamin C, 6.1 mg lutein and 1 mg lycopene.
Participants were asked to refrain from using any supplements over the course of the study period and to maintain their usual eating habits. In order to maximise compliance, participants were reminded biweekly via telephone calls and/or emails to continue taking their capsules. Participants were also asked to return any remaining/non-consumed capsules, on their last study visit.
Recruitment of participants and trial setting
Participants were eligible if they met the following inclusion criteria: aged 20–65 years, non-smokers, BMI > 20 and < 35 kg/m2, O3I: position 30–101 on the ranking of screened participants, no medication, premenopausal, normal dietary habits (no specific diets, meals, food components etc.), and willing to adhere to a 4-week wash-out period prior to their first study visit. Subjects not meeting the aforementioned inclusion criteria, those consuming > 1 portion of fish/week, > 1 portion (25 g)/day linseed or walnut oil, > 1 portion (25 g)/day whole linseeds or walnuts and n3FA enriched functional foods, with hypertension (starting with grade 2 according to the classification of the European Society of Hypertension: systolic blood pressure > 160 mmHg, diastolic blood pressure > 100 mmHg), with clinically relevant infectious and acute/chronic inflammatory diseases, with diabetes mellitus type I or II, women with menstrual dysfunctions, pregnant women and alcoholics were excluded from the study.
Participants were recruited from the Graz region, Austria, either by word of mouth or by replying to advertising material (i.e. flyers). Study visits were conducted at the Otto Loewi Research Centre, Division of Immunology and Pathophysiology of the Medical University of Graz.
All subjects provided written informed consent prior to participating in this investigation. This study was conducted according to the guidelines of the Declaration of Helsinki for Research on Human Subjects 1989 and was approved by the Ethical Review Committee of the Medical University of Graz, Austria. The trial was registered under www.clinicaltrials.gov. identifier: NCT03348553.
Omega-3 index ranking, stratification and randomisation
We estimated that despite pre-selection (i.e. via phone calls and pre-screening visits), approximately 20–30% of interested subjects might have too high O3I for this study. Since subjects with an O3I >10% might not have additional health benefits from supplementation with n3FAs, we elaborated an O3I ranking from highest to lowest for 51 men and 50 women that completed the pre-screening visit. Based on this ranking, we excluded the 15 best ranked male subjects, and the 14 best ranked female subjects, in order to remain with 72 subjects (n = 36 per gender), which is in accordance to the power calculation (to ensure power > 80%, see “sample size calculation”).
The remaining and ranked 36 subjects per gender were organised in 9 quartets. The randomisation into the 4 intervention groups was conducted computerised by assigning 1 person from each quartet to one of the 4 intervention groups. This procedure ensured the equal distribution of males and females in all 4 groups (9 females and 9 males in each group).
Wash-out, variables, time schedule
Enrolled participants were asked to adhere to a 4-week washout period, thus the intake of dietetic foods, food supplements and nutraceuticals 4-weeks prior to the baseline visit as well as during the course of the study were not allowed. During the baseline visit, a 34 mL fasting blood sample was collected to assess O3I, FAs, haemogram, carotenoids and tocopherols, vitamin C, lipid profile, clinical chemistry and fasting blood glucose. Height, weight and blood pressure measurements were also performed. Participants were asked to attend follow-up visits after 8 (midpoint) and 16 weeks (endpoint) of supplementation for additional blood samplings and assessment of the same parameters evaluated at the baseline visit. Capsules were dispensed at the baseline visit for the first half of the study and at the 8-week follow-up visit for the remaining second half of the study.
Dietary assessment
Subjects were instructed to maintain their habitual diet throughout the intervention time. They were also asked to record their diet (types of foods and drinks and amounts consumed) for the last 3 days prior to the three study visits, in order to ensure intra-individual standardisation of the diet. Dietary intakes and recordings were supervised and reviewed by a registered dietitian.
Blood samples processing
Blood was treated immediately after sampling and centrifuged at 3000 rpm for 10 min to get the plasma. Thereafter, it was cooled at 4–6 °C and portioned according to laboratories/analytes. The supernatant was frozen at −70 °C and kept at the study site for further analysis. Blood samples for the clinical chemistry analyses were transported immediately after collection to another collaborating laboratory for analysis.
Analytical methods
Total FAs (free and esterified) were measured by GC-EI/MS (Agilent Technologies Inc, Santa Clara, California) as previously reported (Jha et al. Citation2014; Mueller et al. Citation2015). Lipid extraction was performed according to the methyl-tert-butyl ether protocol published by Matyash et al. (Citation2008). The dried extracts of the lipids were resuspended with 1 mL methanol/NaOH and subsequently again esterified by addition of BF3. Thereafter, they were extracted by means of saturated NaCl solution and hexane. Measurements were done with the Agilent MSD GC-MS using a TR-FAME 30 m column with helium as carrier gas at 250 °C injector temperature in the split mode. Ionisation in the mass spectrometer was done by means of electron impact ionisation (EI) and fatty acids were detected in Fullscan at 80–400 m/z. Source temperature amounts to 250 °C and the transfer liner had a temperature of 200 °C. The quantification was done with a non-endogenous internal standard FA 17:0. The O3I of erythrocytes was determined by means of GC-EI/MS method, similar to the analysis of n3FAs in the blood serum. The Agilent MSD GC-MS (Agilent Technologies Inc, Santa Clara, California) device was used.
Concentrations of vitamin E and vitamin C were measured by reversed-phase high-performance liquid chromatography (HPLC) (RECIPE ClinRep® Complete Kit, Munich, Germany). For analysis of vitamin E, samples were treated as follows: 150 μL plasma was added to 150 μL precipitant containing the internal standard. After centrifuging, 100 μL of the supernatant was added to 100 μL of the stabilising reagent. After further centrifugation, 50 μL of the supernatant was injected into the HPLC system. For vitamin C analysis, 100 μL plasma was added to 100 μL of the precipitant which contained the internal standard. After 10 min incubation at 4 °C the sample was centrifuged and 20 μL of the supernatant was injected into the HPLC system. Separation and analysis were done on the HPLC system (JASCO, Vienna, Austria) with UV detector at the appropriate wavelength (for vitamin E: 295 nm; for vitamin C: 243 nm). Quantification was done by internal standard method and calibration.
Carotenoids from EDTA plasma were extracted with the ClinRep® kit for ß-carotene (RECIPE Chemicals + Instruments GmbH, Munich, Germany) according to the manufacturer’s protocol. For precipitation, 100 μL of the sample was added to 200 μL precipitant which contained the internal standard and 100 μL stabilising reagent. After vortexing and centrifuging, 100 μL of the supernatant was injected into the HPLC system. Additionally, to all-trans-ß-carotene, external standard curves were done for quantification of lutein (89723, Phytolab, Vestenbergsgreuth, Germany) and all-trans-lycopene (75051, Sigma Aldrich, Vienna, Austria). All standards (∼1 mg) were first dissolved in 2 mL dichloromethane containing 0.1% butylated hydroxytoluene (BHT, Carl Roth, Karlsruhe, Germany) and then in n-hexane (HPLC grade, Carl Roth, Karlsruhe, Germany) up to 10 mL for stock solutions. Further dilutions were made in mobile phase. Concentration of each standard was checked photometrically with SPECTROstar® Nano (BMG Labtech, Ortenberg, Germany) at 450 nm and calculated with the suitable extinction coefficient (Garofalo et al. 2011). The range of the standard curves was 50 µg/L to 1000 µg/L for lutein and 300 µg/L to 1500 µg/L for lycopene. All carotenoids were separated chromatographically within the kit-containing column and mobile phase with subsequent UV-detection at 450 nm. Lutein and zeaxanthin are structural isomers and co-elute. Due to the fact that the amount of lutein is much higher than zeaxanthin (Turner and Burri Citation2012), only lutein was used as standard for quantification. Nevertheless, the results are indicated as lutein/zeaxanthin. The standard curves were checked for accuracy with the NIST 968e (National institute of standard and technology, Gaithersburg, USA).
Lipid profile, as well as clinical chemistry analysis including minerals and markers of hepatic and renal function, were performed by standard equipment (Architect ci8200; Abbott Diagnostics, Illinois, USA).
Hemogram-analysis was performed by standard equipment ABX Micros 60 by means of impedance analysis (Axon Lab AG, Polling, Austria).
Sample size calculation and statistical analyses
A physiological relevant effect of a nutraceutical intervention on the O3I was set at a 20% change after 4 months of supplementation. A type 1 error was set at α = 0.05. We wanted to achieve a minimum statistical power of 0.80 (probability of type 2. error = 20%). Assuming a drop-out rate of about 15%, sample size calculation revealed that 72 subjects in total were necessary (to end up with at least 60 subjects) to be recruited and to ensure equivalent group sizes (n = 18 per group).
Statistical analyses were conducted using the SPSS for Windows Software, Version 22.0. Data are presented as mean ± SD (standard deviation) with statistical significance set at p < 0.05. The Shapiro-Wilk test was used to determine normal distribution. The Levene test was used for variance homogeneity.
Baseline characteristics (age, gender, weight, BMI etc.) of subjects were determined by means of descriptive statistics. For normally distributed data, paired t-tests were used for comparisons between baseline and endpoint, baseline and midpoint and between midpoint and endpoint for each group. One and two factorial repeated measure analysis of variance (ANOVA) were used to perform within and between group comparisons for the factors time and treatment, respectively (p-group tot and p-time tot). Gender comparisons were performed with Student´s t-test and repeated measures ANOVA. If significant differences were found in the ANOVA calculations between the groups, Tukey’s post hoc test and/or Bonferroni correction were used to locate the differences. The resulting and presented p-values of the ANOVAs are determined exclusively with the (stricter) Bonferroni model.
Results
Study population, clinical chemistry and compliance
A CONSORT diagram outlining subjects’ recruitment is depicted in . Sixty-eight participants (33 females, 35 males), out of 72 at baseline, completed the study. Data from the four non completers, were excluded from analysis. In all groups we had a minimum of 15 participants completing the study. Subject characteristics are presented in . No differences in age, weight and BMI between the baseline, 8-week and 16-week follow-up visit were observed. Clinical parameters including cholesterol, high-density lipoprotein (HDL) and low-density lipoprotein (LDL) cholesterol, triglycerides, fasting blood glucose, alkaline phosphatase (ALP), aspartate aminotransferase (AST), gamma-glutamyltransferase (GGT), ferritin, iron, creatinine, uric acid, urea, vitamin D3, and thyroid stimulating hormone (TSH) also did not differ between the baseline, 8 week and 16 week visit (p > 0.1). Supplementation had no effect on markers of hepatic and renal function, and markers of thyroid function (p > 0.1). Returned capsules count following completion of study visits, revealed a compliance of > 95%.
Figure 1. Consort diagram: ♂ = male, ♀ = female, LDL = Low-density lipoprotein, O3I = Omega-3-Index.
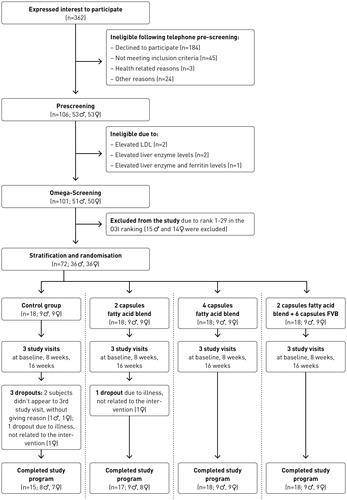
Table 1. Subjects' characteristics and clinical chemistry.
Omega-3 and micronutrients analysis
Changes in O3I, fatty acids and micronutrient concentrations between the baseline, 8-week and 16-week visit are depicted in . Concentration values of O3I, DHA, EPA, vitamin C, α-tocopherol, γ-tocopherol, ß-carotene, lutein/zeaxanthin and lycopene from baseline, 8-week and 16-week visits, are presented in Supplemental Table 1(a). Within and between group comparisons for time and treatment for all these parameters are presented in Supplemental Table 1(b).
Figure 2. Omega-3-Index (O3I), docosahexaenoic acid (DHA), eicosapentaenoic acid (EPA) and plasma concentrations of vitamin C, alpha-tocopherol, gamma-tocopherol, beta-carotene, lutein/zeaxanthin and lycopene at baseline, after 8 (midpoint) and after 16 weeks (endpoint) of supplementation. Control = control group: n = 15; Group 2 = 2 capsules/day of omega blend: n = 17; Group 4 = 4 capsules/day of omega blend: n = 18; Group 8 = 2 capsules/day of omega blend plus 6 capsules/day of FVB supplement: n = 18; Values are means, with standard deviations represented by vertical bars. Letters a-f denote statistical significances (p < 0.05) for group comparisons (a: 0 vs 2, b: 0 vs 4, c: 0 vs 8, d: 2 vs 4, e: 2 vs 8, f: 4 vs 8), letters g-i denote statistical significances (p < 0.05) for time comparisons (g: 0 vs 1, h: 0 vs 2, i: 1 vs 2).
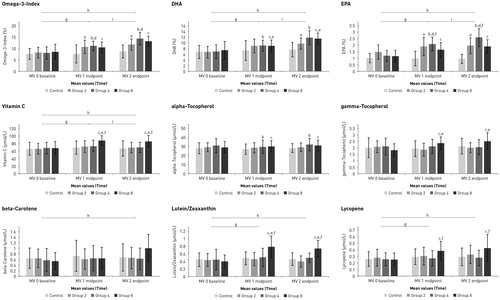
Omega-3-Index (O3I), docosahexaenoic acid (DHA) and eicosapentaenoic acid (EPA)
We observed significant differences between groups and time points for the O3I, DHA and EPA. The control group showed significant lower values after supplementation compared to all other (supplemented) groups. These differences between control and the other groups already occurred after 8 weeks of supplementation and were greater after 16 weeks. For Omega-3 Index and EPA, significant differences were found between group 2 and group 4 with higher values in group 4 after 16 weeks. For DHA there was a difference by trend between group 2 and group 4 after 16 weeks, with higher values in group 4. Furthermore, a statistically significant difference between group 2 and group 8 was observed after 16 weeks of supplementation. For all three parameters, O3I, EPA and DHA, comparisons between genders showed higher mean values in the female cohort throughout the whole study. However, there were no differences between genders in terms of response to the supplementation. For mean- and p-values, see Supplemental Tables 1(a–c).
Vitamin C, alpha-tocopherol (α-tocopherol), gamma-tocopherol (γ-tocopherol)
We observed significant differences for vitamin C concentrations, between the FBV supplemented group 8 and the other 3 groups. The increase in vitamin C already happened between baseline and midpoint and remained high until the endpoint. For α-tocopherol we observed significant differences between group 0 and group 4, and between group 0 and group 8. We observed statistically significant differences between group 0 and group 2 compared to group 8 for γ-tocopherol concentrations. Comparison between group 4 and group 8, as well as over time comparisons, missed significance. In contrast to α- and γ-tocopherol, we observed differences between genders for vitamin C, with higher values in females compared to males, but the response to the supplementation did not show any differences between males and females. For mean- and p-values, see Supplemental Table 1(a–c).
Beta-carotene, lutein/zeaxanthin and lycopene
For ß-carotene, the comparisons of the groups 0, 2 and 4 compared to group 8 showed a trend towards higher values in group 8. The comparisons of lutein/zeaxanthin and lycopene between group 8 and the other 3 groups showed significantly higher concentrations in group 8. For ß-carotene there was also a significant difference between genders observed, where women had significantly higher plasma ß-carotene concentrations compared to men but the response to the supplementation did not show any differences between genders. We did not observe differences between females and males for lutein/zeaxanthin and lycopene. For mean- and p-values, see Supplemental Table 1(a–c).
Discussion
The main goal of this study was to determine the possible increase in O3I after 8 and 16-week supplementation with a vegan n3FA food supplement. We invited healthy people with low n3FA dietary intake to participate, as this is representative of the Western population and we assumed that those people could benefit more from n3FA supplementation (FMHWA Citation2017; PHE Citation2019; Richter et al. Citation2019).
Previous research led us assume that the average O3I of our cohort would be between 4 and 5% (Harris and Von Schacky Citation2004; Langlois and Ratnayake Citation2015; Drudi et al. Citation2017); nonetheless, after pre-screening our subjects, we found an average index of almost 8%. These values are comparable to values observed in Scandinavian countries (Stark et al. Citation2016) and are considerably higher than expected, considering that the participants of our study consumed little to no fish and no n3 PUFA supplements. Even though our subjects had O3Is close to the optimal range, we still observed significant differences between groups and measurement times. The control group showed significantly lower O3I values compared to the three supplemented groups, indicating that all supplementation models were effective in terms of index increase. These differences between control and the other groups already occurred after 8 weeks of supplementation and were greater after 16 weeks. There was also a significant difference between group 2 and group 4, with higher values in group 4, indicating that 4 capsules had a greater effect on individuals’ O3I compared to 2 capsules per day.
In a study conducted by Harris and von Schacky (2004) on the effects of relatively small omega-3 doses on the O3I, subjects were randomised to 0 (control group), 0.5, 1.0 and 2.0 g EPA + DHA per day for 5 months. It should be noted that the cohort had an initial O3I of 4.7%, while our subjects had an initial index of 7.9%. The researchers observed an increase of 68% with supplementation of 0.5 g/day, 110% with 1.0 g/day and 147% with 2.0 g/day after 20 weeks. In comparison, the present study found increases of 43%, 80% and 56% for group 2 (containing 415 mg EPA and DHA), group 4 (830 mg EPA and DHA) and group 8 (415 mg EPA and DHA and FVB dried juice concentrate) respectively, after 16 weeks of supplementation. In another study by Drudi et al. (Citation2017) an O3I increase from 5.1 ± 1.3% to 9.0 ± 1.8% (p < 0.01) was observed, following supplementation with 2.6 g EPA and 1.8 g DHA daily for a month. It must be noted that the supplementation subjects received in the study by Drudi et al. compared to our study provided almost 13 times the amount of EPA and almost 8 times the amount of DHA contained in 2 capsules and still 6.5 and 4 times the amount of EPA and DHA in 4 capsules. Nevertheless, the supplementation models in our study could still increase the O3I significantly.
The additional intake of the FVB supplement showed a significant increased DHA absorption in group 8 compared to group 2 although the same number of n3FA capsules was ingested in both groups. Such a complementing effect of the concurrently administered FVB concentrate was not observed with EPA and with O3I, it also missed significance. Interestingly, a previous observation by Pipingas et al. (Citation2014) reported improved FAs absorption with coincident vitamin supplementation. However, based on our data and study design, and the scarce evidence via literature we are not able to establish a mechanistic explanation for our observation. Further studies are needed to elucidate possible complementing effects on absorption when fatty acids are simultaneously ingested with vitamins and phytonutrients.
Compared to EPA, DHA was a stronger driver for the increase in O3I since the observed percentages of DHA following supplementation were about 6-fold higher than for EPA. Furthermore, the concentration of DHA in the product, and therefore the daily intake via the product, was about 20% higher than the EPA concentration. Our observations correspond to those of Allaire et al. (Citation2017) who also reported significantly greater O3I increase following DHA compared to EPA supplementation. The comparatively higher O3I, EPA and DHA values of the female subjects throughout the study, which are not related to the intervention, could be due to a higher conversion rate of precursors in EPA and DHA. Although we did not find major differences in dietary protocols, there is evidence that women have higher conversion rates regarding DHA compared to men (Burdge and Wootton Citation2002; Calder Citation2016), which may also be due to hormones (Giltay et al. Citation2004).
It is worth noting, that parallel to this trial, we performed a stability control of the omega supplement, over 18 months in 2-months cadence, at room temperature (22 °C) and under chilled conditions (4 °C). Our results revealed that the contents of DHA and EPA were stable throughout the whole investigation period.
In this study we also wanted to observe whether the combined intake of the fatty acid supplement, together with the FVB juice concentrate, would show a complementing effect. Under “complementing effect” we understand that O3I and vitamin absorption go hand in hand. Thus, we also measured serum concentrations of several vitamins and carotenoids in parallel to fatty acids.
After 16 weeks of supplementation, the vitamin C plasma concentration of the volunteers in group 8 increased significantly compared to the other 3 groups. Six capsules (daily intake) of the FVB juice powder concentrate contained 159 mg of vitamin C. The highest peak of the vitamin C increase was found in the midpoint examination compared to the midpoint endpoint time axis. This indicates that a levelling-up in plasma already occurred after 8 weeks. The observed increase is comparable to the values observed in one of our previous studies, where healthy participants were supplemented with the same FVB supplement for 8 weeks (Dams et al. Citation2019). Our results were within the reference range proposed by Young (Citation1987) (30–110 µmol/L). We observed differences between genders, with higher values in female compared to male participants, which is likely attributed to the fact that women consume higher amounts of vitamin C rich foods compared to men. Our finding is in agreement with the observation of Schleicher et al. (Citation2009), who also reported higher plasma concentrations in women due to higher dietary intake of vitamin C and supplements. Nevertheless, Jungert and Neuhauser-Berthold (2015) concluded that the higher plasma vitamin C concentrations of women compared to men could be partially attributed to the difference in fat-free mass between genders.
We found significant differences on α-tocopherol between the control group and group 4 and between the control group and group 8. Differences between the groups could be observed at baseline, nonetheless no significant effect was observed over time, which suggests that the observed differences are not related to any of the supplementation models. The plasma values are comparable to previous studies, although no increase in values could be observed in the current study. Reboul et al. (Citation2007) observed that a mixture of polyphenols (e.g. catechin and naringenin) and a mixture of carotenoids (e.g. lycopene, ß-carotene and lutein) could significantly affect intestinal α-tocopherol uptake and the inhibitory effect of γ-tocopherol narrowly missed the significance. These data are in line with our observations. Although γ-tocopherol in group 8 had significantly higher values compared to groups 0 and 2, and almost significantly higher values compared to group 4, the inhibitory effect on α-tocopherol could probably be neglected, since the α-tocopherol values were almost 15-fold higher.
In our study, ß-carotene levels increased following supplementation compared to the other groups, and even though results did not reach significance, the increase was still remarkable and of physiological relevance. The main reason for the slightly missed significance, may be due to a high interindividual variability in ß-carotene absorption. Nonetheless, we observed a 20% increase in ß-carotene levels after 8 weeks of supplementation, which is comparable to the observation by Wang et al. (Citation2007), who evaluated ß-carotene levels after following a carotenoids rich diet for 4 weeks. After 16 weeks we observed an 85% increase in ß-carotene levels. Although our subjects had about 55% higher values than the subjects in the study by Wang et al., the observed increase in ß-carotene remained within the reference values for healthy subjects (0.04–2.26 µmol/L) (Bässler et al. Citation2002). The fact that the plasma values in the female cohort were significantly higher than in the male cohort is possibly due to the higher ß-carotene intake of women through the diet according to our dietary records.
All comparisons with group 8 showed significant differences with higher lutein/zeaxanthin levels observed in group 8. Although no further increase was observed in the second half of the study, the 85% increase over a total period of 16 weeks was highly significant. As no reference range for plasma lutein/zeaxanthin exists (similarly for lycopene), we compared our values to values previously reported in other studies. For instance, Korobelnik et al. (Citation2017) reported similar baseline lutein/zeaxanthin values to the ones of our study. In addition, they observed an increase of 53% after 6 months of supplementation, with a supplement whose lutein content was comparable to the product we tested: 6.1 mg versus 5 mg in the Korobelnik study.
The increase in lycopene we observed, demonstrates the effective absorption of the carotenoid contained in the FVB supplement, showing 22 – 35% higher concentrations in group 8, compared to the other three groups. The data indicated that supplementation with 6 capsules of the FVB concentrate, simultaneously with the fatty acid supplement, increased plasma lycopene already after 8 weeks. This is in agreement with the results of one of our previous studies, in which we assessed the absorption from the FVB concentrate when administered as single supplement (Dams et al. Citation2019).
The actual hype of consuming food supplements can also bear some risks, especially when several supplements are ingested together. Therefore, we observed the effects of the two supplements on key biomarkers of liver, kidney and thyroid function as well as on possible effects on blood lipids. EFSA concludes that the supplemental intake of EPA and DHA combined in doses of up to 5 g/day and the supplemental intake of EPA alone up to 1.8 g/day and DHA alone up to about 1 g/day do not raise safety concerns for adults or the general population (EFSA Citation2012). Based on animal studies, several safety evaluations show that the intake of algae supplements (Schizochytrium sp) is safe, and no side effects are to be expected (Fedorova-Dahms et al. Citation2011; Lewis et al. Citation2016). This is in line with our observations. Although four people dropped out in our study during the 16 weeks of supplementation, this was not related to the intervention. We could not observe any or even negative effects on liver, kidney, thyroid gland parameters or blood lipids, indicating the safety of both food supplements over 16 weeks, even when consumed together.
However, Hughbanks-Wheaton et al. (Citation2014) observed a combined intake of DHA (weight-dependent doses of 30 mg/kg body weight providing a total daily DHA dose of 600 to 3600 mg) and a multivitamin supplement vs. placebo (and multivitamin) as part of a safety assessment over 4 years of supplementation in 60 patients with X-linked retinitis pigmentosa. They found 20 adverse events (out of 39) in the supplemented group, compared to 19 adverse events in the placebo group (placebo + multivitamins). Three adverse events were considered to be associated with the intervention because abstinence from capsules alleviated the symptoms. Overall, the adverse effects were minor and sporadic in occurrence and duration. Nevertheless, such data recommend and also reflect our opinion, that food supplementation studies should consider the implementation of safety assessments.
Limitations of the study
We are aware that our study has some potential limitations. Based on Austrian nutritional data, lower O3I concentrations at pre-screening were expected. Fifteen percent of the subjects recruited had an O3I within the desirable range (8%–12% (Jackson et al. Citation2019)), hence a more comprehensive pre-screening might have been appropriate in order to include only those subjects with an O3I < 8%. Nonetheless, we still observed significant differences on O3I concentrations following supplementation. Another limitation is that although we observed significant increases in O3I after supplementation, no causalities or conclusions related to CVD prevention, cognitive function or other postulated beneficial outcomes related to improved O3I can be drawn from this study. Furthermore, we observed the bioavailability and absorption of (micro-)nutrients from the fatty acid supplement alone and in combination with the FVB product and conducted also a comparison of these intervention models to a control group without any supplementation, but we did not investigate the absorption of micronutrients solely from the FVB product. Further studies could investigate possible differences in the absorption of micronutrients from FVB alone compared to the combined ingestion with the fatty acid supplement.
Conclusion
Our intervention demonstrated that the vegan omega supplement observed in the study had a significant positive effect on the O3I and associated fatty acids after only 8 weeks. The simultaneous intake with an FVB juice concentrate led also to an increase of several vitamins and carotenoids. Both supplements can be regarded as safe because liver, kidney, and thyroid markers, as well as blood lipids remained unchanged throughout the study.
Supplemental Material
Download PDF (172.8 KB)Acknowledgements
The authors would like to acknowledge the involvement of each study participant and the contribution of Dr. Anja Horina for helping with study management.
Disclosure statement
Manfred Lamprecht is the head of the Juice Plus Science Institute which is funded by NSA LLC/The Juice Plus + Company, Memphis, Tennessee, USA. Melina Tsiountsioura receives honoraria for scientific counselling from NSA LLC/The Juice Plus + Company. All other authors have no conflicts to declare.
Additional information
Funding
References
- Abubakari AR, Naderali MM, Naderali EK. 2014. Omega-3 fatty acid supplementation and cognitive function: are smaller dosages more beneficial? Int J Gen Med. 7:463–473.
- Allaire J, Harris WS, Vors C, Charest A, Marin J, Jackson KH, Tchernof A, Couture P, Lamarche B. 2017. Supplementation with high-dose docosahexaenoic acid increases the Omega-3 Index more than high-dose eicosapentaenoic acid. Prostaglandins Leukot Essent Fatty Acids. 120:8–14.
- Amen DG, Harris WS, Kidd PM, Meysami S, Raji CA. 2017. Quantitative erythrocyte omega-3 EPA plus DHA levels are related to higher regional cerebral blood flow on brain SPECT. J Alzheimers Dis. 58(4):1189–1199.
- Bässler K, Golly I, Loew D, Pietrzik K. 2002. Vitamin-Lexikon. Munich: Urban and Fischer.
- Bo Y, Zhang X, Wang Y, You J, Cui H, Zhu Y, Pang W, Liu W, Jiang Y, Lu Q. 2017. The n-3 polyunsaturated fatty acids supplementation improved the cognitive function in the Chinese elderly with mild cognitive impairment: a double-blind randomized controlled trial. Nutrients. 9(1):54.
- Burdge GC, Wootton SA. 2002. Conversion of alpha-linolenic acid to eicosapentaenoic, docosapentaenoic and docosahexaenoic acids in young women. Br J Nutr. 88(4):411–420.
- Calder PC. 2009. Fatty acids and immune function: relevance to inflammatory bowel diseases. Int Rev Immunol. 28(6):506–534.
- Calder PC. 2016. Docosahexaenoic acid. Ann Nutr Metab. 69(1):8– 21.
- Costantini L, Molinari R, Farinon B, Merendino N. 2017. Impact of omega-3 fatty acids on the gut microbiota. Int J Mol Sci. 18(12):2645.
- Dams S, Holasek S, Tsiountsioura M, Malliga DE, Meier-Allard N, Poncza B, Lackner S, Jansenberger Y, Lamprecht M. 2019. An encapsulated fruit, vegetable and berry juice powder concentrate increases plasma values of specific carotenoids and vitamins. Int J Vitam Nutr Res. 1–10. DOI: 10.1024/0300-9831/a000609. [Epub ahead of print]
- Del Gobbo LC, Imamura F, Aslibekyan S, Marklund M, Virtanen JK, Wennberg M, Yakoob MY, Chiuve SE, Dela Cruz L, Frazier-Wood AC, et al. 2016. Omega-3 polyunsaturated fatty acid biomarkers and coronary heart disease: pooling project of 19 cohort studies. JAMA Intern Med. 176(8):1155–1166.
- Drudi LM, Schaller MS, Hiramoto J, Gasper W, Harris WS, Hills NK, Grenon SM. 2017. Predictors of change in omega-3 index with fish oil supplementation in peripheral artery disease. J Surg Res. 210:124–131.
- EFSA 2009. EFSA Panel on Dietetic Products, Nutrition and Allergies. Scientific Opinion on the substantiation of health claims related to EPA, DHA, DPA and maintenance of normal blood pressure (ID 502), maintenance of normal HDL-cholesterol concentrations (ID 515), maintenance of normal (fasting) blood concentrations of triglycerides (ID 517), maintenance of normal LDL-cholesterol concentrations (ID 528, 698) and maintenance of joints (ID 503, 505, 507, 511, 518, 524, 526, 535, 537) pursuant to Article 13(1) of Regulation (EC) No 1924/2006. EFSA Journal, 7(10):1263.
- EFSA. 2012. EFSA panel on dietetic products, nutrition and allergies. Scientific opinion on the tolerable upper intake level of eicosapentaenoic acid (EPA), docosahexaenoic acid (DHA) and docosapentaenoic acid (DPA). EFSA J. 10(7):2815.
- Fedorova-Dahms I, Marone PA, Bauter M, Ryan AS. 2011. Safety evaluation of DHA-rich algal oil from Schizochytrium sp. Food Chem Toxicol. 49(12):3310–3318.
- FMHWA 2017. Federal Ministry for Health and Women’s Affairs. Österreichischer Ernährungsbericht 2017. [accessed 2020 Jan 25]. https://broschuerenservice.sozialministerium.at/Home/Download?publicationId=528.
- Garofalo F, Jenkins DJA, EL-Sohemy A, Liu Z, Lee H-J. 2011. Simultaneous measurement of three tocopherols, all-trans-retinol, and eight carotenoids in human plasma by isocratic liquid chromatography. J Chromatogr Sci. 49(3):221–227.
- Giltay EJ, Gooren LJ, Toorians AW, Katan MB, Zock PL. 2004. Docosahexaenoic acid concentrations are higher in women than in men because of estrogenic effects. Am J Clin Nutr. 80(5):1167–1174.
- GOED. 2017. EPA + DHA daily intake recommendations.[accessed 2020 Jan 25]. https://goedomega3.com/storage/app/media/GOED%20Intake%20Recommendations.pdf.
- Harris WS. 2009. The omega-3 index: from biomarker to risk marker to risk factor. Curr Atheroscler Rep. 11(6):411–417.
- Harris WS, DEL Gobbo L, Tintle NL. 2017. The Omega-3 Index and relative risk for coronary heart disease mortality: estimation from 10 cohort studies. Atherosclerosis. 262:51–54.
- Harris WS, Luo J, Pottala JV, Espeland MA, Margolis KL, Manson JE, Wang L, Brasky TM, Robinson JG. 2017. Red blood cell polyunsaturated fatty acids and mortality in the Women’s Health Initiative Memory Study. J Clin Lipidol. 11(1):250.e5–259.e5.
- Harris WS, Von Schacky C. 2004. The Omega-3 Index: a new risk factor for death from coronary heart disease? Prev Med. 39(1):212–220.
- Hughbanks-Wheaton DK, Birch DG, Fish GE, Spencer R, Pearson NS, Takacs A, Hoffman DR. 2014. Safety assessment of docosahexaenoic acid in X-linked retinitis pigmentosa: the 4-year DHAX trial. Invest Ophthalmol Vis Sci. 55(8):4958–4966.
- Jackson KH, Polreis JM, Tintle NL, Kris-Etherton PM, Harris WS. 2019. Association of reported fish intake and supplementation status with the omega-3 index. Prostaglandins Leukot Essent Fatty Acids. 142:4–10.
- Jha P, Knopf A, Koefeler H, Mueller M, Lackner C, Hoefler G, Claudel T, Trauner M. 2014. Role of adipose tissue in methionine-choline-deficient model of non-alcoholic steatohepatitis (NASH). Biochim Biophys Acta. 1842(7):959–970.
- Jorgensen HS, Eide IA, Hartmann A, Asberg A, Christensen JH, Schmidt EB, Godang K, Bollerslev J, Svensson M. 2016. Plasma n-3 polyunsaturated fatty acids and bone mineral density in renal transplant recipients. J Ren Nutr. 26(3):196–203.
- Jungert A, Neuhauser-Berthold M. 2015. The lower vitamin C plasma concentrations in elderly men compared with elderly women can partly be attributed to a volumetric dilution effect due to differences in fat-free mass. Br J Nutr. 113(5):859–864.
- Korobelnik JF, Rougier MB, Delyfer MN, Bron A, Merle BMJ, Savel H, Chene G, Delcourt C, Creuzot-Garcher C. 2017. Effect of dietary supplementation with lutein, zeaxanthin, and omega-3 on macular pigment: a randomized clinical trial. JAMA Ophthalmol. 135(11):1259–1266.
- Kuroda T, Ohta H, Onoe Y, Tsugawa N, Shiraki M. 2017. Intake of omega-3 fatty acids contributes to bone mineral density at the hip in a younger Japanese female population. Osteoporos Int. 28(10):2887–2891.
- Langlois K, Ratnayake WM. 2015. Omega-3 Index of Canadian adults. Health Rep. 26(11):3–11.
- Lavado-Garcia J, Roncero-Martin R, Moran JM, Pedrera-Canal M, Aliaga I, Leal-Hernandez O, Rico-Martin S, Canal-Macias ML. 2018. Long-chain omega-3 polyunsaturated fatty acid dietary intake is positively associated with bone mineral density in normal and osteopenic Spanish women. PLoS One. 13(1):e0190539.
- Leslie MA, Cohen DJ, Liddle DM, Robinson LE, Ma DW. 2015. A review of the effect of omega-3 polyunsaturated fatty acids on blood triacylglycerol levels in normolipidemic and borderline hyperlipidemic individuals. Lipids Health Dis. 14(1):53.
- Lewis KD, Huang W, Zheng X, Jiang Y, Feldman RS, Falk MC. 2016. Toxicological evaluation of arachidonic acid (ARA)-rich oil and docosahexaenoic acid (DHA)-rich oil. Food Chem Toxicol. 96:133–144.
- Mangano KM, Kerstetter JE, Kenny AM, Insogna KL, Walsh SJ. 2014. An investigation of the association between omega 3 FA and bone mineral density among older adults: results from the National Health and Nutrition Examination Survey years 2005–2008. Osteoporos Int. 25(3):1033–1041.
- Matyash V, Liebisch G, Kurzchalia TV, Shevchenko A, Schwudke D. 2008. Lipid extraction by methyl-tert-butyl ether for high-throughput lipidomics. J Lipid Res. 49(5):1137–1146.
- Mozaffarian D, Wu JH. 2011. Omega-3 fatty acids and cardiovascular disease: effects on risk factors, molecular pathways, and clinical events. J Am Coll Cardiol. 58(20):2047–2067.
- Mueller M, Thorell A, Claudel T, Jha P, Koefeler H, Lackner C, Hoesel B, Fauler G, Stojakovic T, Einarsson C, et al. 2015. Ursodeoxycholic acid exerts farnesoid X receptor-antagonistic effects on bile acid and lipid metabolism in morbid obesity. J Hepatol. 62(6):1398–1404.
- NHMRC 2013. National Health and Medical Research Council (2013) Australian Dietary Guidelines. Canberra: National Health and Medical Research Council. [accessed 2020 Jan 25]. https://eatforhealth.govcms.gov.au/sites/default/files/content/n55_australian_dietary_guidelines.pdf.
- PHE. 2019. Public Health England. Statistical summary: National Diet and Nutrition Survey: years 1 to 9 of the rolling programme (2008/09–2016/17): Time trend and income analyses. [accessed 2020 Jan 25]. https://assets.publishing.service.gov.uk/government/uploads/system/uploads/attachment_data/file/772434/NDNS_UK_Y1-9_report.pdf.
- Pipingas A, Cockerell R, Grima N, Sinclair A, Stough C, Scholey A, Myers S, Croft K, Sali A, Pase MP. 2014. Randomized controlled trial examining the effects of fish oil and multivitamin supplementation on the incorporation of n-3 and n-6 fatty acids into red blood cells. Nutrients. 6(5):1956–1970.
- Reboul E, Thap S, Perrot E, Amiot M-J, Lairon D, Borel P. 2007. Effect of the main dietary antioxidants (carotenoids, gamma-tocopherol, polyphenols, and vitamin C) on alpha-tocopherol absorption. Eur J Clin Nutr. 61(10):1167–1173.
- Richter CK, Bisselou KS, Nordgren TM, Smith L, Appiah AK, Hein N, Anderson-Berry A, Kris-Etherton P, Hanson C, Skulas-Ray AC. 2019. n-3 docosapentaenoic acid intake and relationship with plasma long-chain n-3 fatty acid concentrations in the United States: NHANES 2003–2014. Lipids. 54(4):221–230.
- Schleicher RL, Carroll MD, Ford ES, Lacher DA. 2009. Serum vitamin C and the prevalence of vitamin C deficiency in the United States: 2003–2004 National Health and Nutrition Examination Survey (NHANES). Am J Clin Nutr. 90(5):1252–1263.
- Skulas-Ray AC, Kris-Etherton PM, Harris WS, Vanden Heuvel JP, Wagner PR, West SG. 2011. Dose-response effects of omega-3 fatty acids on triglycerides, inflammation, and endothelial function in healthy persons with moderate hypertriglyceridemia. Am J Clin Nutr. 93(2):243–252.
- Stark KD, Van Elswyk ME, Higgins MR, Weatherford CA, Salem N. Jr. 2016. Global survey of the omega-3 fatty acids, docosahexaenoic acid and eicosapentaenoic acid in the blood stream of healthy adults. Prog Lipid Res. 63:132–152.
- Thompson M, Hein N, Hanson C, Smith LM, Anderson-Berry A, Richter CK, Stessy Bisselou K, Kusi Appiah A, Kris-Etherton P, Skulas-Ray AC, et al. 2019. Omega-3 fatty acid intake by age, gender, and pregnancy status in the United States: National Health and Nutrition Examination Survey 2003–2014. Nutrients. 11(1):E117.
- Turner T, Burri BJ. 2012. Rapid isocratic HPLC method and sample extraction procedures for measuring carotenoid, retinoid, and tocopherol concentrations in human blood and breast milk for intervention studies. Chromatographia. 75(5–6):241–252.
- USDHHS&USDA. 2015. U.S. Department of Health and Human Services and U.S. Department of Agriculture. 2015–2020 Dietary Guidelines for Americans. 8th ed. [accessed 2020 Jan 25]. https://health.gov/dietaryguidelines/2015/resources/2015-2020_Dietary_Guidelines.pdf.
- Von Schacky C. 2009. Use of red blood cell fatty-acid profiles as biomarkers in cardiac disease. Biomarkers Med. 3(1):25–32.
- Walker RE, Jackson KH, Tintle NL, Shearer GC, Bernasconi A, Masson S, Latini R, Heydari B, Kwong RY, Flock M, et al. 2019. Predicting the effects of supplemental EPA and DHA on the omega-3 index. Am J Clin Nutr. 110(4):1034–1040.
- Wang W, Connor SL, Johnson EJ, Klein ML, Hughes S, Connor WE. 2007. Effect of dietary lutein and zeaxanthin on plasma carotenoids and their transport in lipoproteins in age-related macular degeneration. Am J Clin Nutr. 85(3):762–769.
- Young DS. 1987. Implementation of SI units for clinical laboratory data. Style specifications and conversion tables. Ann Intern Med. 106(1):114–129.