
Abstract
The present study investigated the effect of a 4-week high fat low carbohydrate (HFLC-G) versus high carbohydrate low glycaemic (LGI-G) or high glycaemic (HGI-G) diet on power output at lactate thresholds, peak oxygen uptake and peak performance during an incremental cycle test in 28 male endurance athletes. All participants showed improved levels of power output at the lactate thresholds with a more pronounced effect in the HFLC-G and LGI-G. In the HFLC-G peak performance (−11.6 ± 16.3 W) decreased, while in the LGI-G (9.20 ± 13.8 W) and HGI-G (9.89 ± 12.8 W) peak performance increased (p = 0.009). In summary, the LGI-G showed comparable training adaptations as the HFLC-G at submaximal intensities without limiting the ability to perform at high intensities. Compared to a HFLC and HGI diet, the LGI diet in this study seemed to be advantageous during submaximal and high intensities resulting from an improved metabolic flexibility.
Introduction
Fatty acids are predominantly metabolised during endurance exercises at submaximal intensities of about 65% of maximum oxygen consumption (VO2max). With increasing intensity and rising energy requirements, the provision of energy by carbohydrates becomes more and more important (Yeo et al. Citation2011; Spriet Citation2014). Recently published data have demonstrated, that with increasing intensity carbohydrate oxidation becomes more prominent, while fat oxidation is reduced (Durkalec-Michalski et al. Citation2018). However, in contrast to fats, the storage capacity for carbohydrates in the liver and muscles (approx. 1500–2000 kcal) is limited (Bergström et al. Citation1967; Nilsson Citation1973). Furthermore, the intestinal carbohydrate uptake is also limited to about 1 − 1.2 g/min (Jeukendrup Citation2004). Hence, nutritional strategies during intense, prolonged endurance exercises focus on an increased fat oxidation to reduce the rate of carbohydrate oxidation and lactate accumulation and to preserve the intramuscular and intrahepatic glycogen stores (Burke and Kiens Citation2006).
Within the last three decades, several studies have indicated an improved fat metabolism under resting and submaximal exercise conditions following long-term (≥ 2 weeks) high fat diets (Phinney et al. Citation1983; Lambert et al. Citation1994; Rowlands and Hopkins Citation2002; Zajac et al. Citation2014; Volek et al. Citation2016; Burke et al. Citation2017). However, in most studies with prolonged high fat diets, there was only a small positive (or even negative) effect on performance during competition – even with a prior carbohydrate restoration phase to prevent low pre-competition glycogen storages (Burke Citation2015).
Alterations in carbohydrate metabolism might be responsible in terms of a decreased metabolic flexibility since major carbohydrate metabolising enzymes (glycogen phosphorylase, phosphofructokinase and pyruvate dehydrogenase) are less activated following a high fat diet in spite of carbohydrate provision (Yeo et al. Citation2011; Spriet Citation2014). Hence, performance at a higher intensity level is impaired to the reduced ability to metabolise carbohydrates. Furthermore, high fat diets are accompanied by side effects since fatigue or poor concentration due to an insufficient provision of micronutrients and glycogen during training sessions play a crucial role in the preparation of competition (Burke Citation2015; Tiller et al. Citation2019).
A carbohydrate-rich low glycaemic nutrition might be a promising approach to improve substrate utilisation at different exercise intensity levels and hence endurance performance during competition. A series of scientific investigations have demonstrated that the consumption of low glycaemic versus high glycaemic carbohydrates led to an increased fat oxidation during exercise due to lower postprandial level of glucose and consequently insulin known to be a very strong inhibitor of lipolysis (Wu et al. Citation2003; Wee et al. Citation2005; Stevenson et al. Citation2006; Bennett et al. Citation2012; König et al. Citation2016). In a very recent publication, a carbohydrate-rich low glycaemic diet led to a higher metabolic flexibility compared to the high fat and carbohydrate-rich high glycaemic diet, since fat utilisation was facilitated during submaximal exercise, while with increasing exercise intensity, the shift towards carbohydrate oxidation was still possible in the group consuming low glycaemic carbohydrates. Furthermore, the low glycaemic diet was more feasible and tolerated than the other nutritional concepts (Zdzieblik et al. Citation2022).
The aim of the current investigation was to examine the impact of a high fat low carbohydrate (HFLC-G) versus high carbohydrate low glycaemic (LGI-G) versus high carbohydrate high glycaemic (HGI-G) diet on performance-related parameters in the incremental cycle test including power output at the lactate thresholds, peak performance and peak oxygen consumption (VO2 peak).
Methods
Experimental design
The present investigation was an open, randomised, non-blinded, controlled study conducted at the Institute for Sport and Sports Science at the Albert-Ludwig-University Freiburg. The participants were recruited with the help of a flyer, Internet access in sports clubs and the university sports centre. The study protocol was reviewed and approved by the Ethical Committee of the University of Freiburg (ETK: 136-16) and registered at the German Clinical Trials Register (DRKS00015521).
Participants
In total, 38 healthy, recreational and competitive male endurance athletes as distance runners, cyclists and athletes performing basic endurance training (e.g. soccer, racket sports) aged between 18 and 50 years were initially screened for the study. After screening, 30 participants fulfilled the inclusion criteria and were assigned to the study groups. With a sample size of 10 per group, significant results have been shown in previous studies with comparable design (Zdzieblik et al. Citation2022). To be considered eligible for enrolment into the study, subjects had to give written informed consent. Performing a minimum of three and a maximum of five training sessions (no professional-level athletes) was defined as inclusion criterion. For that purpose, physical and sports activity [h/week] prior to the intervention was assessed by the Freiburg Questionnaire of physical activity (Frey et al. Citation1999). Exclusion criteria included unstable weight and eating behaviour as well as contraindications to physical activity according to the American College of Sports Medicine guidelines such as cardiovascular, metabolic or renal diseases (Riebe et al. Citation2015) diagnosed from anamnestic data. Baseline characteristics of the subjects are given in .
Table 1. Baseline data for the analysed population (n = 28).
Intervention
The study was completed within a timeframe of 4 weeks. The different phases of the study are summarised in . Prior to the first visit, all participants underwent a screening including a medical history questionnaire to ensure the inclusion criteria were met and that there were no medical conditions that could be aggravated by the performance tests. In addition, anthropometric and demographic data including the body composition (as described in Zdzieblik et al. Citation2022) were measured. Based on their lactate threshold (LT) enrolled participants were matched to the groups (HGI-G, LGI-G and HFLC-G) to minimise baseline differences in performance-related outcomes. For that purpose, a cycle ergometry (Ergoselect 200, Ergoline GmbH, Bitz, Germany) with incremental workload was performed (cycling 3 min at 100 W, then increasing 20 W per 3 min until exhaustion). Capillary blood samples were collected at rest, every 3 min and at exhaustion and analysed using Biosen Glucose and Lactate analyser (EKF diagnostics GmbH, Barleben/Magdeburg, Germany). Lactate thresholds (LT and individual anaerobic threshold [IAT]) were calculated by the lactate curve using the ergonizer software (Freiburg, Germany). A breath-by-breath gas analyser (Innocor® Innovision, Odense, Denmark) was used to determine VO2 and respiratory exchange ratio (RER). The incremental cycle test was performed at baseline (T0) and post-intervention (T4) under the same conditions than during the screening.
Figure 1. Overview of the study schedule.
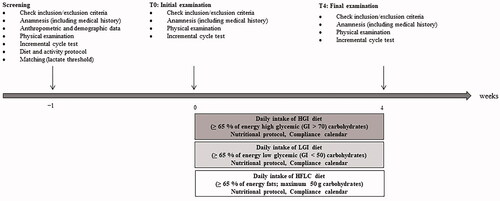
Participants were instructed to follow the dietary pattern according to their respective group over the time course of 4 weeks under the supervision of a licenced dietarian:
HGI-G…≥ 65% of energy high glycaemic (GI > 70) carbohydrates per day
LGI-G…≥ 65% of energy low glycaemic (GI < 50) carbohydrates per day
HFLC-G…≥ 65% of energy fats, maximum 50 g carbohydrates per day
The nutritional guidelines and dietary pattern for each group during the intervention have been described in detail, elsewhere (Zdzieblik et al. Citation2022).
For all visits (screening, T0, and T4), the participants were asked to arrive at the laboratory at the same time in the morning following a fasting period of 12 h and were asked to consume the same foods and liquids (1 L water in the evening, 0.5 L in the morning, no alcoholic drinks within the last 48 h) prior to all examinations.
Measurements
Changes in power output at the LT and IAT were calculated from the blood lactate analysis and compared between the study groups. In addition, VO2 peak was calculated from the highest VO2 value during the incremental test. Another outcome variable was maximum work rate (absolute and in relation to body weight).
Compliance evaluation
During the intervention phase training sessions were controlled by a compliance calendar. Participants reported the type and duration of the exercise performed. In addition, any side effects or adverse events were recorded in the compliance calendar. For self-monitoring the nutritional compliance, participants were instructed to use the diet tracking apps. In addition, participants were asked to complete a daily nutrition protocol during the intervention. The protocols were analysed with Nutriguide (Nutri-Science GmbH, Pohlheim, Germany).
Statistical analysis
In the present trial, endpoints had been defined with no hierarchy. The statistical analysis was exclusively hypothesis-generating and has not any confirmatory character. All tests within the statistical analysis were performed two-sided. The level of significance was set on α = 0.05. Statistical analyses were performed using the Statistical Package for the Social Sciences Software (SPSS for Windows, version 25, SPSS Inc., Chicago, IL).
The results of descriptive analyses were shown in tables as mean ± standard deviation (SD). Baseline values of all parameters were compared between the study groups to show accordance for demographic, anamnestic and efficacy parameters. In case of normally distributed continuous data (proofed by Shapiro–Wilk test) one-way ANOVA was used to check the homogeneity of the baseline values and differences during the course of the study between groups. The Gabriel post-hoc test was performed to identify the groups that differed significantly. Continuous data without normally distribution which cannot be transformed to normally distribution were tested by Kruskal–Wallis test. Following a significant Kruskal–Wallis test, pairwise comparisons using the Dunn–Bonferroni approach were automatically produced. Changes between baseline and post intervention within groups were analysed by paired tests (t-test or Wilcoxon rank sum test). Differences between dietary pattern and nutritional guidelines were checked using the one-sample t-test.
Defined as the smallest change that patients perceive as important, the minimally important difference (MID) was calculated to evaluate the clinical relevance of changes in the respective outcomes. The value of 0.5 SD corresponds to criterion of a medium effect size (Norman et al. Citation2003). Furthermore, the effect sizes were calculated from differences in means between baseline and post-intervention as well as between groups at the end of the investigation (Cohen’s d).
Results
Study population
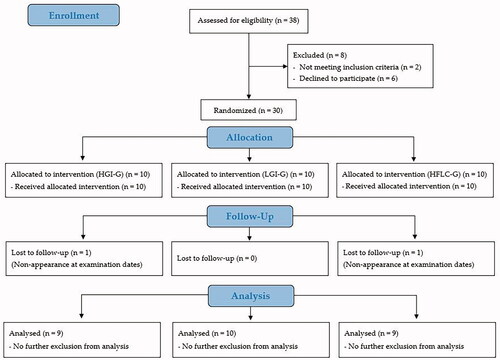
In total, 28 of the initially 30 randomised participants completed the trial and were included in the statistical analysis (9 participants in the HGI-G, 10 in the LGI-G, and 9 in the HFLC-G). Reasons for premature study termination or exclusion from the analysis are shown in . The exclusion of participants was related to missing clinical visits due to voluntarily premature study determination. Neither the routine anamnesis nor information from the compliance calendar revealed any adverse events or pathological findings related to the intervention. The analysis of the nutritional protocols revealed a high compliance to the respective diet. In the HGI-G (66.2 ± 3.93% of energy, p = 0.353) and in the LGI-G (63.8 ± 5.41% of energy; p = 0.530) the percentage carbohydrate intake during the intervention did not differ significantly from the guidelines. Furthermore, the GI in the LGI-G was lower (39 ± 4; p < 0.001) and in the HGI-G higher (74 ± 3; p = 0.007) than the prescribed threshold value. The HFLC-G was compliant with the guidelines for the carbohydrate intake (51.3 ± 14.1 g per day, p = 0.794) and the percentage fat intake (65.1 ± 5.48% of energy; p = 0.966).
Figure 2. Flow chart of subject recruitment, randomisation, and follow up.
Performance-related outcomes after 4 weeks
The baseline and post-intervention data of the respective outcomes are summarised in . As shown in , power output at LT increased in all groups but reached only in the HFLC-G the level of statistical significance (p = 0.036). Power output at IAT had increased by more than half of the SD in all groups (). The HFLC-G exhibit a non-significant decrease in VO2 peak (p = 0.135). Changes of VO2 peak values in the HGI-G did also not reach the level of significance (p = 0.403). VO2 peak values remained unchanged in the LGI-G (p = 0.976). The differences between the LGI-G and the HFLC-G (d = 0.679) as well as the HGI-G and the HFLC-G (d = 0.875) were meaningful ().
Figure 3. Changes in efficacy outcomes. (A) Power at LT; (B) power at IAT; (C) VO2 peak; (D) absolute power output; (E) relative power output. LT: lactate threshold; IAT: individual anaerobic threshold. Data shown as mean ± SD. ap < 0.05 between HGI-G and HFLC-G; bp < 0.05 between LGI-G and HFLC-G in the post-hoc analysis.
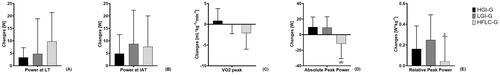
Table 2. Performance-related outcomes of the incremental cycle test at baseline and following the nutritional concepts.
Absolute peak power increased in the HGI-G statistically significantly (p = 0.048) and in the LGI-G with a tendency towards significance (p = 0.065). In contrast, absolute peak power decreased in the HFLC-G (p = 0.107) resulting in statistically significant differences between groups (p = 0.009). According to the post-hoc analysis the HGI-G (p = 0.020; d = 1.322) and LGI-G (p = 0.021; d = 1.260) exhibited a significantly higher improvement in absolute peak power than the HFLC-G (). The relative peak power increased in the LGI-G (p = 0.010). In the HGI-G changes in relative peak power tended to be significant (p = 0.057). The changes in relative peak power differed statistically significantly between groups (p = 0.036) as a result of a statistically significantly greater increase (p = 0.035; d = 1.209) in the LGI-G compared to the HFLC-G ().
Discussion
The current study with male endurance athletes compared a HGI-G, LGI-G and HFLC-G, to assess the single impact of the dietary intervention on performance-related outcomes at submaximal and at higher intensities of a cycle ergometry with incremental workload. Reflecting submaximal performance, participants in the HFLC-G and LGI-G could perform at a higher power at the lactate thresholds after 4 weeks of intervention. While the HFLC-G had a more pronounced improvement in the power output at the LT, the LGI-G showed superior effects at the IAT. It has to be mentioned, that the HGI-G also underwent considerable improvements in the LT and IAT, which were smaller than in the LGI-G and HFLC-G and might be contributed to a training effect and not to the nutritional concept.
VO2 peak and absolute peak power decreased only in the HFLC-G. Changes in VO2 peak were not clinically relevant in the HGI-G or LGI-G in the present study. In contrast, in the HGI-G and LGI-G, the peak performance increased.
It is plausible that high fat diets improve endurance performance, since insulin levels remain low during a high fat diet. As a consequence, fat is predominantly metabolised at submaximal intensity levels. Some studies confirmed, that a high fat diet has a positive impact on performance at submaximal intensities (Phinney et al. Citation1983; Lambert et al. Citation1994; Rowlands and Hopkins Citation2002). Despite an improved fat metabolism under resting conditions and during submaximal exercise, there is a growing body of evidence that these metabolic changes induced by ketogenic or non-ketogenic high fat diets are not associated with an improved endurance performance e.g. during competition (Burke Citation2015; Burke et al. Citation2017; Zinn et al. Citation2017; Durkalec-Michalski et al. Citation2021). Although endurance competitions are predominantly characterised by submaximal intensities, high intensities (e.g. mountain stages, final sprints) have also to be taken into account when assessing the impact of nutrition on the performance (Burke Citation2015).
Previous studies investigating whether carbohydrate-rich diets are more advantageous to improve endurance performance than high fat diets have shown equivocal results (Lambert et al. Citation1994; Rowlands and Hopkins Citation2002; Burke et al. Citation2017). The carbohydrate-rich controls were not chosen by the quality of carbohydrate rather the quantity of ingested carbohydrates. However, first investigations suggest that the impact of carbohydrate-rich diets on endurance capacity has also to be regarded under the aspect of the glycaemic index (GI) of ingested carbohydrates, since the GI has an impact on insulin levels and thus the metabolic flexibility to switch between fat or carbohydrate utilisation at different exercise intensities (Zdzieblik et al. Citation2022).
According to a review and meta-analysis, low glycaemic carbohydrate- rich pre-exercise meals may improve performance to a greater extent or, at least, equally to high glycaemic carbohydrate-rich meals especially when no carbohydrates were provided during the exercise (Burdon et al. Citation2017). So far, there is only one study that demonstrated the impact of long-term carbohydrate-rich diets with different GI on endurance capacity (Durkalec-Michalski et al. Citation2018). The major finding was an improved distance covered in the 12‐min running test and time to exhaustion in the incremental test in the group consuming low glycaemic carbohydrates compared to the medium glycaemic control group explained by a better adaptation to a more stable carbohydrate metabolism in the low-glycaemic group. The results are relatable to our findings although the control group’s diet was characterised by a medium GI, which is closer to the low glycaemic diet in the study by Durkalec-Michalski et al. in contrast to the HGI-G in the current investigation.
To our best knowledge, this is the first study comparing a high fat nutrition and carbohydrate-rich diets with different GI on performance-related outcomes. Hence, to compare the present results with previous studies using high fat versus high carbohydrate diets has to be regarded with caution, since the carbohydrate-rich control diets were not conducted with a specific GI. However, taking the results of the HGI-G and LGI-G of our study together, there is a statistically significant benefit in performance at higher intensities compared to the HFLC-G. The superior effects in performance at submaximal stages in LGI-G compared to the HGI-G might be explained by an improved flexibility to metabolise either carbohydrates or fats dependent on the exercise intensity (Zdzieblik et al. Citation2022). The group consuming a carbohydrate-rich high glycaemic diet tended to an increased carbohydrate metabolism during the incremental test in spite of the intensity. Hence, the high glycaemic diet led to a decreased metabolic flexibility and might only be beneficial for the high intensities. In contrast a low glycaemic diet seem to be of advantage in both endurance scenarios: submaximal and high intensity (Zdzieblik et al. Citation2022).
This trial has some limitations. Using the values of the spiroergometry to estimate the performance has to be taken with caution, since the results in a step incremental test are less precise than in a ramp incremental test (Zuniga et al. Citation2012). Nevertheless, a peak oxygen uptake which is similar to the maximum oxygen uptake can be determined in a step incremental test (Midgley et al. Citation2007). Furthermore, we did not perform a time to exhaustion or time trial. Therefore, it is difficult to assess the prolonged endurance performance. In addition, the incremental test was performed in the fasted state. Future studies with a larger sample size and a pre-exercise meal should use a time to exhaustion or time trial to assess the performance of high fat versus high carbohydrate diets in a competition scenario.
Conclusion
Despite the positive impact on submaximal performance there is a negative effect on endurance performance following a high fat diet due to the lack of carbohydrate provision at higher intensity levels. Smaller adaptations to the fat metabolism when consuming a high carbohydrate low glycaemic diet seem to be beneficial for an enhanced performance in both submaximal and maximal exercise intensities due to an improved adaptation to conditional changes in metabolic demand. In the group following a high carbohydrate low glycaemic diet performance was increased as a potential consequence of full glycogen storages. But changes in metabolism might impair the ability to spare glycogen in submaximal intensities. Taking these findings together, a high carbohydrate low glycaemic diet might be of advantage in performance of endurance exercises as a consequence of metabolic adaptations.
Author contribution
After the study was finished, D. Z. started as researcher in the Collagen Research Institute, Kiel.
Ethical approval
The study was conducted according to the guidelines of the Declaration of Helsinki, and approved by the independent Ethics Committee of the University of Freiburg (protocol code: 136-16 and date of approval: 2017/10/05). The study was registered at the German Clinical Trials Register (DRKS00015521).
Acknowledgements
The authors thank all the participants as well as the staff of the University of Freiburg who supported us with the examination.
Disclosure statement
The authors declare that the research was conducted in the absence of any commercial or financial relationships that could be construed as a potential conflict of interest.
Data availability statement
The datasets generated for this study are available on request to the corresponding author.
References
- Bennett CB, Chilibeck PD, Barss T, Vatanparast H, Vandenberg A, Zello GA. 2012. Metabolism and performance during extended high-intensity intermittent exercise after consumption of low- and high-glycaemic index pre-exercise meals. Br J Nutr. 108(S1):S81–S90.
- Bergström J, Hermansen L, Hultman E, Saltin B. 1967. Diet, muscle glycogen and physical performance. Acta Physiol Scand. 71(2):140–150.
- Burdon CA, Spronk I, Cheng HL, O'Connor HT. 2017. Effect of glycemic index of a pre-exercise meal on endurance exercise performance: a systematic review and meta-analysis. Sports Med. 47(6):1087–1101.
- Burke LM. 2015. Re-examining high-fat diets for sports performance: did we call the ‘Nail in the Coffin’ too soon? Sports Med. 45(S1):33–49.
- Burke LM, Kiens B. 2006. Fat adaptation’ for athletic performance: the nail in the coffin? J Appl Physiol (1985). 100;(1):7–8.
- Burke LM, Ross ML, Garvican-Lewis LA, Welvaert M, Heikura IA, Forbes SG, Mirtschin JG, Cato LE, Strobel N, Sharma AP, et al. 2017. Low carbohydrate, high fat diet impairs exercise economy and negates the performance benefit from intensified training in elite race walkers. J Physiol. 595(9):2785–2807.
- Durkalec-Michalski K, Nowaczyk PM, Główka N, Ziobrowska A, Podgórski T. 2021. Is a four-week ketogenic diet an effective nutritional strategy in CrossFit-trained female and male athletes? Nutrients. 13(3):864.
- Durkalec-Michalski K, Zawieja EE, Zawieja BE, Jurkowska D, Buchowski MS, Jeszka J. 2018. Effects of ow versus moderate glycemic index diets on aerobic capacity in endurance runners: three-week randomized controlled crossover trial. Nutrients. 10(3):370.
- Durkalec-Michalski K, Zawieja EE, Zawieja BE, Podgórski T, Jurkowska D, Jeszka J. 2018. Influence of low versus moderate glycemic index of diet on substrate oxidation and energy expenditure during incremental exercise in endurance athletes: a randomized counterbalanced cross-over trial. Int J Food Sci Nutr. 69(6):741–752.
- Frey I, Berg A, Grathwohl D, Keul J. 1999. Freiburg Questionnaire of physical activity–development, evaluation and application. Soz Präventivmed. 44(2):55–64.
- Jeukendrup AE. 2004. Carbohydrate intake during exercise and performance. Nutrition. 20(7–8):669–677.
- König D, Zdzieblik D, Holz A, Theis S, Gollhofer A. 2016. Substrate utilization and cycling performance following PalatinoseTM Ingestion: a randomized, double-blind. Control Trial Nutr. 8(7):390.
- Lambert EV, Speechly DP, Dennis SC, Noakes TD. 1994. Enhanced endurance in trained cyclists during moderate intensity exercise following 2 weeks adaptation to a high fat diet. Eur J Appl Physiol. 69(4):287–293.
- Midgley AW, McNaughton LR, Polman R, Marchant D. 2007. Criteria for determination of maximal oxygen uptake: a brief critique and recommendations for future research. Sports Med. 37(12):1019–1028.
- Nilsson LH. 1973. Liver glycogen content in man in the postabsorptive state. Scand J Clin Lab Invest. 32(4):317–323.
- Norman GR, Sloan JA, Wyrwich KW. 2003. Interpretation of changes in health-related quality of life: the remarkable universality of half a standard deviation. Med Care. 41(5):582–592.
- Phinney SD, Bistrian BR, Evans WJ, Gervino E, Blackburn GL. 1983. The human metabolic response to chronic ketosis without caloric restriction: preservation of submaximal exercise capability with reduced carbohydrate oxidation. Metab Clin Exp. 32(8):769–776.
- Riebe D, Franklin BA, Thompson PD, Garber CE, Whitfield GP, Magal M, Pescatello LS. 2015. Updating ACSM’s recommendations for exercise preparticipation health screening. Med Sci Sports Exerc. 47(11):2473–2479.
- Rowlands DS, Hopkins WG. 2002. Effects of high-fat and high-carbohydrate diets on metabolism and performance in cycling. Metab Clin Exp. 51(6):678–690.
- Spriet LL. 2014. New insights into the interaction of carbohydrate and fat metabolism during exercise. Sports Med. 44(S1):87–96.
- Stevenson EJ, Williams C, Mash LE, Phillips B, Nute ML. 2006. Influence of high-carbohydrate mixed meals with different glycemic indexes on substrate utilization during subsequent exercise in women. Am J Clin Nutr. 84(2):354–360.
- Tiller NB, Roberts JD, Beasley L, Chapman S, Pinto JM, Smith L, Wiffin M, Russell M, Sparks SA, Duckworth L, et al. 2019. International Society of Sports Nutrition Position Stand: nutritional considerations for single-stage ultra-marathon training and racing. J Int Soc Sports Nutr. 16(1):50.
- Volek JS, Freidenreich DJ, Saenz C, Kunces LJ, Creighton BC, Bartley JM, Davitt PM, Munoz CX, Anderson JM, Maresh CM, et al. 2016. Metabolic characteristics of keto-adapted ultra-endurance runners. Metabolism. 65(3):100–110.
- Wee S-L, Williams C, Tsintzas K, Boobis L. 2005. Ingestion of a high-glycemic index meal increases muscle glycogen storage at rest but augments its utilization during subsequent exercise. J Appl Physiol (Bethesda, Md.: 1985). 99(2):707–714.
- Wu C-L, Nicholas C, Williams C, Took A, Hardy L. 2003. The influence of high-carbohydrate meals with different glycaemic indices on substrate utilisation during subsequent exercise. Br J Nutr. 90(6):1049–1056.
- Yeo WK, Carey AL, Burke L, Spriet LL, Hawley JA. 2011. Fat adaptation in well-trained athletes: effects on cell metabolism. Appl Physiol Nutr Metab. 36(1):12–22.
- Zajac A, Poprzecki S, Maszczyk A, Czuba M, Michalczyk M, Zydek G. 2014. The effects of a ketogenic diet on exercise metabolism and physical performance in off-road cyclists. Nutrients. 6(7):2493–2508.
- Zdzieblik D, Friesenborg H, Gollhofer A, König D. 2022. Effect of a high fat diet vs. high carbohydrate diets with different glycemic indices on metabolic parameters in male endurance athletes: a pilot trial. Front Nutr. 9
- Zinn C, Wood M, Williden M, Chatterton S, Maunder E. 2017. Ketogenic diet benefits body composition and well-being but not performance in a pilot case study of New Zealand endurance athletes. J Int Soc Sports Nutr. 14:22.
- Zuniga JM, Housh TJ, Camic CL, Bergstrom HC, Traylor DA, Schmidt RJ, Johnson GO. 2012. Metabolic parameters for ramp versus step incremental cycle ergometer tests. Appl Physiol Nutr Metab. 37(6):1110–1117.