
Abstract
Skin photoaging is primarily caused by ultraviolet radiation and can lead to the degradation of skin extracellular matrix components, resulting in hyperpigmentation and skin elasticity loss. In this area, polyphenols have become of great interest because of their antioxidant, anti-inflammatory and antiaging properties. Here, we evaluated the effects of the pomegranate natural extract Pomanox® on skin health-related parameters in normal and UV-induced photoaging conditions in human fibroblast Hs68 cells. Moreover, the inhibitory effects of Pomanox® on tyrosinase activity were assessed. In normal conditions, Pomanox® significantly modulated collagen and hyaluronic acid metabolisms. In UV-exposed cells, both preventive and regenerative treatments with Pomanox® positively modulated hyaluronic acid metabolism and decreased ROS levels. However, only the preventive treatment modulated collagen metabolism. Finally, Pomanox® showed a marked inhibitory capacity of tyrosinase activity (IC50 = 394.7 μg/mL). The modulation of skin health-related parameters exhibited by Pomanox® open a wide range of potential applications of this product.
Introduction
Skin is the largest organ in human body and it is formed by three layers with different structures and functions: the epidermis, the external skin surface; the dermis, the most elastic and thickest layer; and the hypodermis, the inner layer (Farage et al. Citation2007). The dermis is mainly formed by collagen and elastin fibres, which confer the strength and elasticity properties to skin. Moreover, it contains a set of components of the extracellular matrix (ECM), which determine the structural and functional conditions of the skin. Among these ECM components, fibrillary collagen synthesised by fibroblasts is considered one of the most important components related to the mechanical resistance of the skin (Farage et al. Citation2007). The predominant collagen in the dermis layer is type I collagen, which constitutes the 80–90% of the skin’s dry weight (Burrows Citation2005).
Ageing and excessive exposure to UV radiation causes a significant degeneration of ECM, causing an increase in skin fragility and a loss of skin elasticity. This loss of flexibility is due to a greater degradation of collagen by the action of different proteases, mainly metalloproteinases (MMPs) (Jabłońska-Trypuć et al. Citation2016). These MMPs comprise a family of proteolytic enzymes responsible for the degradation of collagen, fibronectin and elastin (Quan et al. Citation2009). Among them, MMP-1 is the most relevant in skin collagen metabolism, since it is the main responsible for cleaving type I collagen (Visse and Nagase Citation2003). Moreover, skin ageing is also characterised by an increase in its dryness as a consequence of the decrease in hyaluronic acid synthesis, an ECM component with the capacity of binding and retaining water molecules (Papakonstantinou et al. Citation2012).
Melanin also plays a key role in skin health, as it is an essential component of the skin’s pigmentation system. Its main function is to prevent cell damage caused by the exposure to UV light. Melanocytes synthesise melanin through a process called melanogenesis, which take place in the melanosome (Bonaventure et al. Citation2013). This process is mainly regulated by melanogenic enzymes, such as tyrosinase, tyrosinase-related protein 1 (TRP 1) and tyrosinase-related protein 2 (TRP 2). Tyrosinase is the responsible to produce melanin through the oxidation of tyrosine substrates in the melanogenesis process (D’Mello et al. Citation2016). Thus, the majority of skin whitening cosmetics include tyrosinase inhibitors in their composition (Pillaiyar et al. Citation2017).
Despite the importance of melanin in the maintenance of an optimal skin health, it has been widely described that during the melanogenesis process there is an accumulation of hydrogen peroxide and other reactive oxygen species (ROS), which can lead to detrimental effects on melanocytes (Denat et al. Citation2014). In addition, ROS can also inhibit collagen synthesis and, consequently, produce negative effects on skin health (Rinnerthaler et al. Citation2015).
For these reasons, food and cosmetic industries are developing new strategies in order to establish new links between nutrient consumption and skin health. In this area, (poly)phenols have received a lot of attention due to their antioxidant (Pandey and Rizvi Citation2009), anti-inflammatory (Hussain et al. Citation2016) and anti-ageing properties (Luo et al. Citation2021). Several studies have described that (poly)phenol-rich pomegranate fruit extracts, mainly composed by flavonoids, ellagitannins and ellagic acid derivatives (Ko et al. Citation2021), have beneficial properties for skin health. Kang and collaborators determined that a pomegranate extract decreased melanin production through the inhibition of tyrosinase activity in vitro and increased skin moisture by stimulating hyaluronic acid synthesis in in vivo models (Kang et al. Citation2015 2017). Other studies demonstrated that several (poly)phenol-rich pomegranate extracts can attenuate ROS production in human fibroblasts exposed to UV radiation (Yoshimura et al. Citation2005; Fawole et al. Citation2012).
Among the different models to evaluate the effects of bioactive compounds in skin health at an initial stage, in vitro models are considered the optimal option, as they allow to avoid the use of laboratory animals and human biopsies. These in vitro models are used as a first approach, as the interaction of bioactive compounds with hormones, nutrients and other environmental factors is avoided.
The hypothesis of the present study was that the commercial pomegranate extract Pomanox® could exert beneficial effects on different parameters associated with skin health. Therefore, the main objective of this study was to determine the positive effects of Pomanox® in the maintenance of an optimal skin health by using in vitro models.
Materials and methods
Pomegranate natural extract (Punica granatum L.)
The natural concentrated extract of whole pomegranate (Pomanox®), obtained through a water-based extraction process, was provided by Euromed (Barcelona, Spain). According to the manufacturer, Pomanox®P30 is standardised to >50% total (poly)phenols and punicalagins α + β ≥ 30% p/p and contains α-punicalagin and β-punicalagin (174.4 g/kg and 206.8 g/kg, respectively), galloylglucose, punicalin, ellagic acid (7.3 g/kg), ellagic acid glucoside (4.2 g/kg), ellagic acid rhamnoside (1.3 g/kg); and the anthocyanins delphinidin-3,5-diglucoside (302.9 mg/kg), cyanidin-3,5-diglucoside (425.3 mg/kg), delphinidin-3-glucoside (75.7 mg/kg), cyanidin-3-glucoside (241.8 mg/kg) and pelargonidin-3-glucoside (99.5 mg/kg). Phenolic compounds were quantified by high-performance liquid chromatography time-of-flight mass spectrometry (HPLC-TOF-MS).
Maintenance of Hs68 cells
The cell line used in this assay was the human foreskin fibroblasts Hs68 line (ATCC® CRL-1635™). Cells were maintained in DMEM High Glucose (ATCC 20-2002) supplemented with 10% FBS and Penicillin/Streptomycin at 37 °C and 5% CO2. Cells were subcultured every 3–4 days, when cell density achieved the 80–90% of the growth surface.
Cell viability determination
Cell viability was analysed by an MTT assay (3-(4,5-dimethyl-thiazol-2-yl)-2,5-diphenyl-tetrazolium bromide). In a 96-well plate, 10,000 cells were cultivated per well in 100 µL 24 h before the treatment, allowing their adherence to the bottom of the well. For the preparation of the treatments, a 5 mg/mL Pomanox® stock solution was prepared in treatment medium (DMEM High Glucose supplemented with 0.2% BSA and Penicilin/Streptomycin). After adjusting pH to 7.2, Pomanox® stock solution was sterilised by filtration with a 0.22 µM filter. The different concentrations of Pomanox® were prepared by using the filtered stock solution. Cell medium was aspirated and incubated with 100 µL of the corresponding treatment for 24 h at 37 °C and 5% CO2. After 24 h, treatments were aspirated, cells were washed with DMEM medium and incubated with 100 µL of DMEM medium with 1 mg/mL of MTT for 2 h at 37 °C and 5% CO2. The MTT medium was aspirated and the formazan precipitate was resuspended in 100 µL of isopropanol. The absorbance was read at 570 nm and 650 nm as reference. The viability values of the different treatments are expressed as a relative percentage to the vehicle-treated cells.
Determination of skin health-associated parameters in normal conditions
For the determination of pro-collagen type I, total collagen, matrix metalloproteinase-1 (MMP-1) and hyaluronic acid levels, Hs68 cells were cultivated in 12-well plates at a density of 50,000 cells/well in 1 mL of medium, 72 h before the treatment. The different treatments were prepared as previously described and cells were treated with 1 mL of treatment medium for 24 h. At the end of the treatment, culture mediums of each treatment were collected for the different determinations. In addition, cells were washed twice with phosphate-buffered saline (PBS) and cell fractions were collected according to the instructions of each detection kit. The detection kits used in this study were Human Pro-Collagen I alpha 1 SimpleStep ELISA® Kit (Abcam, England, UK) for pro-collagen type I; Sirius Red Collagen Detection Kit (Chondrex, Washington, USA) for total collagen; Human MMP1 ELISA Kit (Abcam, England, UK) for MMP1; and Hyaluronan Immunoassay (R&D Systems, Minneapolis, USA) for hyaluronic acid.
Preventive and regenerative assays in Hs68 cells exposed to UV radiation
In the preventive assay, Hs68 cells were cultivated in both 12-well plates at a density of 50,000 cell/well (skin health-associated parameters determination) and 96-well plates at a density of 5,000 cells/well (ROS and MTT determination), 72 h before the treatment. The different treatments were prepared as previously described and cells were treated with 1 mL (12-well plates) and 100 µL (96-well plates) of treatment for 24 h. After 24 h, treatments were aspirated and cells were washed and incubated with DMEM medium. Except for the plate which contained the UV non-exposed cells, Hs68 cell plates were exposed to UV-B radiation (60 mJ/cm2) (Analytik Jena, Jena, Germany). After 1 h of incubation, cell viability (MTT) and ROS levels were determined. Culture mediums and cell fractions were collected after 6 h of incubation for the determination of pro-collagen I, hyaluronic acid and MMP-1, and after 24 h of incubation for the determination of total collagen. For the determination of ROS, DMEM medium was aspirated and cells were incubated for 30 min with 100 µL of the DCFH-DA reagent at 37 °C and 5% CO2. Then, the DMEM medium was aspirated and cells were washed and incubated with PBS. The fluorescence was measured by a fluorimeter (Excitation 485/Emission 530) (BMG Labtech, Ortenberg, Germany). In the regenerative assay, Hs68 cells were distributed in different plates as previously described in the preventive assay. Firstly, cells were covered with PBS and exposed to UV-B radiation (60 mJ/cm2). After UV-B exposition, treatments were prepared as previously described and cells were treated with 1 mL (12-well plates) and 100 µL (96-well plates) of treatment for 24 h. After 24 h, cell viability (MTT) and ROS levels were determined, and culture mediums and cell fractions were collected for the determination of skin-health associated parameters.
In both assays, N-acetylcysteine (NAC) was added in the 96-well plate as a positive control of ROS inhibition at three different doses (1, 5 and 10 mM).
Determination of the inhibitory effects of Pomanox® on tyrosinase activity
To determine the inhibitory effects of the pomegranate extract tyrosinase activity, a tyrosinase inhibitor screening colorimetric assay (Abcam, England, UK) was performed. Kojic acid (Abcam, England, UK) was used as inhibitory control.
Pomanox® and the inhibitory control were dissolved in milli-Q water due to the high solubility of both products. Preliminary tests were performed with both products in order to determine the necessary concentration ranges to inhibit at least the 50% of tyrosinase activity. Once determined, the tyrosinase activity inhibition test was performed. Each product was tested in the previously established range of concentrations, obtaining a relative percentage of inhibition for each concentration of each tested product. In both preliminary and final tests, all samples were analysed in duplicate and performed by using a SPECTROstar Nano absorbance microplate reader (BMG Labtech, Ortenberg, Germany). The different readings were performed at an optical density of 510 nm every 2 min for a total of an hour, at a temperature of 25 °C.
The IC50 index (half maximal inhibitory concentration) was determined for both product and inhibitory control. In this analysis, inverse concentrations of each compound and inverse inhibition percentages were calculated. IC50 values were calculated from the obtained equation.
Statistical analysis
All the data are expressed as mean ± standard error of the mean (SEM). One-way ANOVA analysis followed by Duncan post-hoc test was performed in order to analyse differences among treatments. Student’s t-test was used for single statistical comparisons. The level of statistical significance was set at bilateral 5% (p < 0.05). p < 0.1 were considered a trend to statistical significance. All statistical analyzes were performed with the SPSS Statistics 22 software (SPSS, Inc., Chicago, IL, United States).
Results
Determination of Pomanox® optimal concentrations for the Hs68 cells in vitro study
In order to determine the three concentrations of Pomanox® to be tested in the human fibroblasts Hs68 cell line (low, medium and high), a cell viability assay (MTT) was performed.
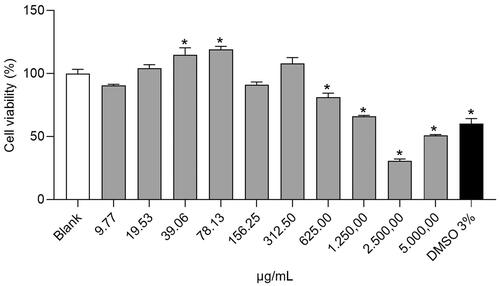
As shown in , cells treated with Pomanox® at concentrations between 19.53 and 78.13 µg/mL showed an increase in cell viability in comparison with the untreated cells (blank), being statistically significant at the doses of 39.06 and 78.13 µg/mL. In contrast, higher doses than 312.5 µg/mL induced a decrease in cell viability, indicating a clear toxicity of Pomanox® in this concentration range. Taking into consideration the decrease in cell viability observed in the 156.25 µg/mL treatment compared to the 78.13 µg/mL treatment, this last dose was selected as the highest concentration treatment in this study. Consequently, the three selected Pomanox® concentrations to carry out the different treatments in this study were 20, 40 and 80 µg/mL as low, medium and high doses, respectively (POM20, POM40 and POM80).
Figure 1. Cell viability percentages in human fibroblasts Hs68 cells. Data are expressed as mean ± SEM (n = 3). The results are expressed as a percentage relative to the average of the Blank group (100%). *Student’s t-test, p < 0.05 vs. blank.
Effects of Pomanox® on skin health-related parameters in normal conditions
Pro-collagen type I levels
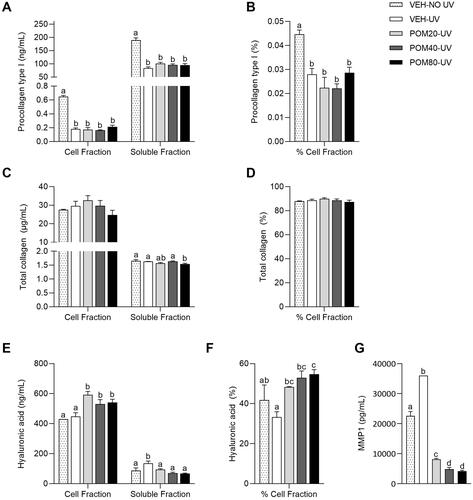
As shown in , the different treatments with Pomanox® induced a different effect on pro-collagen type I levels in the cell and soluble fractions. On the one hand, Pomanox® significantly increased pro-collagen type I levels in the cell fraction when it was administered in its low dose (20 µg/mL) in comparison with the untreated cells (p = 0.002, Student’s t test). No changes were observed after the treatment with higher doses (). On the contrary, in the determination of pro-collagen type I levels in the soluble fraction, a clear dose-dependent effect of Pomanox® was observed, showing a reduction of pro-collagen type I levels as Pomanox® concentration was increased. Thus, cells treated with this pomegranate extract exhibited a decrease of 81.7%, 93.7% and 97% at doses of 20, 40 and 80 µg/mL, respectively, in comparison with the untreated cells ().
Figure 2. Pro-collagen type I levels in the cell and soluble fractions (A) and percentage of pro-collagen type I in the cell fraction relative to the total quantified (B), total collagen levels in the cell and soluble fractions (C) and percentage of total collagen in the cell fraction (D), hyaluronic acid levels in the cell and soluble fractions (E) and percentage of hyaluronic acid in the cell fraction (F) and MMP-1 levels in the soluble fraction (G) in human fibroblasts Hs68. Data are expressed as mean ± SEM (n = 3). abcMean values represented with different letters are significantly different from each other (One-way ANOVA, Duncan post-hoc, p < 0.05).
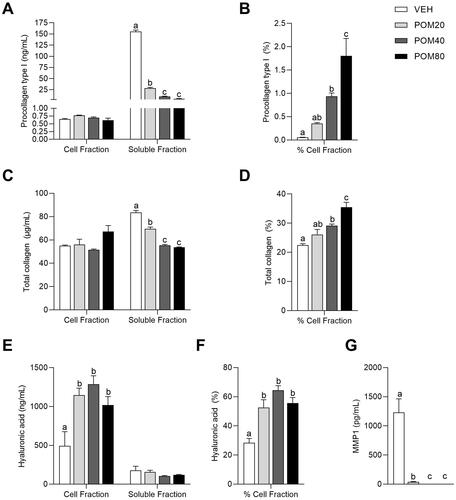
In order to determine the effects of Pomanox® on the modulation of pro-collagen type I location, the percentage of this protein in the cell fraction relative to the total quantified (sum of both cell and soluble fractions) was calculated. Despite the fact that pro-collagen type I levels in the soluble fraction were higher than in the cell fraction, Pomanox® treatment stimulated a clear dose-response effect on the percentage of pro-collagen type I levels in the cell fraction, inducing an increase of 600%, 1760% and 3500% at doses of 20, 40 and 80 µg/mL, respectively, compared to the untreated cells ().
Total collagen levels
Firstly, POM80 induced a trend towards an increase in total collagen in the cell fraction in comparison with the untreated cells (p = 0.076, Student’s t test) (). On the other hand, total collagen levels in the soluble fraction were significantly decreased in cells treated with Pomanox®, specially in its medium and highest doses (POM40 and POM80) (). Finally, Pomanox® treatment significantly increased the percentage of total collagen in the cell fraction relative to the total quantified, showing a significant increase at POM40 and POM80 compared to the untreated cells (29.6% and 57.8%, respectively) ().
Hyaluronic acid levels
The analysis of hyaluronic acid levels showed that all three doses of Pomanox® induced a similar increase in their levels, being the medium dose (40 µg/mL) the one that showed a numerically higher increase in hyaluronic acid in the cell fraction (). On the contrary, Pomanox® slightly decreased the levels of this polysaccharide in the soluble fraction, although these differences were not statistically significant ().
Taking into account that hyaluronic acid levels were much higher in the cell fraction than in the soluble fraction, the determination of the percentage of hyaluronic acid in the cell fraction relative to the total quantified showed a significant increase in hyaluronic acid levels in Pomanox®-treated cells in comparison to the untreated cells ().
MMP-1 levels
As shown in , Pomanox®-treated cells showed a drastic decrease in MMP-1 levels in the cell culture medium in comparison with the untreated cells. While POM20 induced a 96.9% decrease in MMP-1 levels, both POM40 and POM80 provoked a decrease in these proteins below the detection limit (<24.7 pg/mL).
Preventive effects of Pomanox® on skin health-related parameters in UV-exposed Hs68 cells
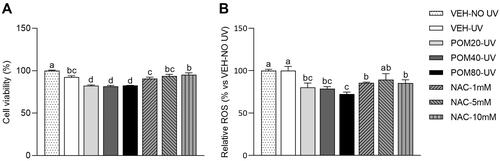
Cell viability and ROS levels
Firstly, as shown in , the MTT analysis showed that most of the groups exposed to UV radiation displayed a slight decrease in the percentage of cell viability in comparison with cells that were not exposed to UV (VEH-NO UV). In this sense, UV-exposed cells treated with the different doses of Pomanox® exhibited similar levels than those that were not treated. Thus, the product Pomanox® was not able to inhibit the slight decrease in cell viability induced by the exposition to UV radiation.
Figure 3. Cell viability percentages (A) and relative ROS levels (B) in human fibroblasts Hs68 cells obtained in the preventive assay. Data are expressed as mean ± SEM (n = 3). The results are expressed as a percentage relative to the average of the VEH-NO UV group (100%). abcMean values represented with different letters are significantly different from each other (One-way ANOVA, Duncan post-hoc, p < 0.05).
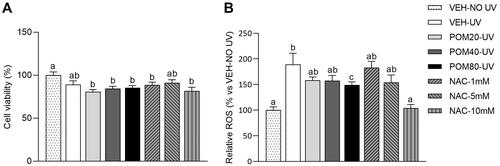
Regarding the analysis of ROS levels, as shown in , non-treated cells exposed to UV light exhibited a sharp increase in ROS levels compared to non-exposed cells (89.3% higher). Interestingly, cells treated with POM80-UV exhibited a significant decrease in ROS levels in comparison with VEH-UV group, while POM20-UV and POM40-UV only showed a non-significant decrease. As expected, NAC treatment at 10 mM induced a sharp decrease in ROS levels, showing similar levels than the VEH-NO UV group.
Pro-collagen type I levels
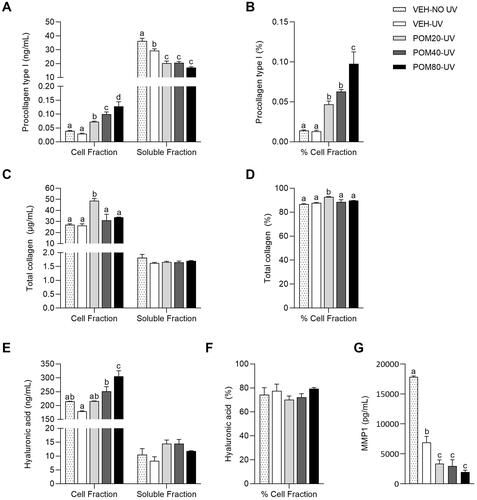
UV radiation did not induce a reduction of pro-collagen type I levels in the cell fraction. However, it decreased the levels of this protein in the soluble fraction (). In this preventive study, Pomanox® stimulated a different response in pro-collagen type I levels in the cell and soluble fractions. Interestingly, Pomanox® displayed a significant dose-response effect, increasing its levels in the cell fraction, being POM80-UV the one that presented the greatest effect (336.9% higher in comparison with VEH UV) (). Moreover, Pomanox® significantly decreased pro-collagen type I levels in the soluble fraction, independently of the dose received (). The analysis of the percentage of pro-collagen type I in the cell fraction relative to the total quantified showed that despite the fact that UV radiation did not alter the location of this protein in comparison with the non-exposed cells, the treatment with Pomanox® increased the percentage of pro-collagen type I levels in the cell fraction in a dose-response way ().
Figure 4. Pro-collagen type I levels in the cell and soluble fractions (A) and percentage of pro-collagen type I in the cell fraction relative to the total quantified (B), total collagen levels in the cell and soluble fractions (C) and percentage of total collagen in the cell fraction (D), hyaluronic acid levels in the cell and soluble fractions (E) and percentage of hyaluronic acid in the cell fraction (F) and MMP-1 levels in the soluble fraction (G) in human fibroblasts Hs68 cells obtained in the preventive assay. Data are expressed as mean ± SEM (n = 3). abcdMean values represented with different letters are significantly different from each other (One-way ANOVA, Duncan post-hoc, p < 0.05).
Total collagen levels
As shown in , no differences were reported regarding total collagen levels between VEH-NO UV and VEH-UV groups in both cell and soluble fractions. Surprisingly, only the preventive treatment with POM20-UV induced a significant increase in total collagen levels in the cell fraction (85% higher than the VEH-UV group). While no differences were observed in the levels of this protein in the soluble fraction, the percentage of total collagen levels in the cell fraction was only increased by POM20-UV in comparison with the rest of the groups ().
Hyaluronic acid levels
As shown in , non-treated cells exposed to UV light showed a slight decrease in hyaluronic acid levels in both cell and soluble fractions in comparison with the non-exposed cells, although this difference was not significant. Interestingly, Pomanox® treatment not only prevented the UV-induced decrease in hyaluronic acid in the cell fraction, but also induced a sharp increase in this polysaccharide levels in a dose-response manner, showing higher levels than the non-exposed cells at the highest dose (). Differently, hyaluronic acid levels in the soluble fraction () and the percentage of hyaluronic acid in the cell fraction () did not show any differences among groups.
MMP-1 levels
As shown in , the VEH-NO UV group displayed higher levels of MMP-1 than the VEH-UV group. However, Pomanox® induced a significant reduction of MMP-1 levels in its three different doses, being POM80-UV the one that exhibited the highest effect (71.7% lower than the VEH-UV group).
Regenerative effects of pomanox® on skin health-related parameters in UV-exposed Hs68 cells
Cell viability and ROS levels
Firstly, the determination of cell viability showed that all the groups exposed to UV radiation displayed a significant decrease in the percentage of cell viability (). In this case, Pomanox® treatments caused a slight decrease in this parameter in comparison with the VEH-UV group.
Figure 5. Cell viability percentages (A) and relative ROS levels (B) in human fibroblasts Hs68 cells obtained in the regenerative assay. Data are expressed as mean ± SEM (n = 3). The results are expressed as a percentage relative to the average of the VEH-NO UV group (100%). abcdMean values represented with different letters are significantly different from each other (One-way ANOVA, Duncan post-hoc, p < 0.05).
Regarding the analysis of ROS levels, VEH-UV cells did not exhibit a significant increase in ROS levels in comparison with the cells that were not exposed to UV (). However, cells treated with all three doses of Pomanox® displayed a significant decrease in ROS levels in comparison with the VEH-UV group, being POM80-UV the one that induced the greatest decrease (27.6% lower than VEH-UV). Once again, the ROS inhibitor NAC displayed a significant inhibition of ROS production, specially at the concentrations of 1 mM and 10 mM.
Pro-collagen type I levels
As shown in , Hs68 cells exposed to UV radiation exhibited a sharp decrease in pro-collagen type I levels in both cell and soluble fractions. Indeed, all the UV-exposed groups showed similar levels of this protein in the cell fraction (65–75% lower in comparison with the VEH-NO UV group) and in the soluble fraction (46–56% lower in comparison with the VEH-NO UV group) (). Similar results were obtained in the percentage of pro-collagen type I in the cell fraction, being decreased by UV exposure in all groups, independently of the treatment received ().
Figure 6. Pro-collagen type I levels in the cell and soluble fractions (A) and percentage of pro-collagen type I in the cell fraction relative to the total quantified (B), total collagen levels in the cell and soluble fractions (C) and percentage of total collagen in the cell fraction (D), hyaluronic acid levels in the cell and soluble fractions (E) and percentage of hyaluronic acid in the cell fraction (F) and MMP-1 levels in the soluble fraction (G) in human fibroblasts Hs68 cells obtained in the regenerative assay. Data are expressed as mean ± SEM (n = 3). abcdMean values represented with different letters are significantly different from each other (One-way ANOVA, Duncan post-hoc, p < 0.05).
Total collagen levels
Differently from what was obtained in the analysis of pro-collagen type I levels, no differences were reported in the quantification of total collagen levels in the cell fraction (). In this analysis, a slight increase in total collagen levels in the cell fraction was observed in those cells treated with POM20-UV, although this difference was not significant. Despite the fact that the treatment with Pomanox® slightly diminished the levels of total collagen in the soluble fraction in comparison with the VEH-UV group (), the quantification of the percentage of total collagen in the cell fraction did not show significant differences among groups ().
Hyaluronic acid levels
No differences were reported in hyaluronic acid levels in the cell fraction between the VEH-NO UV and the VEH-UV group (). However, cells treated with the three concentrations of Pomanox® exhibited a significant increase in hyaluronic acid levels in the cell fraction, showing a similar effect among doses. Differently, the exposure to UV light significantly increased the levels of hyaluronic acid in the soluble fraction of non-treated cells in comparison with the VEH-NO UV group (). In this case, Pomanox® induced a significant decrease in the levels of this polysaccharide in the soluble fraction compared to the VEH-UV group, exhibiting a significant dose-response effect and showing similar hyaluronic acid levels than those observed in the non-exposed cells.
Finally, the calculation of the percentage of hyaluronic acid in the cell fraction showed that the three doses of Pomanox® were able to revert the decrease in this polysaccharide levels induced by the exposure to UV light, showing a significant dose-response effect in which POM80-UV exhibited a 64.2% increase in comparison with the non-treated cells exposed to UV light ().
MMP-1 levels
The analysis of MMP-1 levels in the regenerative assay showed that the exposition to UV light induced a vast increase in MMP-1 levels in the culture medium of non-treated cells in comparison with VEH-NO UV cells (). On the other hand, Pomanox® induced a clear dose-response effect, significantly decreasing the levels of MMP-1 in the soluble fraction of UV-exposed cells compared to the VEH-UV group (more than a 77%, 86% and 88% decrease in the low, medium and high doses, respectively). In addition, cells treated with Pomanox® displayed lower levels of MMP-1 than the VEH-NO UV group.
Determination of the inhibitory effects of Pomanox® on tyrosinase activity
As shown in , kojic acid showed a high relative percentage of tyrosinase activity inhibition at low concentrations, exhibiting an 85.5% inhibition at a concentration of 355 μg/mL. The IC50 index of this compound was 149.4 μg/mL.
Table 1. Kojic acid and Pomanox® inhibitory percentage of tyrosinase activity and IC50 index.
The punicalagin-rich pomegranate extract Pomanox® exhibited a significant inhibitory effect on tyrosinase activity at low concentrations but lower than that of kojic acid, showing a relative percentage of inhibition of 55.7% at a concentration of 590 μg/mL. The IC50 index of this product was 394.7 μg/mL.
Discussion
In the present study, we highlighted the capacity of the pomegranate natural extract Pomanox® to modulate several skin health-associated parameters in both normal and photoaging conditions. This modulation was significant in specific ECM components, such as collagen, not only increasing the concentration of total collagen and its precursor pro-collagen type I, but also inhibiting the main inhibitor of collagen synthesis, MMP-1.
Pro-collagen type I is the initial product in the collagen synthesis process, being considered a robust marker of the modulation of this protein metabolism (Canty and Kadler Citation2005). Pro-collagen is synthesised inside the cell and it is characterised by containing pro-peptides at the N- and C- terminal ends, which prevent the assembly of collagen inside the cell (Mienaltowski and Birk Citation2014). For this reason, pro-collagen is secreted into vesicles outside the cell. There, through the action of proteases, pro-peptides are separated from both terminal ends, forming collagen, which is assembled in the ECM (Vollmer et al. Citation2018).
The different effects reported in Pomanox®-treated cells regarding pro-collagen type I levels in the cell and soluble fractions, could indicate a stimulation of the synthesis of this protein inside the cell by the tested product. Moreover, these results were translated into significant changes of total collagen levels. Therefore, the results obtained indicate that Pomanox® modulates collagen metabolism, increasing its presence in the ECM and, consequently, decreasing the levels of collagen in the cell culture medium. Taking into account the stimulation of the percentage of pro-collagen type I levels in the cell fraction in Pomanox®-treated cells, these results would indicate that this natural extract stimulates collagen synthesis and, consequently, a greater assembly of this protein in the ECM, where this protein develops its main function of conferring resistance, impermeability and elasticity to the skin (Avila Rodríguez et al. Citation2018). The reported inhibition of MMP-1 levels in Pomanox®-treated cells at reduced doses suggests that the significant decrease in MMP-1 levels could be a clear mechanism of action through which Pomanox® modulates collagen metabolism. Previous studies have described a significant decrease in MMP-1 levels in the skin of UV-exposed animals treated with a pomegranate juice concentrate (S. J. Kang et al. Citation2017), as well as in the total levels of MMP-1 in human dermal fibroblasts treated with a pomegranate peel extract.
Hyaluronic acid is another main component of the ECM. This protein is mainly found in the skin and its main function is to maintain the hydration of this organ, due to its great capacity to retain water. Moreover, it plays a key role in cell proliferation and morphogenesis processes. Its synthesis takes place in the inner surface of the plasmatic membrane and once synthesised, it is extracted into the ECM through porous structures (Papakonstantinou et al. Citation2012). In the present study, the differential response in both cell and soluble fractions induced by Pomanox® treatment, showing a significant increase in hyaluronic acid levels in the cell fraction and a slight decrease in its levels in the soluble fraction, suggest that Pomanox® is able to modulate hyaluronic acid metabolism, increasing its levels in the ECM. Similar results were obtained by Kang and collaborators, who showed that mice supplemented with a pomegranate concentrated solution exhibited an increase in hyaluronic acid levels in the dorsal skin and a stimulation of the expression of genes related to the synthesis of this polysaccharide (S.-J. Kang et al. Citation2016).
It is widely described that exposure to UV radiation generates ROS, which is considered one of the main mechanisms through which UV light can manifest its negative effects on health (de Jager et al. Citation2017). In this assay, we reported a significant decrease in ROS levels in cells exposed to UV-B and preventively treated with the highest dose of Pomanox®, suggesting a protective effect of Pomanox® on UV-induced oxidative damage. Similar results were observed by Pacheco-Palencia and collaborators (Pacheco-Palencia et al. Citation2008), who showed that a pomegranate (poly)phenolic extract induced a reduction of ROS levels in human skin fibroblasts exposed to UV light.
One of the main processes in UV-induced skin photoaging is the degradation of collagen in the extracellular matrix (Pandel et al. Citation2013). The results of the preventive treatment with Pomanox® suggest that it presents a significant modulation of collagen metabolism in UV-exposed cells, evidenced by the dose-response increase in pro-collagen type I in the cell fraction and the significant increase in total collagen levels in the cell fraction of Hs68 treated with the lowest dose of Pomanox®. The fact that Pomanox® stimulated the percentage of both pro-collagen type I and total collagen levels in the cell fraction of Hs68 cells, indicated that the preventive treatment of this product stimulated collagen metabolism in UV exposure conditions.
In the analysis of MMP-1 levels, we reported that VEH-NO UV group displayed higher levels of MMP-1 than the VEH-UV group. These results were not expected, as it is widely described that UV exposure stimulates the levels of MMP-1 (Pacheco-Palencia et al. Citation2008; Afaq et al. Citation2009) in the culture medium. However, the preventive effects of Pomanox® on inhibiting the increase in MMP-1 levels as a consequence of UV exposure were similar to those described in previous studies (Afaq et al. Citation2009), in which the pre-treatment of human reconstituted skin with several pomegranate derived products decreased UV-induced MMP-1 levels.
Hyaluronic acid metabolism has been described to be altered in UV-induced skin photoaging (Papakonstantinou et al. Citation2012). Interestingly, Pomanox® treatment not only prevented the UV-induced decrease in hyaluronic acid in the cell fraction, but also induced a severe increase in this polysaccharide levels in a dose-response manner. These results suggest that Pomanox® promotes the retention of hyaluronic acid in the cell fraction under UV exposition. Similar results were also reported by Kang and collaborators (Kang et al. Citation2017), who described that the decrease in hyaluronic acid content in UV-exposed mice skin was inhibited by a pomegranate juice concentrated powder.
Taking into consideration all the results obtained in the preventive assay, we can conclude that the preventive treatment with Pomanox® was able to modulate both collagen and hyaluronic acid metabolisms and also to inhibit the production of ROS in UV-induced photoaging conditions.
Finally, we evaluated the capacity of Pomanox® in reverting the detrimental effects induced by UV light exposure in Hs68 cells, by treating them with three doses of this product during 24 h after being exposed to UV-B light. Differently from what was obtained in the preventive assay, VEH-UV cells did not exhibit a significant increase in ROS levels in comparison with the cells that were not exposed to UV. A possible explanation of the lack of differences between both groups could be that in the regenerative assay, ROS levels were quantified 24 h after the exposition to UV light. During this period, Hs68 cells could have stabilised the levels of ROS in order to maintain a correct homeostasis and ensure its survival. However, cells treated with all three doses of Pomanox® displayed a significant decrease in ROS levels, being the highest dose the one with the strongest effect.
Surprisingly, despite the fact that Pomanox® did not modulate collagen metabolism in the regenerative assay, the analysis of MMP-1 levels showed interesting results. In this analysis, Pomanox® not only was capable of reverting the stimulation of MMP-1 levels induced by UV radiation in a dose-manner, but also significantly diminished the levels of this protein to levels that were lower than non-UV exposed cells. Thus, it can be hypothesised that MMP-1 inhibition prompted by Pomanox® was not enough to compensate the lack of stimulation of collagen expression by this product in UV-exposure conditions.
We reported a significant increase in hyaluronic acid levels induced by all three doses of Pomanox® in the cell fraction and a dose-response reduction of its levels in the soluble fraction of Hs68 cells in the regenerative assay. These results, which are similar to those obtained in the preventive assay regarding the effects of Pomanox®, reinforce the hypothesis that this natural extract can modulate hyaluronic acid metabolism, reverting the widely described alterations that UV exposure induces to the metabolism of this polysaccharide (Dai et al. Citation2007).
Considering all the results obtained in the regenerative assay, we can conclude that the treatment of UV-exposed Hs68 cells with Pomanox® is able to revert ROS production and the inhibition of hyaluronic acid synthesis in UV-induced photoaging conditions.
Type I collagen is the most studied collagen, and it is the major form found in the ECM of connective tissues (Gelse et al. Citation2003). In fact, osteoporotic bone fragility is mainly associated with bone collagen abnormalities, as it is widely described that collagen fibres confer the ductility and toughness to bones, preventing its fracture (Viguet-Carrin et al. Citation2006). For this reason, the study of the capacity of Pomanox® in the prevention and modulation of bone collagen degradation and metabolism, respectively, would also be of high interest in specific vulnerable groups, such as elderly or menopausal population. Indeed, previous in vitro and in vivo studies described that a pomegranate peel extract significantly prevented the decrease in bone mineral density and bone microarchitecture impairment in mice and stimulated the expression of collagen in an osteoblastic cell line (Spilmont et al. Citation2015).
Finally, an excessive exposure to UV radiation prompts melanin production through the melanogenesis process, which is mainly regulated by melanogenic enzymes such as tyrosinase (Chen et al. Citation2014). In the present study, we reported that the IC50 of this natural extract was 394.7 µg/mL, obtaining a lower IC50 value than that described by Yoshimura and collaborators (Yoshimura et al. Citation2005) in a pomegranate extract rich in ellagic acid (182.2 µg/mL). Although these results are far from the values registered from kojic acid (149 µg/mL) and other commercial tyrosinase inhibitors, such as arbutin (Boo Citation2021), Pomanox® ability to inhibit tyrosinase activity is comparable to the one showed by several natural tyrosinase inhibitors found in bibliography, mainly simple phenols and polyphenols (Zolghadri et al. Citation2019). Pomegranate is a rich source of phenolic compounds including ellagitannins, such as ellagic acid and punicalagin, among other (poly)phenols (Chaudhari et al. Citation2013). Both compounds are described to be able to inhibit the synthesis of melanin (Ortiz-Ruiz et al. Citation2016), suggesting that these polyphenols could be the main drivers for tyrosinase activity inhibition in the Pomanox® natural extract.
Conclusions
The results described in this report highlight the strong properties of Pomanox® in the modulation of several skin health-associated parameters, such as collagen, in both normal and photoaging conditions. Therefore, Pomanox® has a great potential as a link between nutrient consumption and skin health in humans.
To sum up, taking into consideration the relevance of collagen in several tissues in addition to skin, such as tendons, ligaments and bones, the modulation of collagen metabolism and other ECM components displayed by Pomanox®, open a wide range of potential applications of this product, mainly targeting elderly population, which is characterised by a systematic variation of the rates of biosynthesis and degradation of the connective tissue composition.
Author contributions
Writing—original draft preparation, R.M-C.; Writing—review and editing, R.M-C., J.T., A.C., J.B.; Supervision, R.M-C., J.T. and J.M.B.; Visualisation, R.M-C., J.T., Y.T., A.C., A.V., A.Z., A.M., J.B. All authors have read and agreed to the published version of the manuscript.
Acknowledgements
We gratefully acknowledge the help of Iris Triguero, Anna Antolin, Cristina Egea and Gertruda Chomiciute laboratory technicians at the Nutrition and Health Unit (Eurecat, Reus, Spain).
Disclosure statement
The authors declare no conflict of interest. The funders had no role in the design of the study, in the collection, analyses, or interpretation of data, in the writing of the manuscript, and in the decision to publish the results.
Data availability statement
The data presented in this study are available on request from the corresponding author.
Additional information
Funding
References
- Afaq F, Zaid MA, Khan N, Dreher M, Mukhtar H. 2009. Protective effect of pomegranate-derived products on UVB-mediated damage in human reconstituted skin. Exp Dermatol. 18(6):553–561.
- Avila Rodríguez MI, Rodríguez Barroso LG, Sánchez ML. 2018. Collagen: a review on its sources and potential cosmetic applications. J Cosmet Dermatol. 17(1):20–26.
- Bonaventure J, Domingues MJ, Larue L. 2013. Cellular and molecular mechanisms controlling the migration of melanocytes and melanoma cells. Pigment Cell Melanoma Res. 26(3):316–325.
- Boo YC. 2021. Arbutin as a skin depigmenting agent with antimelanogenic and antioxidant properties. Antioxidants. 10(7):1129.
- Burrows NP. 2005. Inherited diseases of collagen, elastin and keratin. Medicine. 33(1):83–86.
- Canty EG, Kadler KE. 2005. Procollagen trafficking, processing and fibrillogenesis. J Cell Sci. 118(Pt 7):1341–1353.
- Chaudhari SM, Patel KY, Badole SL. 2013. Punica granatum (Pomegranate Fruit): in cancer treatment. Polyphenol Human Health Disease. 2:1393–1400.
- Chen H, Weng QY, Fisher DE. 2014. UV signaling pathways within the skin. J Invest Dermatol. 134(8):2080–2085.
- D’Mello SAN, Finlay GJ, Baguley BC, Askarian-Amiri ME. 2016. Signaling pathways in melanogenesis. Int J Mol Sci. 17(7):1144.
- Dai G, Freudenberger T, Zipper P, Melchior A, Grether-Beck S, Rabausch B, De Groot J, Twarock S, Hanenberg H, Homey B, et al. 2007. Chronic ultraviolet B irradiation causes loss of hyaluronic acid from mouse dermis because of down-regulation of hyaluronic acid synthases. Am J Pathol. 171(5):1451–1461.
- de Jager TL, Cockrell AE, Du Plessis SS. 2017. Ultraviolet light induced generation of reactive oxygen species. Adv Exp Med Biol. 996:15–23.
- Denat L, Kadekaro AL, Marrot L, Leachman SA, Abdel-Malek ZA. 2014. Melanocytes as instigators and victims of oxidative stress. J Invest Dermatol. 134(6):1512–1518.
- Farage MA, Miller KW, Elsner P, Maibach HI. 2007. Structural characteristics of the aging skin: a review. Cutan Ocul Toxicol. 26(4):343–357.
- Fawole OA, Makunga NP, Opara UL. 2012. Antibacterial, antioxidant and tyrosinase-inhibition activities of pomegranate fruit peel methanolic extract. BMC Complement Altern Med. 12:200.
- Gelse K, Pöschl E, Aigner T. 2003. Collagens – structure, function, and biosynthesis. Adv Drug Deliv Rev. 55(12):1531–1546.
- Hussain T, Tan B, Yin Y, Blachier F, Tossou MCB, Rahu N. 2016. Oxidative stress and inflammation: What polyphenols can do for us? Oxid Med Cell Longev. 2016:7432797.
- Jabłońska-Trypuć A, Matejczyk M, Rosochacki S. 2016. Matrix metalloproteinases (MMPs), the main extracellular matrix (ECM) enzymes in collagen degradation, as a target for anticancer drugs. J Enzyme Inhib Med Chem. 31(sup1):177–183.
- Kang SJ, Choi BR, Kim SH, Yi HY, Park HR, Song CH, Ku SK, Lee YJ. 2017. Beneficial effects of dried pomegranate juice concentrated powder on ultraviolet B-induced skin photoaging in hairless mice. Exp Ther Med. 14(2):1023–1036.
- Kang S-J, Choi B-R, Kim S-H, Yi H-Y, Park H-R, Sung M-S, Song C-H, Cho I-J, Lee Y-J, Ku S-K. 2016. Evaluation of the skin moisturizing effects and underlying mechanisms of pomegranate concentrate solution and dried pomegranate concentrate powder. J Korean Med. 37(2):12–22.
- Kang SJ, Choi BR, Lee EK, Kim SH, Yi HY, Park HR, Song CH, Lee YJ, Ku SK. 2015. Inhibitory effect of dried pomegranate concentration powder on melanogenesis in B16F10 melanoma cells; involvement of p38 and PKA signaling pathways. Int J Mol Sci. 16(10):24219–24242.
- Ko K, Dadmohammadi Y, Abbaspourrad A. 2021. Nutritional and bioactive components of pomegranate waste used in food and cosmetic applications: a review. Foods. 10(3):657.
- Luo J, Si H, Jia Z, Liu D. 2021. Dietary anti-aging polyphenols and potential mechanisms. Antioxidants. 10(2):283–220.
- Mienaltowski MJ, Birk DE. 2014. Structure, physiology, and biochemistry of collagens. Adv Exp Med Biol. 802:5–29.
- Ortiz-Ruiz CV, Berna J, Tudela J, Varon R, Garcia-Canovas F. 2016. Action of ellagic acid on the melanin biosynthesis pathway. J Dermatol Sci. 82(2):115–122.
- Pacheco-Palencia LA, Noratto G, Hingorani L, Talcott ST, Mertens-Talcott SU. 2008. Protective effects of standardized pomegranate (Punica granatum L.) polyphenolic extract in ultraviolet-irradiated human skin fibroblasts. J Agric Food Chem. 56(18):8434–8441.
- Pandel R, Poljšak B, Godic A, Dahmane R, Alpsoy E, Lan C-C, Val-Bernal JF. 2013. Skin photoaging and the role of antioxidants in its prevention. Article ID. 2013:1–11.
- Pandey KB, Rizvi SI. 2009. Plant polyphenols as dietary antioxidants in human health and disease. Oxid Med Cell Longev. 2(5):270–278.
- Papakonstantinou E, Roth M, Karakiulakis G. 2012. Hyaluronic acid: a key molecule in skin aging. Dermato-Endocrinol. 4(3):253–258.
- Pillaiyar T, Manickam M, Namasivayam V. 2017. Skin whitening agents: medicinal chemistry perspective of tyrosinase inhibitors. J Enzyme Inhib Med Chem. 32(1):403–425.
- Quan T, Qin Z, Xia W, Shao Y, Voorhees JJ, Fisher GJ. 2009. Matrix-degrading metalloproteinases in photoaging. J Investig Dermatol Symp Proc. 14(1):20–24.
- Rinnerthaler M, Bischof J, Streubel MK, Trost A, Richter K. 2015. Oxidative stress in aging human skin. Biomolecules. 5(2):545–589.
- Spilmont M, Léotoing L, Davicco MJ, Lebecque P, Miot-Noirault E, Pilet P, Rios L, Wittrant Y, Coxam V. 2015. Pomegranate peel extract prevents bone loss in a preclinical model of osteoporosis and stimulates osteoblastic differentiation in vitro. Nutrients. 7(11):9265–9284.
- Viguet-Carrin S, Garnero P, Delmas PD. 2006. The role of collagen in bone strength. Osteoporos Int. 17(3):319–336.
- Visse R, Nagase H. 2003. Matrix metalloproteinases and tissue inhibitors of metalloproteinases: structure, function, and biochemistry. Circ Res. 92(8):827–839.
- Vollmer DL, West VA, Lephart ED. 2018. Enhancing skin health: by oral administration of natural compounds and minerals with implications to the dermal microbiome. Int J Mol Sci. 19(10):3059.
- Yoshimura M, Watanabe Y, Kasai K, Yamakoshi J, Koga T. 2005. Inhibitory effect of an ellagic acid-rich pomegranate extract on tyrosinase activity and ultraviolet-induced pigmentation. Biosci Biotechnol Biochem. 69(12):2368–2373.
- Zolghadri S, Bahrami A, Hassan Khan MT, Munoz-Munoz J, Garcia-Molina F, Garcia-Canovas F, Saboury AA. 2019. A comprehensive review on tyrosinase inhibitors. J Enzyme Inhib Med Chem. 34(1):279–309.