
 ?Mathematical formulae have been encoded as MathML and are displayed in this HTML version using MathJax in order to improve their display. Uncheck the box to turn MathJax off. This feature requires Javascript. Click on a formula to zoom.
Abstract
We hypothesize and test for a U-shaped relation between the cost of equity capital and the level of disclosure in annual report narratives. Using a computer-generated word-count-based index of the level of disclosure in U.K. annual report narratives, we document a negative relation with the cost of equity capital at low levels of disclosure, and a positive relation at higher levels of disclosure, together implying the presence of an optimal level of disclosure. We interpret the positive relation at higher levels of disclosure as evidence of uninformative clutter increasing the cost of equity capital. Additional analyses indicate the presence of both firm-level learning and regulatory corporate reporting initiatives as factors shaping adjustments towards optimum levels of disclosure.
1. Introduction
A recurring theme in the financial disclosure literature is the relation between disclosure and the cost of equity capital. Several studies hypothesize, and find, a negative (and linear) relation between the cost of capital and corporate disclosure (see Botosan, Citation2006 for an overview). Beyer, Cohen, Lys, and Walther (Citation2010) however, conclude that the evidence on the negative relation remains inconclusive. This inconclusiveness especially applies to studies that measure disclosure via annual report disclosures.
The present paper postulates and tests for the existence of a non-linear U-shaped relation between the cost of equity capital and the volume of narrative disclosures. On the one hand, prior theoretical literature explains how increases in disclosure can drive a reduction in the cost of capital by reducing (priced) information asymmetry. On the other hand, the market may respond negatively if management increases the clutter in annual reports (both in terms of the volume and complexity of disclosures) in order to obfuscate underlying poor performance. Paradoxically, the opportunities for the generation of uninformative clutter may be increased by regulatory demands for increased disclosure. Taken together, the positive and negative theoretical effects of increased disclosure could lead to a U-shaped relation between the cost of capital and disclosure.
We use U.K. data to test for a U-shaped relation. We believe that the U.K. is particularly well suited to examine the effect of annual report disclosure on the cost of equity capital as it is a major stock market economy where a considerable amount of thought and experimentation has been given by regulators (and companies) regarding the content of the annual report. In particular, unlike the U.S.A., where annual reporting is shaped by a highly structured form 10-K, U.K. firms have considerable discretion over both the content and the format of their annual report disclosures.
In order to test our main hypothesis, we construct an index of the volume of the disclosures in an annual report. Our disclosure index, Discindex, is constructed by aggregating the full sample ranks of eight component measures of annual report disclosure. Seven of the eight components of Discindex capture the word counts of annual report commentary relating to strategy, performance, causality relations, forward-looking information, governance and remuneration (combined), other front-end commentary, and rear-end commentary. The eighth component measures the readability of annual report performance commentary.
In our main model, we regress an empirical proxy for the cost of equity capital on Discindex and Discindex squared as well as a number of control variables and fixed effects. The results provide strong support for the existence of a U-shaped relation. However, a significant challenge to modeling the relation between the cost of equity capital and disclosure is that disclosure is an endogenous variable that is chosen by firms. In a cross-sectional setting, this means that disclosure could have different directional effects on the cost of equity capital, and this could lead the researcher to conclude no effect. This is even more so the case when disclosure is partially endogenous, that is, when firms deviate from optimum levels due to random (regulatory) shocks and (subsequent) learning effects (Larcker & Rusticus, Citation2007). Larcker and Rusticus (Citation2007) highlight this point, that is, the possibility that firms are only partially successful in making optimal policy choices and learn to make better choices over time. This notion of partial adjustment to optimal policy choices is particularly compatible with our framework, especially as it is likely to co-exist, or even be driven by, regulatory overload clutter. As such, in additional analyses we test both effects.
First, we test for the possibility that firms do not know for sure their optimum disclosure choices, and that they learn gradually both from their own experiences and from the experiences of other firms. To test for this element of learning over time, we estimate the distance from the optimum volume of disclosure, as implied by the cost of equity capital model, and test the extent that this distance predicts subsequent changes in disclosure, distinguishing between firms that over-disclose (positive distance) and firms that under-disclose (negative distance). We find that positive and negative deviations from optimum volume levels predict, respectively, declines and rises in subsequent disclosure levels, consistent with firms adjusting their volume of narrative disclosures towards the optimum level over time.
Second, we test for the impact of regulatory corporate reporting initiatives in triggering, or constraining, clutter. During our sample period, we identify two regulatory initiatives that were targeted to improve the content of U.K. annual report narratives. The first one was the introduction of the Business Review in annual report narratives in 2006 and the second was the 2010 revision of the U.K. Corporate Governance Code requiring firms to provide a clear explanation of the business strategy in the narratives. In between these initiatives, regular reviews of the disclosure practices of U.K. firms revealed clutter to be rising within the narrative sections, mainly as a behavioral response to regulatory information overload. The Financial Reporting Council (FRC) responded by issuing a set of guidelines for making corporate reports less complex and more relevant by removing unnecessary text (Citation2009, Citation2011). In light of these guidelines, the two regulatory initiatives offer scope for examining the effect of regulation on both the ‘rising’ and ‘cutting’ of clutter in annual reports. Using the excess of actual disclosure over and above optimal disclosure as our operational proxy for clutter, we document around the two new regulations both a significant rise and a significant decline in the amount of overdisclosure. These results highlight the role of regulatory reporting initiatives as factors shaping adjustments towards optimum volumes of narrative disclosures.
In addition to providing a basis for generating our disclosure index, our disclosure data provides word counts for individual sections and specific types of language (e.g., strategic keywords) and these individual sections and types of language can be traced back to major U.K. regulatory reporting initiatives. This enables our analysis to (i) highlight the presence of both intended and unintended consequences of these initiatives for the cost of equity capital and (ii) offer insights for the effect of individual initiatives on the content of the annual report. With respect to the latter, results of additional analysis unraveling the effects of individual components of our disclosure index suggest that increases in performance commentary and governance and remuneration sections of the annual report may have been successful in reducing the cost of equity capital – although we do not claim to have established a causal effect. These findings are broadly supportive of the disclosure developments encouraged by the U.K. regulator, and may be useful to firms when considering which types of narratives to increase or decrease.
In summary, our paper provides new insights into the relation between the cost of equity capital and annual report narrative disclosures. Specifically, we draw from theory and practice to provide a framework, and associated evidence, for a non-linear U-shaped association between annual report narratives and the cost of equity capital. Our findings imply the existence of an optimum volume of narrative disclosures in the annual report and the existence of uninformative disclosures, or clutter, associated with high volumes of narratives. These results imply the possibility of managing the costs of equity downwards not only through increasing disclosure volumes at below optimal volume levels, but, equally important, also through removing narratives when narrative disclosures have reached above-optimum volume levels. Our analysis also highlights that reaching optimal disclosure levels is not a straightforward task as firm learning and regulatory overload might impede firms from reaching optimal levels immediately.
2. Regulatory Context, Related Literature and Hypothesis Development
2.1. U.K. Regulatory Framework
U.K. annual reports can be viewed as a ‘one stop shop’ for corporate information about various aspects shaping firm value. Also, U.K. firms are given considerable discretion over both the content and the format of their reports. Such discretion allows companies to tell their value creation story in their own way, but it can also lead to excessively lengthy (cluttered) annual reports.
Over the last two decades, U.K. firms were subject to numerous regulatory and legislative developments in corporate reporting requirements. Below we outline developments that shaped the provision of narrative disclosures related to management performance commentary, forward-looking information, corporate governance, executive remuneration, and corporate strategy.
Since 1998, the U.K. Combined Code on Corporate Governance has been the flagship policy instrument used to provide regulatory guidance to U.K. listed firms about their overall governance, remuneration, and financial reporting practices. Over the years, the Code has been developed through a program of engagement with companies, investors, and other stakeholders. As a result, significant demands were added to the Code in revisions issued in 2003, 2006, 2008, 2012, 2014, and 2016. In addition to establishing the principles of corporate governance in the U.K., the Combined Code also imposed a requirement to provide extensive disclosures on how companies comply with the Code within their annual reports. Most companies responded to these disclosure requirements by producing a separate statement of corporate governance within their annual reports. Many of the more routine disclosures were published as part of the directors’ report but disclosures requiring explanations and additional voluntary content about corporate governance was mostly placed in the corporate governance report.
A second important development in U.K. corporate reporting rules was the requirement for firms to produce a remuneration report as part of their annual report. The 1998 version of the Combined Code established the principle that the annual report should contain a statement of the remuneration policy of the firm and details of the remuneration of each director. The requirement to issue a remuneration report and detailed specific disclosure requirements were subsequently enshrined in statutory regulations, starting with The Directors’ Remuneration Report Regulations in 2002, and then with the more strenuous Large and Medium-Sized Companies and Groups (Accounts and Reports) Regulations in 2008, 2013, and 2016. GC100 (Citation2016) provides detailed guidance on the remuneration disclosure regulations, which came into force on 1 October 2013, that is, towards the end of our sample period. In contrast to the U.S.A., annual reports in the U.K. must contain a comprehensive remuneration report, and this is the main source of this information. In the U.S.A. many firms disclose their remuneration details in their proxy statements, and these are only included in the 10-Ks filing by reference.
Three other areas where the Combined Code encouraged new, mostly narrative, disclosures were management performance commentary, forward-looking information, and business strategy. A key pilot initiative was the requirement by Section 417 of the Companies Act 2006A for firms to include a business review in their annual report narratives.Footnote1 The business review introduction was reinforced by the publication of Reporting Statement 1 (RS1) which recommended U.K. listed firms to publish an Operating and Financial Review.Footnote2 The FRC issued this statement as a formulation of best practice that would have persuasive rather than mandatory force. The statement encouraged greater disclosure in the form of forward-looking information as well as performance reviews on current year financial performance and end-of-year financial position. A substantial follow-up initiative to RS1 was the 2010 revision of the U.K. Corporate Governance Code encouraging explicit management commentary in annual report narratives about firm strategy, objectives, and the business model. In 2013 strategic reporting became a mandatory section for all U.K. annual reports through an amendment of U.K. Company Law.
2.2. Theoretical Motivation, Prior Empirical Evidence, and Hypothesis Development
From a theoretical perspective, annual report narratives could have a beneficial, none, or even a harmful effect on the cost of equity capital. A beneficial effect arises when narratives are successful in reducing information risk and, if this risk is priced, then the cost of capital should decline (Barry & Brown, Citation1984, Citation1986; Brown, Citation1979; Easley & O’Hara, Citation2004). However, if markets react less completely to information that is less easily extracted from public disclosures, managers have incentives to obfuscate information when firm performance is bad (Bloomfield, Citation2002). Under this framework more narratives may reflect management attempts to mask poor underlying performance and not reduce information risk. In this case, additional disclosure may not reduce the cost of capital, but may ‘backfire’ and instead increase the cost of capital, especially if investors perceive overly lengthy narratives as more difficult to process and as increasing information risk. Alternatively, when there are no direct costs of misreporting – likely to be the case with qualitative financial disclosures – managers may make misleading disclosures. In equilibrium, investors might treat such disclosures as non-informative as they are independent of managers’ private information (‘babbling equilibrium’, Stocken, Citation2000) in which case more disclosures may either not matter or may even backfire.Footnote3
Regulatory reporting initiatives play an interesting role in this theoretical framework. Initiatives ostensibly targeted at reducing information asymmetry may, paradoxically, increase the scope for meaningless financial disclosures that impede users from understanding firm value creation (see, e.g., Bloomfield, Citation2002).Footnote4 The regulatory overload of reporting initiatives may offer a channel to management for communicating meaningful information, but may also provide a way to intentionally obfuscate a poor underlying economic reality. At the same time clutter may be unintentional if firms are unable to successfully identify optimal levels of disclosure immediately after a new regulatory initiative. Indeed, an FRC review highlighted that clutter may reflect a behavioral response to excess regulatory demand for more information, coupled with a lack of sufficient guidance on what constitutes material information (Citation2009). It is plausible that when firms face a rising regulatory demand for information and a regulatory guidance on materiality which focuses on what to include rather on what to take out, they err on the side of caution by devising long checklists of items for inclusion in the annual report. Peer disclosure dynamics may further exacerbate this regulatory overload clutter. Institutional theory arguments suggest that, in the absence of normative guidelines, organizations mimic peers to obtain ‘social proof of appropriate behavior as a cognitive heuristic to reduce uncertainty (Dacin, Goodstein, & Scott, Citation2002; Deephouse, Citation1996; DiMaggio & Powell, Citation1983). Under this framework, information overload, or clutter, arises in a firm’s attempt to reinforce legitimacy through social herding, or as the FRC notes ‘firms may disclose information simply because everyone else does’ (Citation2009, Citation2011). Irrespective of the existence of managerial intent, clutter in the annual reports, as a manifestation of the regulatory reporting paradox, acts as a key source of tension in the effects of annual report disclosures on the cost of capital.
From an empirical perspective, prior studies based on annual report narrative disclosures show that these narratives typically exhibit the predictable effect of reducing the cost of equity capital but the effect is largely contingent on factors associated with the firm’s information environment. Botosan (Citation1997) employs a disclosure index to manually score the annual report disclosures of 122 U.S. companies and finds a significant negative relation between the overall disclosure index and the cost of equity capital, but only for firms with low analyst following. Francis, Nanda, and Olsson (Citation2008) use a similar index approach to rate 677 U.S. annual reports in 2001. They document evidence of a negative association between their index and the cost of equity capital, but the effect is reduced or disappears completely once they condition on earnings quality. Using automated content analysis, Kothari, Li, and Short (Citation2009) find that the management disclosures in annual reports associated with different aspects of risk (e.g., market, firm, organizational, reputational, performance or regulatory risk) exhibit predictable increases in the cost of equity capital effects for small cap stocks but inconsistent effects for large cap stocks.Footnote5 Grüning (Citation2011) produces an automated disclosure index rating German annual reports along several dimensions (e.g., information about markets, customers, employees, corporate governance, R&D, capital markets and corporate strategy) and shows that the index is negatively related to various information asymmetry proxies, including bid-ask spread.
Turning to the possibility that clutter and other forms of obfuscation may generate harmful capital market effects, a number of studies examine the determinants and/or capital market consequences of annual report length and readability in this respect.Footnote6 A prominent study in this pool, Li (Citation2008) examines annual reports of 50,000 firm-years from 1994 to 2004 and finds that longer annual reports and annual reports with a lower readability, as measured by a higher Fog Index, exhibit lower and less persistent earnings performance. Lehavy, Li, and Merkley (Citation2011) find that analyst following, the amount of effort incurred to generate analyst reports, and the informativeness of analysts’ reports, are greater for less readable annual reports. They also find that less readable annual reports are associated with more earnings forecast dispersion and less accurate earnings forecasts. A number of other studies document negative equity capital market consequences of longer or less readable annual reports. Miller (Citation2010) finds that small equity investors reduce their trading when annual reports increase in length and that longer annual reports are associated with reduced trading consensus for small investors. Lawrence (Citation2013) finds that less sophisticated investors prefer clearer and more readable 10-K filings. You and Zhang (Citation2009) employ a simple word count measure and document that the initial under-reaction to 10-K filings, and the subsequent return drift, tend to be higher for annual reports with an above-median word count. Lee (Citation2012) shows that less (more) of the earnings-related information is impounded in stock prices during the three-day filing window (post-filing drift window) for quarterly reports with an above-median change in length or readability. Callen, Khan, and Lu (Citation2013) find that less readable annual reports have a higher stock price delay. Bonsall and Miller (Citation2017) provide similar evidence for the credit markets. They measure textual complexity at the most recent annual report filed before the bond offering date and show that less readable annual reports are associated with a higher cost of debt. At the same time, Bonsall and Miller (Citation2017) note that at present ‘there is no evidence supporting the notion that financial statements [length or] readability is associated with a higher cost of equity’ (p. 614).
Summarizing the discussion in this section, while it is conceptually plausible for annual report narratives to have a positive effect, no effect, and even a negative effect on the cost of equity capital, empirical studies on narratives often focus on examining a one-directional association. We fill this gap in the literature by considering forces triggering opposite sign associations between financial disclosures in the annual report narratives and the cost of equity capital, and use this as a basis for building a hypothesis for a non-linear U-shaped association. From a theoretical perspective, U.K. annual report narratives, especially in light of the rise of different types of commentaries about firm value, may, on one hand, serve to decrease information asymmetry, yielding cost of capital benefits. On the other hand, the development of new types of commentaries may raise scope for using narratives as a way of distracting users’ attention from the firm’s underlying performance. Such obfuscation attempts may be reflected in lengthier and less readable commentaries. Also, in the presence of a rising regulatory demand for information in annual report narratives, lengthier narratives may reflect regulatory overload clutter as a firm-level learning effect or a behavioral response to ensuring compliance with norms. Either way, at higher levels of disclosure, further increases in disclosure may have either no impact on the cost of equity capital, or may even backfire and increase the cost of equity capital. We therefore hypothesize a U-shaped association between annual report narratives and the cost of equity capital, with the cost of equity capital decreasing with increasing disclosure in narratives up to some point, but then increasing at higher levels of disclosure beyond that point as clutter obfuscates the annual report content. Formally we test the following hypothesis:
H1: The association between annual report narrative disclosures and the cost of equity capital is a U-shaped relation implying a negative marginal association at low levels of disclosure and a positive marginal association at high levels of disclosure.
3. Research Design
3.1. Measuring Disclosure
To construct our disclosure index, Discindex, we begin by assigning annual report narratives to content categories based on the CFIE dataset of automated disclosure scores.Footnote7 The CFIE website contains word frequency counts, and a small number of other linguistic properties, for U.K. annual reports published in calendar years 2003–2014 by firms listed on the London Stock Exchange (LSE). For each annual report, word counts, and other linguistic properties, are given for the (i) Chairman’s Statement, (ii) Chief Executive Officer’s (CEO) Review, (iii) Chief Financial Officer’s (CFO) Review (iv) aggregate business review sections (including CEO review, CFO review, business review and operating reviews) (v) aggregate management performance commentary (including Chairman’s Statement, CEO review, CFO review, business review, operating review, financial review, strategy and business model review), (vi) corporate governance statements, and (vii) remuneration reports. Linguistic properties, other than word counts, comprise page counts, measures of net tone and uncertainty, volumes of forward-looking and causal reasoning commentary, and two readability indices. Most linguistic properties are calculated for the entire annual report and for the seven generic sections in (i) to (vii).Footnote8
El-Haj, Alves, Rayson, Walker, and Young (Citation2020) discuss in detail the motivation behind the CFIE project and provide a full discussion of the steps followed to generate the disclosure scores from digital annual report PDF files. In summary, the process involves three main steps: retrieval of document structure, classification of content, and retrieval and analysis of textual content.
Retrieval of document structure begins by automating the detection of the page containing the annual report table of contents. The information in the contents table is then used to identify document structure, that is, individual section headings, and the pages on which these sections begin and end.
The classification of content was done in two stages. The first stage involved distinguishing simply between narrative sections (‘Narratives’) and sections containing the mandatory financial statements (‘Financials’) including financial statement footnotes. This binary classification task was based on an allocation of section headings found in the table of contents to either Narratives or Financials. The second step involved allocating individual narrative headings to the seven generic sections (i) to (vii). Three of these seven sections, namely management performance commentary, remuneration report, and corporate governance, correspond directly to the U.K. reporting initiatives outlined in Section 2.1. All narrative annual report sections other than those allocated to management performance commentary, remuneration report, or corporate governance, are assigned to a residual category comprising primarily Corporate Social Responsibility (CSR), directors’ reports, and risk reports.
The retrieval and analysis of text step involved retrieving the textual content and then calculating (and storing in Excel) the word frequency counts, and the other linguistic properties, for the entire annual report, for Narratives and Financials, and for the generic sections (i) to (vii).Footnote9
The present paper exploits the ability of the CFIE dataset to identify the volume of narratives in individual sections of the annual report, especially the sections associated with management performance commentary, remuneration, and corporate governance. It also exploits the ability of the CFIE tools to count the volume of specific categories of content, namely the volume of forward-looking and causal reasoning keywords. Our measure of disclosure, Discindex, aggregates six CFIE based word count measures, one CFIE based readability measure, plus one non-CFIE measure of the volume of strategic discussion, into an overall index that reflects the length (and readability) of annual report narratives. Appendix 1 provides full details of how Discindex was constructed. In particular Equation (A1) presents the formula that shows how the eight categories of content (which we refer to as sub-indices) are aggregated into a single overall index, i.e., Discindex.
3.2. Estimating the Cost of Equity Capital
The cost of equity capital can be calculated in various ways including from realized future returns and from estimates implied by analyst earnings forecasts. In the present paper, we follow the approach of Hou, Van Dijk, and Zhang (Citation2012) and generate estimates implied by a cross-sectional earnings prediction model.Footnote10 Employing an earnings prediction model allows us to investigate the effects of disclosure for the firms where we would expect to have the largest effect, namely the smaller companies that are often neglected by other researchers due to a lack of analyst earnings forecasts. We present details for the Hou et al. (Citation2012) earnings prediction model and our results for this model in the Internet Appendix (henceforth IA).
With the earnings predictions in hand we then estimate the cost of equity capital via four valuation models. This is typically referred to as reverse engineering and yields implied cost of equity capital measures that are expected by the market and ‘justify’ the market price given the current earnings predictions. We follow the prior literature such as Hail and Leuz (Citation2006) and use four valuation models: Claus and Thomas (Citation2001) (Coec_ct), Gebhardt, Lee, and Swaminathan (Citation2001) (Coec_gls), Ohlson and Juettner-Nauroth (Citation2005) (Coec_oj) and Easton (Citation2004) (Coec_peg). Specifically, to minimize measurement error, we follow the prior literature and employ as our cost of capital estimate the average estimate from the four valuation models, and we require at least two estimates to calculate the average.Footnote11 The IA presents details for the four valuation models. We find in untabulated tests that the four cost of equity proxies are positively correlated with future realized firm returns (even after controlling for firm fixed effects) thus providing partial validation for the four cost of equity capital measures.
3.3. Regression Model
We employ the following regression model to test H1:
(1)
(1)
Our data consists of firm-year values of the variables of interest (but we omit time and firm subscripts in Equation (1) for simplicity). The dependent variable, Coec, is an estimate of the average implied cost of equity capital. The main independent variables of interest in (1) are Discindex and Discindex_squared and they are our measures for the volume of annual report narratives and squared volume of annual report narratives. The hypothesized U-shaped relation between the cost of equity capital and narratives implies the prediction of a negative coefficient on Discindex and a positive coefficient on Discindex_squared. The other variables in (1) are control variables that have been identified in the prior literature as potential determinants of the cost of equity capital. Specifically, Beta is motivated by the literature on the capital asset pricing. Market to Book, MTBV, and natural logarithm of total assets, LogTA, are motivated by empirical asset pricing studies that regularly find a tendency for the cost of equity capital to be associated with these variables. Leverage is motivated by a basic insight from corporate finance which shows that, for a given stream of firm cash flows, the cost of equity capital increases with leverage. LogAge is included to control for the age of the company since younger firms tend to have a higher cost of capital than more mature firms. Finally, AbsAwca represents absolute abnormal working capital accruals as estimated from the modified Jones model and is motivated by the earnings management literature, including Dechow, Sloan, and Sweeney (Citation1995) who suggest that high levels of earnings management increase the cost of equity capital. In contrast, and as discussed earlier, Francis et al. (Citation2008) show that the relation between disclosure and the cost of equity capital becomes insignificant once one controls for earnings quality. All variable definitions are given in Appendix 2.
We estimate Equation (1) using ordinary least squares, adding industry fixed effects, and firm fixed effects. We view our firm fixed effects results as being the most reliable as there are good reasons to expect the cost of equity capital to vary across firms. Firm fixed effects offer a potential for controlling for endogeneity due to heterogeneity in unobserved firm characteristics beyond those captured by the control variables and industrial effects.Footnote12
4. Sample Selection and Descriptive Statistics
4.1. Sample Selection
We obtain share price, return, and company accounting data from Datastream. Our initial CFIE sample consists of 10,443 U.K. listed firm-years for which we have disclosure scores from the CFIE dataset. Subsequently, we deleted 52 observations due to (i) an inability to find the matching Datastream company codes (9 observations) and (ii) the CFIE dataset containing two documents per firm-year (43 observations). Our disclosure scores – defined as fractional ranks for the eight index components and percentile ranks for Discindex – were built based on the dataset of 10,391 CFIE observations. To arrive at our final sample we applied two more filters as shown in Table , Panel A. First, for each company-year observation, there must be sufficient data in Datastream to implement the Hou et al. (Citation2012) cost of capital estimation procedure. This resulted in the loss of 4405 observations.Footnote13 Second, for each firm-year observation, there must be data on the control variables in Datastream. This resulted in the loss of a further 834 observations.
Table 1. Sample selection and distribution of observations across years
Our final sample consists of 5152 observations for the years 2003–2014, as shown by Table , Panel A. Panel B shows the year-by-year composition of the sample. Finally, we winsorize all variables in our analysis, other than the disclosure score ranks, at the 1st and 99th percentiles to mitigate the effects of outliers.
4.2. Descriptive Statistics
This section presents summary statistics for the main variables in the empirical analysis. Table reports summary statistics for the final (estimation) sample of 5152 firm-year observations. Panel A shows the distribution of Discindex and the distributions of the underlying eight ranked disclosure measures: The mean and median values are all greater than 0.50 because we rank disclosure scores before deleting firms-years with missing variables and because firm-years with non-missing variables tend to have higher disclosure ranks, on average, than firms with missing variables. Panel B shows that there is some variation in the mean and median cost of equity capital estimates across the four different valuation models. In particular, the means and medians of the earnings growth models measures (Coec_oj and Coec_peg) (for which we had a restricted sample since they require earnings growth) are materially higher than the means and medians for the measures based on the residual income valuation models (Coec_gls and Coec_ct). For the control variables in Panel C a notable feature is that the mean of Beta is only 0.61, perhaps suggesting that thin trading has led to a downward biased estimate. Note, however, that Beta is only one of several risk factors in our regression model. The mean leverage of the firms in our sample is 25% and the mean market-to-book value is 2.83. Mean values of LogTA and LogAge are 11.8 and 3.14, respectively. Panel D reports the median values for Discindex and its fractional rank components by year. The two lowest median values for Discindex (0.45 and 0.45) occur in the first two years of the sample period and the three highest values (0.74, 0.78, and 0.74) occur in the last three years of the sample period. There is a marked increase in the median Discindex from 2005 to 2006 – presumably due to the implementation of IFRS. Panel D indicates that most of the median fractional ranks of the seven components based on word counts increase materially over time. The slight exception to this is the causal word count that has a more irregular pattern – increasing slightly from 2003 to 2013 but dropping back in 2014. With regards to the median Fog index, we define the fractional rank as the inverse of Fog so lower values of the median fractional rank indicate lower readability, that is, a tendency for readability to worsen over time. Further details of the empirical properties of Discindex and its components are presented in the IA. The IA also documents the relation between the fractional ranks of the components of Discindex and the raw scores from which the fractional ranks are derived.Footnote14
Table 2. Descriptive statistics
5. Empirical Analysis
5.1. Main Results
Table reports the results of a panel regression of the cost of equity capital on Discindex, Discindex_squared, and the control variables. Column (1) presents results without either industry or fixed effects for a linear model. In column (2) we add the Discindex_squared term. Column (3) controls for industry fixed effects and column (4) for firm fixed effects. We regard the firm fixed effects regression as our main result.
Table 3. Panel regressions for cost of equity capital on overall disclosure
In column (1) we document a statistically significant negative relation between Discindex and the cost of equity when the quadratic disclosure term is omitted; in line with prior research that documents such a beneficial linear effect of disclosure (e.g. Botosan & Plumlee, Citation2002). Furthermore, all three non-linear models in (2) to (4) show a significant negative coefficient on Discindex and a significant positive coefficient on Discindex_squared. The size and significance of the two coefficients are much lower for the firm fixed effects regression. However, the t-statistics associated with Discindex and Discindex_squared in (4) are −4.39 and 5.14, respectively, indicating that the two coefficients remain highly significant even in the firm fixed effects model.Footnote15 Overall these results strongly support our U-shaped hypothesis.Footnote16
In columns (2) to (4) we use the estimated coefficients on Discindex and Discindex_squared to calculate an implied optimum disclosure level (ODL). Specifically, we derive the partial derivative of Coec in Equation (1) with respect to Discindex and set this derivative equal to 0, that is, dCoec / dDiscindex = β1 + 2 β2 Discindex = 0. Rearranging yields an optimal Discindex of – β1 / 2 β2. Using the estimates of β1 and β2 of −0.169 and 0.154 from column (4) yields an ODL of 55% in (4) which is slightly lower than the corresponding implied ODL of 64% in column (2). The implied ODL under industry fixed effects falls between these two values at 62%.Footnote17 With respect to the control variables, leverage is significantly positive and firm size is significantly negative in all regressions, consistent with prior literature. Also, market-to-book is significantly negative in all four specifications. We do not obtain consistent evidence of significance for Beta, AbsAwca, and LogAge. The adjusted R-squared of our models lie between 43% and 50% depending on the fixed effect specification.
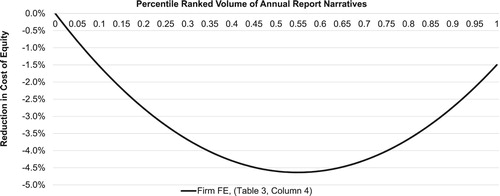
To illustrate the intuition of the ODL, we plot the quadratic relation between cost of equity capital and annual report narrative disclosure for the firm fixed effects specification in Figure . Our measure of narrative disclosure seems to reduce the cost of equity capital until the minimum point is reached. Beyond this point, the cost of equity capital increases with additional narrative commentary.
Figure 1. U-shaped relation between cost of equity capital and volume of annual report narratives. This figure illustrates the reduction in the cost of equity capital as a function of the (ranked) volume of annual report narratives, as implied by the regression results in Table , column (4) (that is after allowing for firm fixed effects)
5.2. Changes in the U-shaped Relation Over Time
The U.K. experienced material increases in the average level of disclosure over the sample period. This was largely caused by a number of regulatory reporting initiatives, outlined in Section 2.1., as well as firms responding to investor demands for information relating to a number of emerging themes such as key performance indicators, business model, strategy, governance, and remuneration.
To gain some insights into the effects of these changes on the U-shaped relation we estimate Equation (1) using three-year rolling windows.Footnote18 This analysis allows us to observe time variation of the ODL. Table reports the regression results.
Table 4. Three-year rolling window regressions showing variation over time in optimum levels of disclosure
The (absolute) size of the regression coefficients on Discindex and Discindex_squared decrease materially from the earlier to the later windows. Nevertheless, both coefficients remain statistically significant throughout. Of particular interest is the tendency for the ODL to increase materially from the earlier to the later windows. For example, the ODL increases from 50% in 2005 to 74% in 2012.Footnote19 This increase in the ODL reflects either a rise in net benefits of higher disclosure in annual report narratives over the years, or a drop in the annual report narratives disclosure threshold. Higher net benefits of disclosures could arise from firms’ higher awareness over the years of the type of information that investors need in the annual reports. The regulatory reporting initiatives of the FRC (outlined in Section 2.1.) targeted such awareness through revisions of the Code that responded to investor demands for more information on key drivers of performance and risk in annual reports (in Code revisions issued in 2003, 2006, 2008, 2012, 2014, and 2016). Later in our sample period regulators could have also contributed to lower preparation costs of annual report narratives by giving explicit guidance on what constitutes clutter (FRC, Citation2009, Citation2011) and therefore accelerating firm-level learning effects. Through the lens of voluntary disclosure theories, an increase in the ODL could also reflect the gradual fall in disclosure thresholds from proprietary costs (Verrecchia, Citation1983) or disclosure thresholds allowed by investor uncertainty that managers are informed (Dye, Citation1985), a fall that is well anticipated in the presence of the FRC’s enhanced frameworks for reporting on firm strategy and the business model, governance, and remuneration.
The final row of Table reports the proportion of the three-year rolling window sub-samples with a Discindex value lower than the implied three-year ODL. The proportion of firms with Discindex below the ODL ranges from 41%, in the 2006–2008 rolling window, to 56%, in the 2009–2011 and the 2011–2013 rolling windows. The median proportion is 48%. There is a slight tendency for the proportion of firms with Discindex below the ODL to be greater the higher the value of the ODL. However, this association is far from perfect. The adjusted R squared value of a regression of the proportion of firms with Discindex lower than ODL on ODL is only 20.7%.
5.3. Firm Learning Effects
Given that disclosure is endogenous, it is possible that the non-linear U-shaped relation that we observe in the data is just an equilibrium ‘illusion’ from the cross-sectional distributions of different optimal associations (Larcker & Rusticus, Citation2007). This alternative interpretation of the core result assumes that firms know their optimum level of annual report narrative disclosure at every point in time and are able to costlessly adjust their levels of narrative disclosure to the optimum at every point in time. We believe that this assumption is unrealistic. We argue that firms face considerable difficulties in identifying their optimum level of narrative disclosure, partly because firm characteristics change over time, partly because accounting and disclosure regulations change over time, and partly because understanding how the market uses disclosures is not always an easy task. For these reasons, it is reasonable to view the level of narrative disclosure as being partially endogenous, as defined by Larcker and Rusticus (Citation2007), when firms are unsuccessful in reaching optimal policies immediately. Under this view, firms learn from their mistakes over time: If they are below (above) the optimum level of narrative disclosure, they increase (decrease) their level of disclosure towards the optimum level. We next investigate these firm-level learning effects as they could also contribute to the non-linear U-shaped association between disclosure and the cost of equity capital.
To examine how firms learn to adjust their disclosure to optimum levels over time we adapt the Core and Guay (Citation1999) modeling approach to the disclosure choice and cost of equity capital context. Core and Guay (Citation1999) devise a two-stage approach to model changes in the level of stock-based compensation allowing for the possibility that firms adjust compensation packages over time in the direction implied by optimal portfolio incentives. In the first stage, they regress the level of stock-based compensation on a set of potential determinants of stock-based compensation such as firm size, idiosyncratic risk, book to market, a proxy for a potential free cash flow problem, and industry controls. In the second stage model, they relate the level of new stock-based compensation grants in year t, to the residual of the first stage model in year t−1, controlling for firm size, book to market, net operating loss, cash flow shortfall, current and prior period stock returns, and industry effects.
In a similar fashion, we test for the possibility that firms adjust their volumes of narrative disclosure towards the ODL over time using a two-stage approach.Footnote20 Our analysis of this learning effect requires the calculation of an ODL on the year level. To generate this, we estimate Equation (1) using a three-year rolling window, that is, we obtain coefficient estimates for Discindex and Discindex_squared each year using data on years t−2 through to year t.Footnote21 We then again use these estimates to calculate the implied ODL for each year.
In the second stage, we predict that firms that had lower (higher) actual levels of disclosure, relative to the ODL, will increase (decrease) their level of disclosure in subsequent periods. Specifically, we use the results of the first-stage regression to define two measures of the distance of actual firm disclosures from the optimum (year-specific) disclosure levels: Lag_distance_overdisclosure is set equal to the actual disclosure level minus estimated ODL, if this value is positive, and zero otherwise, while Lag_distance_underdisclosure is set equal to the estimated ODL minus the actual disclosure level, if this value is positive, and zero otherwise.
In our second-stage we regress the current year change in Discindex on one-year lagged over- and under-disclosure, along with disclosure model controls such as LogTA, MTBV, AbsAwca, ROA, Exantefinance and SNetincome as follows:
(2)
(2)
where ΔDiscindex is the year-on-year change in Discindex, Lag_distance_overdisclosure and Lag_distance_underdisclosure are our measures for prior years’ over- and under-disclosure, relative to prior year’s optimal disclosure, Exantefinance is an attempt to model the firm’s need for external finance, and SNetincome is the standard deviation of net income over years t to t−2. We would expect disclosure to increase in external finance needs and earnings volatility. These controls follow Athanasakou, El-Haj, Rayson, Walker, and Young (Citation2019). All variables are as defined in Appendix 2.
Table column (1) reports the results of this test. As expected, the slope coefficient on Lag_distance_overdisclosure is significantly negative (−0.383, t-statistic = −14.2) while the slope coefficient on Lag_distance_underdisclosure is significantly positive (0.101, t-statistic = 5.81). These two coefficients suggest that previously over- and under-disclosing firms decrease and increase, respectively, their volume of annual report narrative disclosure in the following period, and the extent of their adjustment is based on the degree to which they over- and under-disclosed in t−1. Furthermore, these observations hold even after controlling for the negative serial autocorrelation that we observe in the data for ΔDiscindex: When we include the one-period lagged change in Discindex, Lag_ΔDiscindex, as a further control in column (3) then the coefficients on Lag_distance_overdisclosure and Lag_distance_underdisclosure retain their predicted sign and remain significant.Footnote22 Overall, we interpret the findings in Table as evidence that firms learn about their optimum levels of disclosure over time and that they react and adjust their disclosure level towards their optima.Footnote23
Table 5. Firm learning effects and disclosure adjustments
5.4. Regulatory Effects
An additional factor underlying the non-linear U-shaped relation between annual report disclosures and the cost of equity capital relates to the unintended consequences of regulatory initiatives for more information in narratives. As discussed in detail in Section 2.2. it is possible that, when faced with a rising regulatory demand for further narrative disclosures in the annual report, firms err on the side of caution and end up including unnecessary information. Peer disclosure dynamics – where firms mimic the increased disclosures of their peers (considering this as ‘the socially acceptable level’) instead of seeking their own firm-specific optimum – may further exacerbate this regulatory overload clutter. As such regulation-induced clutter may also underlie firm-level learning effects by posing a challenge to firms in immediately identifying their optimum level of disclosure.
Over our sample period, two regulatory initiatives stand out: The 2006 company law mandate introducing the Business Review (BR) in annual reports and the 2010 revision of the Corporate Governance Code which required firms to provide a clear explanation of the company strategy and business model in the annual report. In between these two regulatory initiatives the FRC published ‘Louder than Words’ (FRC, Citation2009) – a set of principles for making corporate report less complex and more relevant – and another set of ‘cutting clutter’ guidelines to encourage firms to remove unnecessary text and data from annual reports (FRC, Citation2011). Together these developments offer scope for investigating both the rise and the fall of clutter in annual report narratives.
To investigate this issue empirically, we regress our operational proxy for clutter, Distance_overdisclosure, on indicator variables for the two shifts, the 2006 Business Review (BR) introduction, Post_BR, and the subsequent focus on clarity culminating in the 2010 revision of the Corporate Governance Code, Post_CGREV. Post_BR identifies year-ends ending on or after 31 March 2006 while Post_CGREV identifies periods ending on or after 30 June 2011. Our proxy for clutter, Distance_overdisclosure, is the amount of over-disclosure, relative to optimal disclosure, and is defined in the same way as Lag_distance_overdisclosure in Section 5.3, but measured in period t, not in t−1. We believe that the market perceived optimum level of narrative disclosure, as implied by the cost of equity capital, is an important filter in identifying clutter because the FRC’s clutter definition embeds a users’ perspective, that is, rises in annual report narratives are not clutter unless they inhibit users’ ability to identify relevant information.
Column (1) of Table reports results from regressing Distance_overdisclosure on the two regulator shifts variables, Post_BR and Post_CGREV, plus control variables. The specification includes firm fixed effects. The coefficient on Post_BR is, as expected, positive (0.038, t-statistic = 8.19) while the coefficient on Post_CGREV is, as expected, negative (−0.035, t-statistic = −8.97).Footnote24 These results suggest an overall increase in the amount of over-disclosure following the Business Review introduction and a respective decline after the FRC guidance and the 2010 revision of the Corporate Governance Code.
Table 6. Regulatory change and clutter
An alternative approximation of clutter is a positive change in the disclosure from one year to the next, on the assumption that positive changes are more likely to reflect regulatory overload than negative changes. This is arguably a cruder approximation of clutter since positive changes in the disclosure index are also likely to include informative rises in annual report narratives. To assess the performance of this alternative proxy for clutter, we repeat the analysis using Increase_Discindex, a variable which is equal to the year-on-year change in Discindex if positive, and 0 otherwise. Column (2) reports these results: While the coefficient on Post_BR is positive (0.018, t-statistic = 2.60), the coefficient on Post_CGREV is not significant, which affirms that simple increases in Discindex only weakly exhibit the properties of clutter.
Taken together, we interpret the findings in Table as affirming the role of regulatory reporting initiatives in shaping, encouraging, or constraining clutter. The results in Table also lend validity to our operational definition of clutter as disclosure over and above optimal disclosure, as alternative proxies for clutter, which are not benchmarked against optimal disclosure, like year-on-year increases, appear to lead to weaker approximations.
5.5. Individual Components of the Disclosure Index
So far, our results suggest that firms with below (above) optimal disclosure levels should increase (decrease) narrative annual report volumes. Also, the larger the distance between actual and optimal disclosure volumes, the larger the adjustment in length needed to move to the minimum cost of equity capital. In practice, however, annual report length appears quite sticky from one year to the next suggesting that U.K. listed firms are generally quite reluctant to make dramatic changes to annual report length, at least in the short run. However, U.K. firms might still be willing to increase one annual report feature (i.e. specific section or type of content) at the expense of another feature. The key question then is which features the firm should target for an extension and which features for a reduction.Footnote25 A breakdown analysis of Discindex into individual components may offer useful insights to this question.
For this part of the analysis we follow a common approach in the annual report narrative literature and hold annual report length constant by employing disclosure scores that are scaled by a measure of length (e.g., Athanasakou et al., Citation2019; Athanasakou & Hussainey, Citation2014; Bozzolan, Trombetta, & Beretta, Citation2009; Kothari et al., Citation2009). Specifically, we now examine the cost of capital effects of the five main measures aggregated into Discindex – Perf, Gov, Strategy, Casual, and Forward – after scaling each measure by the word count of the rear-end, Rearend.Footnote26 We then assess the sign and significance of each scaled measure’s slope coefficient to assess which features of the annual report the firm should extend (and which features it can possibly shorten). Note that, for this test, there is no theoretical prior for the impact of the individual components; the motivation is rather empirical: U.K. policy developments explicitly encouraged specific types of commentary related to performance analysis, strategy, corporate governance (including remuneration), and forward-looking information. So, it seems worth asking if changes in the relevant proportions of these types of commentary were reflected in cost of capital improvements.
Table , columns (1) to (5) initially report the results of regressing the cost of equity capital on the five measures individually. The loadings on the five scaled measures in (1) to (5) are all negative suggesting that an increase in the relative volume of all five measures would reduce the cost of equity capital. However, while Scaled_Perf is highly significant, with a t-statistic of −4.59, Scaled_Forward is only marginally significant, with a t-statistic of −1.85.
Table 7. Individual component analysis
Differences in significance between the five measures become even more pronounced when we include in column (9) all five measures in one regression – together with Fog, Log_Rearend, Log_Rearend_squared, Log_Restfront, and Log_Restfront_squared as further controls. Specifically, in this specification the loadings on Scaled_Perf and Scaled_Gov are negative and significant. Scaled_Strategy is also negative but not significant at conventional levels, and Scaled_Causal and Scaled_Forward are positive but not significant. Overall this result seems to suggest that firms could have reduced their cost of equity capital by increasing management performance commentary and governance and remunerations sections, while a reduction in Scaled_Strategy, Scaled_Causal and Scaled_Forward would lead to no significant effect on the cost of equity capital.
In terms of control variables, we note that the loading on Log_Restfront is negative, but insignificant, and the coefficient on Log_Restfront_squared is close to zero. Also, the loading on Log_Rearend is negative and significant, while the loading on Log_Rearend_squared is positive and significant. Thus, the results for Rearend are consistent with the presence of a U-shaped relation for the (absolute) volume of rear-end narratives, consistent with our earlier finding. In summary, the findings in Table are consistent with the focus of U.K. disclosure policy on Perf and Gov (including remuneration).
6. Conclusion
The relation between the cost of equity capital and annual reporting disclosure is a long-debated research topic in accounting and finance. Prior literature has assumed a linear relation between disclosure and the cost of equity capital. We contribute to the literature by proposing and testing for a U-shaped relation between the cost of equity capital and disclosure. We use a word-count-based computer-generated index of U.K. annual report disclosures to provide new evidence for a panel of 5152 firm-year observations over the period of 2003–2014. This makes it the largest sample that was ever used to address this type of research question.
Our approach to measuring U.K. annual report disclosure content reflects the institutional framework of the U.K. where the annual report is seen as a one-stop shop for information that extends and complements the information contained in the financial statements. It also pays particular attention to regulatory developments over the sample period that focused company attention on disclosures related to performance commentary, forward-looking and strategic information, and commentary related to corporate governance and director’s remuneration. In line with prior literature and related regulatory concerns, our approach to disclosure measurement also incorporates indicators of annual report length and readability.
In addition to finding a U-shaped relation between the cost of capital and our overall disclosure index we also present disaggregated findings which suggest that firms could reduce their cost of equity capital by increasing management performance commentary and governance and remuneration sections.
Taken together our results show that annual report disclosures are useful to investors but that more disclosure is not always better – thereby reconciling the theoretical tension that exists on the controversial roles of both mandatory and voluntary disclosures. We verify empirically the existence of the growing issue of clutter within annual report narratives.
Supplemental Material
Download MS Word (437.3 KB)Acknowledgements
Florian Eugster gratefully acknowledges the support of Handelsbanken Wallander stipendium. The authors thank Mahmoud El-Haj, Paul Rayson, and Steven Young, for their work on developing the CFIE annual report narratives database; and Mattias Hamberg (discussant) and the participants of the Accounting Research Seminar at Stockholm School of Economics, the University of Bradford, the 2016 Nordic Accounting Conference, and the 2017 EAA Congress in Valencia, for helpful comments on earlier versions of the paper. We thank the anonymous reviewer and the special issue editors, Reuven Lehavy and Florin Vasvari, for very helpful comments. All remaining errors are the responsibility of the authors.
Disclosure statement
No potential conflict of interest was reported by the authors.
Supplemental Data and Research Materials
Supplemental data for this article can be accessed on the Taylor & Francis website, doi:10.1080/09638180.2019.1707102
Section A) Further details on the disclosure index, Discindex, and its components.
Section B) and Table IA.3 provide details on the estimation of the implied cost of equity capital.
Section C) Correlation table for main regression variables.
Section D) Robustness tests relating to the main regression model.
Section E) Results of using nonparametric regression to infer the functional form.
Table IA.1. Further Details on the Components in Discindex: Fractional Ranks versus Standardised Component Raw Scores.
Table IA.2. Further Details on the Components in Discindex: Year-on-Year Changes in Fractional Ranks versus Year-on-Year Changes in Standardised Component Raw Scores.
Table IA.3. Descriptive Statistics and Results from the Cross-sectional Earnings Regression Models
Table IA.4. Correlations of Main Regression Variables
Figure IA.1. Non-linear Relation between Cost of Equity Capital and Volume of Annual Report Narratives Using Non-parametric Regression
ORCID
Thomas Schleicher http://orcid.org/0000-0002-8553-4532
Additional information
Funding
Notes
1 Within the Business Review firms provide a commentary on corporate objectives, strategy and resources available to deliver those objectives, risk and uncertainties facing the entity, and trends and factors likely to affect the company’s future.
2 RS1 is the only reporting statement the FRC has ever issued.
3 Another argument relates to the joint effect of capital structure when it is possible that more expansive disclosures increase the firm’s cost of capital to the extent that they enhance assessments of the firm’s downside risk (Bertomeu, Beyer, & Dye, Citation2011).
4 During our sample period, the FRC identified clutter, defined as immaterial disclosures that inhibit users’ ability to identify and understand relevant information, as a growing problem of the U.K. annual report (Citation2009, Citation2011).
5 While there are numerous studies conducting content analysis of U.K. annual reports, they focus on particular aspects (e.g., intellectual capital, Beattie & Thomson, Citation2007) or particular aspects (e.g., tone) of particular sections (e.g., chairman’s statement, operating and financial review, Smith & Taffler, Citation2000; Rutherford, Citation2005).
6 Within this pool of studies, initial findings by J. E. Smith and Smith (Citation1971) suggest that the readability of financial statement footnotes is poor, while other studies associate variations in annual report readability with the external auditor (Barnett & Leoffler, Citation1979), the risks facing the company (Courtis, Citation1986), and financial performance (Subramanian, Insley, & Blackwell, Citation1993).
7 Annual report disclosure scores are available from the Corporate Financial Information Environment (CFIE) website under http://ucrel.lancs.ac.uk/cfie/annual-report-scores.php.
8 The CFIE dataset is the outcome of a publicly funded collaboration between Lancaster University Management School, Alliance Manchester Business School, and the London School of Economics, and, at present, provides disclosure scores for 10,443 annual reports published during calendar years 2003–2014 by 1989 LSE-listed, non-financial companies. These 10,443 reports are also employed in El-Haj et al. (Citation2020) for an assessment of the disclosure scores’ accuracy which is typically in excess of 95%.
9 The volume of forward-looking and causal reasoning commentary is measured using keyword lists defined by the CFIE project team based on a review of the prior literature, especially Hussainey, Schleicher, and Walker (Citation2003) for forward-looking keywords, and Zhang and Aerts (Citation2015) for causal reasoning keywords. Both keyword lists are available from http://ucrel.lancs.ac.uk/cfie/annual-report-scores.php. The two readability indices are Gunning’s (Citation1968) Fog index and the Flesch-Kincaid (Kincaid, Fishburne, Rogers, & Chissom, Citation1975) readability index. See also El-Haj, Rayson, Walker, Simaki, and Young (Citation2019).
10 Hou et al. (Citation2012) argue that a cross-sectional model helps to overcome optimistically biased analyst forecasts and potential IBES coverage problems, especially in relation to smaller and financially distressed firms.
11 When we require all four individual models to estimate the average cost of equity capital, then untabulated results remain unchanged.
12 However, a potential problem with firm fixed effects is that it runs the risk of introducing a large number of irrelevant variables into the model thereby inducing a type II error.
13 Requiring financial analyst coverage would reduce our sample even more and we would end up with a sample of 2808 firm-years.
14 A correlation table for the main regression variables is also presented and discussed in the IA.
15 To assess the sensitivity of our findings in Table to the way the components of the index are aggregated, we run the fixed effects regression with all the individual components and all the squared values of the components included as separate variables. The adjusted R-squared of the model increases only marginally, from 0.43 to 0.44. Consistent with the U-shaped hypothesis, the t-value of the average value of the individual (linear) coefficients is −5.41, and the t-value of the average value of the squared term coefficients is 6.33.
16 The IA presents robustness results where our implied Coec estimates are replaced with realized future returns, acknowledging that realized returns are a noisy proxy for Coec (e.g., Campbell, Citation1991; Elton, Citation1999; Vuolteenaho, Citation2002). In addition, the IA addresses the concerns of Wang (Citation2015, Citation2017) about implied Coec estimates.
17 Changes in sample composition are also unlikely to underlie our results, on account of the large size of the cross-section in our sample (1183 firms in our final sample with a 4.4 average number of years). As a robustness test, we also repeat the analysis for a ‘quasi-balanced’ sample of firms that have at least 10 observations over our sample period. The average observation per firm for this test rises to 10.8. We document similar results for this sample. We find optima that are similar to those reported in Table (e.g., in column (2) we have 0.68 compared to 0.64 and in column (3) we have 0.65 compared to 0.62).
18 Because of the limited number of observations per firm in each window, this analysis focuses on results for industry fixed effects. In untabulated results we recalculate the optima based on a one-year rolling window and, similar to the results in Table , the optimal level of disclosure is increasing over time. Furthermore, we observe a significant non-linear effect in all years but 2013. Moreover, when we define separate three-year rolling windows for each ICBN one-digit industry sector, then over 80% of the regressions have a significantly negative slope on Discindex and a significantly positive coefficient on Discindex_squared, and the average optimum is 59% with a standard deviation of 9 percentage points.
19 Average Discindex rises for both firms lying below the optimum from 25% in 2005 to 42% in 2012 and for firms over the optimum from 72% in 2005 to 89% in 2012.
20 This approach is informed by the two-stage approach devised by Core and Guay (Citation1999) but it is not identical. Core and Guay (1999) use the residual of their first-stage model (of stock-based compensation on a set of potential determinants such as firm size, idiosyncratic risk, book to market, a proxy for a potential free cash flow problem, and industry controls) as the key variable in their second-stage model. In our model, we use measures of the extent to which the partially endogenous variable, the disclosure level, differs from the optimum level in the first stage as the main variable in our second stage estimations.
21 We use a three-year window to ensure a reasonable number of observations for the first stage regression and taking into account the possibility that the optimum level can change gradually over time.
22 In an untabulated test, we also added two-period lagged change in Discindex and found that the coefficients on Lag_distance_overdisclosure and Lag_distance_underdisclosure continued to show their predicted sign and remained significant (despite a further reduction in sample size to 1405 observations). Specifically the two coefficients were −0.316 and 0.061, with t-statistics of −8.95 and 2.55. There was no evidence in the data of serial autocorrelation of third order. After controlling for first and second order autocorrelation the coefficient on the three-period lagged change in Discindex is −0.005 with a t-statistic of −0.14.
23 This finding is not sensitive to research design choices especially the definition of the firm-year optimum. For example, we replicated Table column (1) with an optimum based on a one-year rolling window and find similar results. In untabulated tests we also employed industry-specific three-year rolling windows based on the ICBN one-digit industry classification. Again, we obtain similar results to those reported in Table column (1).
24 This result is robust to modeling the incidence of over-disclosure, rather than the amount of overdisclosure, as an alternative operational proxy for clutter.
25 Bushee, Gow, and Taylor (Citation2018) make a similar attempt in that they try to decompose the linguistic complexity of U.S. firm conference calls into an informative component and an obfuscation component. In doing so they assume that the readability of analyst contributed sentences reflect informativeness, but not obfuscation. Using a measure of stock illiquidity as a proxy for information asymmetry, they find that information asymmetry is positively (negatively) associated with the obfuscation (informativeness) component of the conference calls.
26 We use the number of words in the financial statements section of the report rather than the number of words in the narratives section because the latter includes aspects of performance, governance or strategy-related commentary, which we wish to maintain.
27 Gunning (Citation1968) defines Fog as the estimated number of years of formal education a person needs to understand the text on first reading. It is calculated by adding the percentage of words in a text with three or more syllables to the average number of words per sentence, both multiplied by 0.4. For example, a Fog Index of twelve requires the reading level of a high school graduate, that is, someone around 18 years old. Because higher values of Fog indicate text that is more difficult to understand we multiply Fog by minus one before we rank it. This implies that a higher ranking indicates a report that is easier to read, that is, requires fewer years of formal education.
References
- Athanasakou, V., El-Haj, M., Rayson, P., Walker, M., & Young, S. (2019). Annual report commentary on the value creation process. Working Paper. doi:10.2139/ssrn.3212854.
- Athanasakou, V., & Hussainey, K. (2014). The perceived credibility of forward-looking performance disclosures. Accounting and Business Research, 44(3), 227–259.
- Barnett, A., & Leoffler, K. (1979). Readability of accounting and auditing messages. Journal of Business Communication, 16(3), 49–59.
- Barry, C. B., & Brown, S. J. (1984). Differential information and the small firm effect. Journal of Financial Economics, 13(2), 283–294.
- Barry, C. B., & Brown, S. J. (1986). Limited information as a source of risk. The Journal of Portfolio Management, 12(2), 66–72.
- Beattie, V., & Thomson, S. (2007). Lifting the lid on the use of content analysis to investigate intellectual capital disclosures. Accounting Forum, 31(2), 129–163.
- Bertomeu, J., Beyer, A., & Dye, R. A. (2011). Capital structure, cost of capital, and voluntary disclosures. The Accounting Review, 86(3), 857–886.
- Beyer, A., Cohen, D. A., Lys, T. Z., & Walther, B. R. (2010). The financial reporting environment: Review of the recent literature. Journal of Accounting and Economics, 50(2–3), 296–343.
- Bloomfield, R. J. (2002). The “incomplete Revelation hypothesis” and financial reporting. Accounting Horizons, 16(3), 233–243.
- Bonsall, S. B., & Miller, B. P. (2017). The impact of narrative disclosure readability on bond ratings and the cost of debt. Review of Accounting Studies, 22(2), 608–643.
- Botosan, C. A. (1997). Disclosure level and the cost of equity capital. The Accounting Review, 72(3), 323–349.
- Botosan, C. A. (2006). Disclosure and the cost of capital: What do we know? Accounting and Business Research, 36(Supplement 1), 31–40.
- Botosan, C. A., & Plumlee, M. A. (2002). A re-examination of disclosure level and the expected cost of equity capital. Journal of Accounting Research, 40(1), 21–40.
- Bozzolan, S., Trombetta, M., & Beretta, S. (2009). Forward looking disclosures, financial verifiability and analysts’ forecasts: A study of cross-listed European firms. European Accounting Review, 18(3), 435–473.
- Brown, S. (1979). The effect of estimation risk on capital market equilibrium. The Journal of Financial and Quantitative Analysis, 14(2), 215–220.
- Bushee, B. J., Gow, I. D., & Taylor, D. (2018). Linguistic complexity in firm disclosures: Obfuscation or information? Journal of Accounting Research, 56(1), 85–121.
- Callen, J. L., Khan, M., & Lu, H. (2013). Accounting quality, stock price delay, and future stock returns. Contemporary Accounting Research, 30(1), 269–295.
- Campbell, J. (1991). A variance decomposition for stock returns. The Economic Journal, 101(405), 157–179.
- Claus, J., & Thomas, J. (2001). Equity premia as low as three percent? Evidence from analysts’ earnings forecasts for domestic and international stock markets. The Journal of Finance, 56(5), 1629–1666.
- Core, J., & Guay, W. (1999). The use of equity grants to manage optimal equity incentive levels. Journal of Accounting and Economics, 28(2), 151–184.
- Courtis, J. K. (1986). An investigation into annual report readability and corporate risk return relationships. Accounting and Business Research, 16(64), 285–294.
- Dacin, M. T., Goodstein, J., & Scott, W. R. (2002). Institutional theory and institutional change: Introduction to the special research forum. Academy of Management Journal, 45(1), 45–56.
- Dechow, P. M., Sloan, R. G., & Sweeney, A. P. (1995). Detecting earnings management. The Accounting Review, 70(2), 193–225.
- Dechow, P. M., Sloan, R. G., & Sweeney, A. P. (1996). Causes and consequences of earnings manipulation: An analysis of firms subject to enforcement actions by the SEC. Contemporary Accounting Research, 13(1), 1–36.
- Deephouse, D. L. (1996). Does Isomorphism Legitimate? Academy of Management Journal, 39(4), 1024–1039.
- DiMaggio, P. J., & Powell, W. W. (1983). The iron cage revisited: Institutional isomorphism and collective rationality in organizational fields. American Sociological Review, 48(2), 147–160.
- Dye, R. A. (1985). Disclosure of non-proprietary information. Journal of Accounting Research, 23, 123–145.
- Easley, D., & O’Hara, M. (2004). Information and the cost of capital. The Journal of Finance, 59(4), 1553–1583.
- Easton, P. D. (2004). PE ratios, PEG ratios, and estimating the implied expected rate of return on equity capital. The Accounting Review, 79(1), 73–95.
- El-Haj, M., Alves, P., Rayson, P., Walker, M., & Young, S. (2020). Retrieving, classifying and analysing narrative commentary in unstructured (glossy) annual reports published as PDF files. Accounting and Business Research, 50(1), 6–34.
- El-Haj, M., Rayson, P., Walker, M., Simaki, V., & Young, S. (2019). In search of meaning: Lessons, resources and next steps for computational analysis of financial discourse. Journal of Business Finance and Accounting, 46(3–4), 265–306.
- Elton, E. (1999). Expected return, realized return, and asset pricing tests. The Journal of Finance, 54, 1199–1220.
- Financial Reporting Council (FRC). (2009). Louder than words: Principles and actions for making corporate reports less complex and more relevant. London: Author.
- Financial Reporting Council (FRC). (2011). Cutting clutter in annual reports. London: Author.
- Francis, J., Nanda, D., & Olsson, P. (2008). Voluntary disclosure, earnings quality, and cost of capital. Journal of Accounting Research, 46(1), 53–99.
- GC100. (2016). Directors’ remuneration: Revised GC100 and investor group directors’ remuneration reporting guidance. Retrieved from https://uk.practicallaw.thomsonreuters.com/7-632-2185?transitionType=Default&contextData=(sc.Default)
- Gebhardt, W. R., Lee, C. M. C., & Swaminathan, B. (2001). Toward an implied cost of capital. Journal of Accounting Research, 39(1), 135–176.
- Grüning, M. (2011). Artificial intelligence measurement of disclosure (AIMD). European Accounting Review, 20(3), 485–519.
- Gunning, R. (1968). The technique of clear writing. New York, NY: McGraw-Hill.
- Hail, L., & Leuz, C. (2006). International differences in the cost of equity capital: Do legal institutions and securities regulation matter? Journal of Accounting Research, 44(3), 485–531.
- Hou, K., Van Dijk, M. A., & Zhang, Y. (2012). The implied cost of capital: A new approach. Journal of Accounting and Economics, 53(3), 504–526.
- Hussainey, K., Schleicher, T., & Walker, M. (2003). Undertaking large-scale disclosure studies when AIMR-FAF ratings are not available: The case of prices leading earnings. Accounting and Business Research, 33(4), 275–294.
- Kincaid, J. P., Fishburne, R. P., Rogers, R. L., & Chissom, B. S. (1975). Derivation of new readability formulas (automated readability index, fog count, and flesch reading ease formula) for Navy enlisted personnel. Research Branch Report 8–75. Chief of Naval Technical Training: Naval Air Station Memphis.
- Kothari, S. P., Li, X., & Short, J. (2009). The effect of disclosures by management, analysts, and financial press on cost of capital, return volatility, and analyst forecasts: A study using content analysis. The Accounting Review, 84(5), 1639–1670.
- Kothari, S. P., & Sloan, R. G. (1992). Information in prices about future earnings. Journal of Accounting and Economics, 15(2–3), 143–171.
- Larcker, D. F., & Rusticus, T. O. (2007). Endogeneity and empirical accounting research. European Accounting Review, 16(1), 207–215.
- Lawrence, A. (2013). Individual investors and financial disclosure. Journal of Accounting and Economics, 56(1), 130–147.
- Lee, Y.-J. (2012). The effect of quarterly report readability on information efficiency of stock prices. Contemporary Accounting Research, 29(4), 1137–1170.
- Lehavy, R., Li, F., & Merkley, K. (2011). The effect of annual report readability on analyst following and the properties of their earnings forecasts. The Accounting Review, 86(3), 1087–1115.
- Li, F. (2008). Annual report readability, current earnings, and earnings persistence. Journal of Accounting and Economics, 45(2–3), 221–247.
- Miller, B. (2010). The effects of reporting complexity on small and large investor trading. The Accounting Review, 85(6), 2107–2143.
- Ohlson, J. A., & Juettner-Nauroth, B. E. (2005). Expected EPS and EPS growth as determinants of value. Review of Accounting Studies, 10(2–3), 349–365.
- Ronda-Pupol, G. A., & Guerras-Martin, L. A. N. (2012). Dynamics of the evolution of the strategy concept 1962–2008: A co-word analysis. Strategic Management Journal, 33(2), 162–188.
- Rutherford, B. A. (2005). Genre analysis of corporate annual report narratives: A corpus linguistics-based approach. Journal of Business Communication, 42(4), 349–378.
- Smith, J. E., & Smith, N. P. (1971). Readability: A measure of the performance of the communication function in financial reporting. The Accounting Review, 46(3), 522–561.
- Smith, M., & Taffler, R. J. (2000). The chairman’s statement - A content analysis of discretionary narrative disclosures. Accounting, Auditing & Accountability Journal, 13(5), 624–647.
- Stocken, P. C. (2000). Credibility of voluntary disclosure. The RAND Journal of Economics, 31(2), 359–374.
- Subramanian, R., Insley, R. G., & Blackwell, R. D. (1993). Performance and readability: A comparison of annual reports of Profitable and Unprofitable Corporations. Journal of Business Communication, 30(1), 49–61.
- Verrecchia, R. E. (1983). Discretionary disclosure. Journal of Accounting and Economics, 5, 179–194.
- Vuolteenaho, T. (2002). What drives firm-level stock returns? The Journal of Finance, 57(1), 233–264.
- Wang, C. (2015). Measurement errors of expected-return proxies and the implied cost of capital. Working Paper, Harvard University.
- Wang, C. (2017). Commentary on: Implied cost of equity capital estimates as predictors of accounting returns and stock returns. Journal of Financial Reporting, 2(1), 95–106.
- You, H., & Zhang, X. (2009). Financial reporting complexity and investor underreaction to 10-K information. Review of Accounting Studies, 14(4), 559–586.
- Zhang, S., & Aerts, W. (2015). Management’s performance justification and failure to meet earnings thresholds. Accounting and Business Research, 45(6–7), 841–868.
Appendix 1.
Details on the Construction of Discindex
Discindex involves the aggregation of the fractional ranks of eight sub-indices. The following formal definitions apply to the eight sub-indices included in Discindex:
− Perf equals the number of words in the management performance commentary section;
− Gov is the number of words in the remuneration and corporate governance sections;
− Restfront equals the number of words in the residual categories, namely CSR, directors’ reports, and risk reports;
− Rearend is defined as the number of words in Financials;
− Fog is defined as Gunning’s (Citation1968) readability index as calculated for the management performance commentary sectionFootnote27;
− Forward is the number of forward-looking keywords in Narratives and Financials;
− Causal equals the number of causal keywords appearing in the management performance commentary section; it proxies for the extent to which management is explaining – rather than simply stating – performance;
− Strategy is a measure of the volume of the strategic content in Narratives; it uses the approach explained in Athanasakou et al. (Citation2019) and is based on a list of 709 strategic content keywords and phrases, extracted from the index of key texts on business strategy and the recent review paper of Ronda-Pupol and Guerras-Martin (Citation2012); for each report it counts the number of times that all the 709 keywords appear in Narratives, excluding the governance and remuneration sections, yielding a vector of 709 word counts; for each keyword it then calculates the Bayes probability of that keyword appearing in a strategy or business model section within the entire set of annual reports; and finally it sums the 709 word count vector weighted by the Bayes probabilities of the 709 keywords yielding the Bayes probability-weighted strategic word count for each report.
Note that the word count and readability measures in the CFIE dataset have been defined by the CFIE project team prior to any estimation in the present paper. The only two measures from the CFIE dataset not included in Discindex are net tone and uncertainty – measures which we interpret as capturing primarily writing style, not volume, textual complexity, or clutter.
The starting point of Discindex is four word counts which, in aggregate, include all the words in all the sections of the annual report. These four word counts are those associated with Perf, Gov, Restfront, and Rearend. The other four components of Discindex are Fog, Forward, Causal and Strategy. We include Fog as a separate component as the prior literature, reviewed in Section 2.2., has shown that investors find annual reports that are more readable more useful. The other three measures are based on word counts relating to forward-looking, causal, and strategic keywords. The decision to include a measure of the volume of the strategic content was driven by policy moves by the FRC to encourage firms to provide narrative content to describe and explain their strategies and business model. The disclosure measures of Botosan (Citation1997) and Grüning (Citation2011) also seek to capture such content. The decision to include a measure of the volume of forward-looking information was driven by prior literature that shows that forward-looking information helps share prices to incorporate value-relevant (earnings) information in a timely manner (e.g., Kothari & Sloan, Citation1992). Our decision to include a proxy for causal statements was driven by intuition that one would expect managers to explain, rather than simply to state, performance. The inclusion of Causal was also motivated by the Zhang and Aerts (Citation2015) findings that firms make greater use of causal language when they fail to meet earnings thresholds.
In operationalizing disclosure indices, a key research design issue relates to the weighting given to each component. In the absence of any prior evidence about the relative importance of the eight components for the cost of equity capital, we decided that equal weighting was the most obvious, and least subjective, weighting scheme. We achieve equal weighting by calculating fractional ranks for each of the eight components and then adding up the fractional ranks. Formally our ranking procedure is defined as follows:
(A1)
(A1)
For each component of the disclosure index Equation (A1) first calculates fractional ranks based on the CFIE sample of 10,391 firm-years. It then sums up the eight fractional ranks to get an overall sum for each firm-year and it takes the percentile rank of this sum. Percentile ranks – like fractional ranks – are based on the CFIE sample of 10,391 firm-years. Converting the sum of fractional ranks into an overall percentile rank implies that Discindex ranges from 0% to 100%. Note that this ranking procedure not only helps to implement equal weighting but also eliminates range (scale) differences between the eight disclosure measures. For example, median CFIE dataset values of 2970, 22, and 59 for Perf, Fog, and Causal are not directly comparable with each other, at least not without ranking. Finally, in Section 5.1., we report untabulated results, which indicate that the U-shaped relation still holds when Discindex and its squared value are replaced by the individual components and components squared, respectively.