
 ?Mathematical formulae have been encoded as MathML and are displayed in this HTML version using MathJax in order to improve their display. Uncheck the box to turn MathJax off. This feature requires Javascript. Click on a formula to zoom.
Abstract
We investigate the development of non-performing loans (NPL) held by European banks along the economic cycle. During the global financial crisis and the subsequent sovereign debt crisis, banks from all European countries experienced a substantial increase in NPLs. We find that these increases are mainly associated with macroeconomic determinants and characteristics of banks’ business models. Substantial differences across countries exist in the duration and efficiency of the NPL resolution after the crisis. We exploit cross-country and time-variant differences in insolvency and contract enforcement procedures to document that the outcome of NPL resolution is associated with the duration and the costs of insolvency and contract enforcement during the economic recovery phase. Our findings suggest that the design of a country’s legal regime can ensure a swift NPL resolution during the recovery phase while the build-up of NPLs during a crisis is mainly attributable to economic conditions.
‘Going into the next downturn with such a high stock of NPLs is simply not an option. And NPLs are not just concentrated in one or two European countries; they are spread across a number of countries and a high number of banks. NPLs remain a European issue, no matter where the banks holding them are located.’
1. Introduction
The global financial crisis and the recent COVID-19 pandemic highlight the importance of banks’ balance sheet resilience.Footnote1 Regulators are most concerned about the build-up of non-performing loans (NPLs) and the corresponding absorption of bank capital (e.g. European Central Bank [ECB], Citation2020; European Commission, Citation2020). When bank borrowers get into arrears during such a period of economic downturn, their loans are recorded as non-performingFootnote2 resulting in a higher risk-weight.Footnote3 In addition, the bank will be required to provision for potential loan losses, thus impairing net income and regulatory capital. Consequently, banks cannot utilize this capital for productive lending and face higher funding costs due to higher risk-weights. This has severe economic consequences, as high NPL-levels can imperil bank stability (Berger & De Young, Citation1997; Bischof et al., Citation2021; Suarez & Sànchez-Serrano, Citation2021; Whalen, Citation1991) and hamstring bank lending and ultimately economic activity (Barseghyan, Citation2010; Beatty & Liao, Citation2011; Granja & Leuz, Citation2020). Therefore, a quick workout of banks’ non-performing loans, especially after an economic downturn, is key to foster lending and maintain bank stability.
While prior literature is relatively clear in explaining the role of macroeconomic conditions and lending decisions for the NPL level of banks (e.g. Beck et al., Citation2013; Betz et al., Citation2020; Breuer, Citation2006; Cerulli et al., Citation2019; Ghosh, Citation2015; Louzis et al., Citation2012; Salas & Saurina, Citation2002), the adequate policy response to prevent an NPL crisis is still an open question (e.g. Angelini et al., Citation2017; Kasinger et al., Citation2021). Against this background, this paper addresses the role of a country’s legal infrastructure, especially its insolvency regulation, and its interaction with the macroeconomic development in the build-up and the resolution of NPLs held by European banks. The legal infrastructure is important because European banks rarely rely on an external workout of their NPLs through securitizations or sales which are subject to substantial legal hurdles in most EU member states (ECB, Citation2015). European banks rather tend to work out their NPL portfolios internally via write-offs, collateral repossession, collateral liquidation, or cash collection (European Banking Authority [EBA], Citation2019). The duration and efficacy of these procedures depend on a country’s legal framework for contract enforcement and insolvency measures. It is an empirical question whether the design of this legal framework is able to mitigate the build-up of NPLs during a downturn and to accelerate the resolution of NPL portfolios during a subsequent upturn, or whether macroeconomic conditions dominate in the determination of banks’ NPL levels. It is also unclear whether the influence of the legal infrastructure varies between the different stages of the economic cycle.
We employ bank and country-level data from 16 European countries to explore this question from two different perspectives. We use bank-level data on NPL ratios for the first part of our analysis and country-level data in the second part. The bank-level data allows us to examine the development of banks’ NPL portfolios during the different stages of the economic cycle and around changes in the legal infrastructure of a given country. The country-level data helps explain the differences in the duration of the build-up as well as the resolution of NPL portfolios across the banking systems in different countries.
On the bank level, we estimate a fixed effects regression model to examine the association between banks’ NPL levels and a country’s legal infrastructure. We measure the quality of a country’s infrastructure by proxies for legal efficiency, which capture the duration and the cost of insolvency as well as other contract enforcement procedures. We control for macroeconomic conditions (i.e. local GDP) and interact the legal efficiency variable with an indicator variable for an upturn period. The interaction term is supposed to capture differences in the impact of legal infrastructure between an economic downturn (when banks build up their NPL portfolios) and an upturn (when banks workout their NPL portfolios).
The empirical identification of the incremental effect of legal infrastructure, and especially the disentangling of the effect from a country’s macroeconomic environment, is challenging. First, the composition of loan portfolios differs across banks and potentially varies over time. These differences determine NPL levels as the sensitivity of loans to macroeconomic changes differs across the types of loans (e.g. consumer loans vs. corporate loans). If changes in loan portfolio composition are correlated with a country’s legal infrastructure, such a change can confound our estimates for the role of legal efficiency. Second, a country’s legal system is correlated with multiple other country-level characteristics (e.g. the quality of bank supervision or, more generally, political stability; Djankov et al., Citation2008; Leuz, Citation2010) and, in the absence of within-country variation, it is notoriously difficult to isolate the causal impact of one single factor (e.g. Becker et al., Citation2021). We address these challenges by exploiting local reforms of insolvency laws during our sample period. In particular, we examine changes in the resolution of NPL portfolios around five major legal reforms that substantially increased the efficiency of insolvency proceedings in Austria, Belgium, France, Estonia, and Latvia. At least to the extent that these legal reforms do not coincide with other changes in factors that also determine banks’ NPL levels, this difference-in-differences approach helps attribute differences in NPLs to countries’ legal efficiency.
On the country level, we use data on the variation in the duration of the periods during which NPLs increase and decrease across countries. To assess the determinants of the duration of NPL cycles, we relate the duration of these two distinct periods to empirical constructs for legal efficiency and economic growth. In this way, we examine whether legal efficiency is associated with (i) the duration of the period of increasing NPLs and (ii) the duration of the period until NPLs start to decrease during an economic recovery. More specifically, we estimate a random-effects logit model to explore the influence of legal efficiency and macroeconomic conditions on the likelihood that a country will reach the NPL peak during or after the global financial crisis. We then compare our estimates with our results for the probability that a country will achieve a decrease in the NPL ratio as a function of time since the onset of an economic recovery.Footnote4
Our findings are twofold. First, our results suggest that the build-up of NPLs in the run-up to an economic crisis and around a recession is highly associated with the macroeconomic environment, i.e. economic growth, and banks’ business models, i.e. their lending decisions. However, legal infrastructure does not have a first-order effect on the increase of banks’ NPL levels during this period.Footnote5 Second, a country’s legal efficiency helps explain substantial cross-country and time-series differences in the resolution and work-out of banks’ NPL portfolios after a recession. Specifically, the NPL resolution (measured from the beginning of an economic upturn) is highly associated with the efficiency of contract enforcement and insolvency measures. We document that this finding holds even when controlling for several bank-specific factors, such as loan portfolio composition, profitability, regulatory capital, and cost efficiency. The association is also confined to the specific proxies for the duration and the costs of insolvency and contract enforcement procedures and cannot be explained by other cross-country differences, such as supervisory power or overall regulatory quality. Exploiting variation in the timing of economic cycles across countries, we thus find legal efficiency to be negatively associated with NPLs during the economic upturn following a crisis.
The difference-in-differences analysis of changes in NPL resolution around legal reforms of insolvency proceedings in specific countries supports the main finding. Our evidence suggests that a legal reform that strengthens restructuring and insolvency procedures can help reduce NPL levels during economic recoveries. The beneficial effect of such legal reforms is most pronounced in countries with a lower degree of legal efficiency ex ante. Taken together, our results provide insights into the economic and legal forces that shape banks’ NPL levels and how these forces change during the economic cycle.
We contribute to the existing literature along two dimensions. First, we add to the broad literature on the determinants of banks’ NPL levels. Prior studies document cross-sectional evidence on the role of different economic and institutional characteristics, both on the bank and the country level (e.g. Barth et al., Citation2004; Behr et al., Citation2010; Berger & De Young, Citation1997; Dimitrios et al., Citation2016; Ghosh, Citation2015; Louzis et al., Citation2012; Podpiera & Weill, Citation2008). Ari et al. (Citation2021) show that the determinants vary over time across different banking crises; Hoshi and Kashyap (Citation2010) present examples from Japan, which suggest that the nature of NPLs can change over time. Our study builds on these results and offers systematic evidence that the determinants of NPLs change along the economic cycle and at a different speed in different countries around the same banking crisis. Consistent with prior literature, the choice of a bank’s business model and macroeconomic conditions play an important role during all stages of the economic cycle. However, the impact of legal efficiency is most pronounced during an upturn when efficient proceedings (e.g. in insolvencies) help resolve NPLs more quickly. In contrast, when macroeconomic conditions deteriorate during a downturn, a country’s legal framework does not play a meaningful role in preventing the build-up of NPL levels.
Second and more generally, we contribute to the literature on the economic consequences of cross-country differences in the legal framework (Djankov et al., Citation2003; Djankov et al., Citation2008) by investigating whether insolvency and contract enforcement incentives are associated with banks’ NPL levels along the economic cycle. Prior literature has shown that the characteristics of a country’s legal framework help explain economic outcomes such as corporate investments (Ponticelli & Alencar, Citation2016), capital market development (Djankov et al., Citation2008), compliance with disclosure rules (Bischof et al., Citation2022), and firm transparency (e.g. Becker et al., Citation2021; Burgstahler et al., Citation2006; Leuz et al., Citation2003). Our results suggest that they also contribute to the efficiency of NPL resolution in the banking sector, thus providing insights into the design of an adequate policy response to an NPL crisis.
2. Conceptual Underpinnings and Empirical Predictions
In general, banks have two options to reduce the volume of their NPL portfolios. First, banks can rely on external workout of NPLs through securitization or sales to specialized investors. Second, banks can internally workout NPLs via write-offs, collateral repossession, collateral liquidation, or cash collection. The external workout is still relatively uncommon in the Eurozone, given the significant legal hurdles that prevent NPL sales in many circumstances (ECB, Citation2015). Therefore, the internal workout of NPL portfolios remains the dominant strategy for European banks (EBA, Citation2019). Against this background, the ability to realize collateral and enforce contracts seems particularly crucial for a successful resolution of NPL portfolios in this environment.
The elevated NPLs in the Eurozone emerged after the global financial crisis and the sovereign debt crisis. Total NPLs in the Eurozone increased up to 958 billion Euro in December 2014. While NPLs declined in the subsequent years to 688 billion Euro in March 2018, this level is still much higher than before the global financial crisis although most European countries have experienced substantial economic growth for multiple years (ECB, Citation2019). Therefore, regulators and supervisors continuously highlight the importance of NPL reductions to ensure the soundness of the banking system and the ECB made NPL resolution a top priority (e.g. ECB, Citation2016; ECB, Citation2017; Economic and Financial Affairs Council [ECOFIN], Citation2017; International Monetary Fund [IMF], Citation2015). In order to find such an adequate policy response to elevated NPL levels, it is key to understand the intertemporal and cross-country determinants of NPLs and NPL cycles.
The existing evidence on the determinants of NPLs documents a negative association between different types of economic growth (e.g. GDP, house prices, employment) and NPLs (e.g. Beck et al., Citation2013; Breuer, Citation2006; Cerulli et al., Citation2019; Ghosh, Citation2015; Salas & Saurina, Citation2002). Other macroeconomic determinants include exchange rates (Beck et al., Citation2013; Klein, Citation2013), foreign lending (Kauko, Citation2012), share prices (Beck et al., Citation2013), lending interest rates (Espinoza et al., Citation2011; Louzis et al., Citation2012), unemployment (Ghosh, Citation2015; Nkusu, Citation2011), and house prices (Bofondi & Ropele, Citation2011; Ghosh, Citation2015).Footnote6 NPLs tend to move in phases (‘NPL cycle’) countercyclical to macroeconomic conditions. That is, NPLs increase in economic downturns and decrease during periods of economic recovery. Empirically, the high correlation between the different macroeconomic indicators makes the identification of single factors challenging and it remains largely unclear whether the impact of the macroeconomy varies along the economic cycle (Ari et al., Citation2021, suggest that the factors vary across different banking crises over time).
In contrast to the general countercyclicality of NPLs, we observe a more nuanced relationship between economic growth and NPLs after the 2008 financial crisis in Europe. While all countries in the Eurozone experienced an increase in NPLs during the crisis, some countries built up highly persistent NPLs that banks were not able to significantly reduce even during the following economic recovery. Therefore, it seems unlikely that economic growth alone symmetrically determines NPLs along the entire economic cycle.
There are two non-mutually exclusive explanations for this phenomenon. First, it could be that bank-specific factors, such as loan portfolio composition, profitability, regulatory capital or size are the main enabler of swift NPL resolution while macroeconomic factors mainly determine how NPLs build up. For instance, Berger and De Young (Citation1997) document that decreases in cost efficiency are reflected in higher NPLs, plausibly because excess expenditures for the monitoring of bad loans are indicative of worse monitoring and underwriting practices. The findings also show the presence of moral hazard issues for weakly capitalized banks that respond to asset quality deteriorations with an increase in risk-taking. Behr et al. (Citation2010) and Salas and Saurina (Citation2002) provide evidence of a negative association between bank size and NPLs, likely as a result of better diversification opportunities. Bank profitability is also frequently associated with lower NPLs (Louzis et al., Citation2012; Salas & Saurina, Citation2002).
Second, the resolution of NPLs could be shaped by country-specific incentives that go beyond pure economic growth. In particular, incentives that enable a quick NPL workout process could change how NPLs develop during economic recoveries.Footnote7 For example, Barth et al. (Citation2004) find a weakly significant and negative association between private monitoring, strict capital requirement regulations and NPLs. Agoraki et al. (Citation2011) show a similar pattern for supervisory power, and Breuer (Citation2006) for off-balance sheet disclosure rules. D'Apice et al. (Citation2021) explore the effects of four contract enforcement reforms between 2008 and 2011 on banks’ impaired loans. For the particular case of Italy, Jappelli et al. (Citation2005) show that judicial efficiency (the length of the contract enforcement process and the backlog of cases at regional courts in Italy) helps explain differences in NPL levels for a sample of Italian districts.
Along these lines, policy makers and regulators recognize that a successful NPL resolution strategy will include insolvency and judicial frameworks that allow cost and time efficient NPL workouts (e.g. ECB, Citation2016; ECOFIN, Citation2017). Although countries in the Eurozone have harmonized rules for contract enforcement and insolvency procedures, the enforcement of these rules still depends on the local legal system, with the speed and integrity of the local courts being key determinants of legal efficiency (Djankov et al., Citation2003). Judicial inefficiencies, such as weak frameworks for corporate and household insolvencies, lead to slow recovery of collateral and, thus represent a major risk for creditors that delays banks’ NPL resolution (ECB, Citation2016).
The effect of legal efficiency on NPLs is twofold. First, efficient debt enforcement and insolvency procedures can deter loan defaults ex ante by incentivizing the borrowers to pay back the loan and go through timely restructuring procedures. Legal systems differ in this regard, with some countries (e.g. Slovenia and Spain) having out-of-court mechanisms in place that allow fast restructuring procedures at fairly low costs and other countries (e.g. Greece and Portugal) completely lacking these mechanisms, relying only on liquidation. Second, borrowers often secure loans with collateral. If the collateral cannot be realized by the bank, because of lengthy and expensive foreclosure procedures, this deters NPL resolution and limits new bank lending (Haselmann et al., Citation2010). Even in normal times, the speed and the costs of insolvency and contract enforcement procedures vary significantly across countries (Djankov et al., Citation2003). Most countries rely on court decisions, for example, for home foreclosures, with substantial variation in actual length and costs and only few countries provide opportunities for efficient and simple out-of-court procedures for contract enforcement. Legal efficiency also captures other means that potentially influence banks’ NPL levels, such as the existence of partial debt-servicing schemes, pre-packaged restructuring and insolvency procedures, the appointment of specialized judges at specialized courts, and fixed time limits for the procedures.
We expect that the influence of legal efficiency is likely not uniform along the economic cycle. While legal efficiency could reduce moral hazard issues between banks and borrowers ex ante, it is unlikely to mitigate increasing loan defaults and the building up of NPLs during economic recessions. We expect that the ex ante effect of legal efficiency should be rather limited in a sudden economic recession that leads to substantially higher loan defaults irrespective of potential moral hazard frictions ex ante. We rather expect that legal efficiency has a major impact during the post-crisis recovery periods when economic growth picks up. At this point during the cycle, efficient insolvency and contract enforcement procedures can help banks to timely seize the collateral attached to the non-performing loan or, in case of unsecured borrowings, enable the bank to timely write off the proportion of the loan for which it could not collect the remaining proceeds. Overall, an efficient legal system likely accelerates NPL reductions by facilitating the workout of the existing NPL stock during the economic recovery after a crisis, whereas the ex ante effect of legal efficiency on borrower selection should be equally relevant during both phases of the NPL cycle by mitigating moral hazard issues.Footnote8
This leads us to the following two empirical predictions:
Prediction 1: Macroeconomic conditions determine changes in banks’ NPL levels during the entire economic cycle.
Prediction 2: The efficiency of a country’s legal infrastructure has a positive effect on the workout of banks’ NPL portfolios during the economic recovery and beyond the macroeconomic development.
3. Data
We use two different data sets for our analyses. First, we employ annual bank-level information from S&P Global Market Intelligence (formerly SNL Financial). In contrast to most prior research on NPLs in Europe, we build on a dataset that includes actual NPLs and not only impaired loans (e.g. as provided by Bankscope). Although impaired loans are potentially a valid proxy of NPLs, they reflect an accounting concept (e.g. IAS 39 during our sample period) with substantial discretion (e.g. Liu & Ryan, Citation2006), whereas NPLs are a supervisory construct (Regulation EU No 680/2014). For example, while the ECB definition of NPLs includes all loans that are 90-days past due and the debtor is unlikely to pay (ECB, Citation2017), the accounting definition of impaired loans during our sample period (IAS 39) requires a specific ‘trigger event’ indicating that the loan will not be repaid in full. Therefore, the supervisory-related definition of NPLs avoids biases from reporting incentives that are inherent to accounting-based definitions.Footnote9
The final bank-level sample includes all bank-years with available data on the macro-level variables (GDP and legal efficiency) as well as the bank-level controls (tier 1 regulatory capital, total assets, loan volume, cost-to-income, return on assets). We winsorize all continuous variables at the 1% and 99% level. The sample period is from 2007 to 2016.Footnote10 We end up with a maximum of 13,550 bank-level observations and 2,434 distinct banks. In addition, we use a subsample of banks with available data on the composition of their loan portfolio, that is, information on corporate and retail loan exposure. Due to data constraints in the S&P database, this sample comprises 1,087 bank-year observations and 174 distinct banks.
In addition to bank-level data, we collect aggregate country-level data on NPLs from the World Bank Global Financial Development Database, which is derived from the yearly Global Financial Stability Report published by the IMF. We include all 16 Eurozone countries from the bank-level analysis in our country-level sample when information on macroeconomic growth and the legal efficiency measures are available for a sample year. The final country-level dataset from 2007 to 2016 includes 149 country-year observations.
4. Research Design
4.1 OLS Panel Regression
We evaluate the development of NPLs from two perspectives. First, we analyze the determinants that are associated with NPL ratios during different economic periods. We start with a bank-level fixed effect regression that exploits cross-country variation in legal efficiency over time. Second, we explore in a country-level random effects logit model whether the determinants of NPLs are consistently correlated with the duration of the increasing and the subsequent decreasing phase of the NPL cycle.Footnote11 To strengthen causal identification, we corroborate our results in a difference-in-differences regression by exploiting time-series variation in legal efficiency within select sample countries that undertake major reforms of their insolvency laws.
We first explore on the bank level whether macroeconomic conditions, bank-specific characteristics and cross-country differences in legal efficiency are associated with the level of banks’ NPL holdings along the economic cycle. Therefore, we estimate the following fixed-effect OLS model:
(1)
(1)
The dependent variable NPL Ratio is a bank’s non-performing loans divided by gross loans. GDP is the gross domestic product in the bank’s country of domicile and obtained from the World Bank. Furthermore, we employ data on legal efficiency measures related to insolvency and contract enforcement procedures from the annual World Bank Doing Business reportFootnote12 (Djankov et al., Citation2003; Djankov et al., Citation2008). The World Bank collects this data from own research, supplemented with data from central banks and the Economist Intelligence Unit. We use three sets of proxies for Legal Efficiency. First, we use individual binary variables that are time-invariant and take the value of ‘1’ for countries that have below median Insolvency Durations, Insolvency Costs, Contract Enforcement Durations, Contract Enforcement Costs, and Loss Given Default. Second, we build a composite High Legal Efficiency variable that takes the value of ‘1’ if the sum of all individual scores is above the median. Third, we build a time-varying legal efficiency measure. If a country is above the median score for the individual legal efficiency measures in a given year the score increases by ‘1’. Thus, Legal Efficiency (time-variant) takes a value between ‘0’ and ‘5’ varying over time and across countries.
We examine whether the coefficient estimates for GDP and Legal Efficiency vary along the economic cycle and, thus, interact both variables with a Recovery indicator (i.e. a binary variable taking the value of ‘1’ beginning from the first year during which a country enters into a period of economic expansion with positive GDP growth for at least three consecutive years after 2009). Note that, as our measure of Recovery is based on GDP growth, we employ GDP levels in this specification to measure the influence of economic output on NPLs.Footnote13 The fixed-effects structure with bank and year fixed effects turns GDP into a measure of within-bank (or within-country) changes that are not explained by common shocks in a given year.Footnote14 Controls denote the following firm-level control variables: Retail / Corporate Lending is the ratio of a bank’s volume of retail lending to corporate lending volume. The variable is supposed to capture differences in bank loan portfolio composition. Size is the natural logarithm of a bank’s total assets. ROA is the percentage of a bank’s net income to total assets as a measure of bank profitability. Tier 1 is the percentage of a bank’s tier 1 capital to its risk-weighted assets. Cost–Income is the percentage of operating expenses to operating income as a measure of bank efficiency. Loan Ratio is the ratio of a bank’s total gross loans to total assets.
We include year- and firm-fixed effects, which account for the general time trend as well as time-invariant bank and country characteristics (e.g. the overall quality of the legal system or the development of capital markets). As such, our fixed-effects structure subsumes factors that are specific to a certain year or a particular bank. We rely on a fixed-effects model to deal with unobserved heterogeneity and omitted variables instead of a dynamic panel model that includes the lagged dependent variable because we are particularly interested in the differential correlations between legal efficiency and NPLs that build up with relative persistence during an economic downturn and decrease during an economic upturn.Footnote15
In the next step, we explore whether legal efficiency and economic growth influence the duration of NPL cycles on the country level. We test whether economic growth and legal efficiency are associated with (i) the probability of reaching the maximum NPL ratio as a function of time since the start of the sample and (ii) the probability of achieving a decrease in the NPL ratio as a function of time since the start of an economic recovery after the global financial crisis.Footnote16
We employ a logit regression in our first specification which is frequently applied in discrete-time survival analysisFootnote17 to estimate probabilities or risks (e.g. Beatty & Liao, Citation2014; Maskara & Mullineaux, Citation2011). To account for unobserved heterogeneity (often referred to as ‘frailty’ in survival analysis) between firms, we fit the following random effects logit regression:
(2)
(2)
where Pr(Duration of NPL increase) is (i) the probability of reaching the highest NPL ratio from the beginning of the sample period (ii) the probability of achieving the first NPL ratio decrease from the start of an economic recovery onwards. The NPL ratio is the percentage of non-performing loans divided by gross loans. Economic Growth is gross domestic product growth obtained from the World Bank. The definition of Legal Efficiency is equivalent to our firm-level analyses.
4.2 Empirical Identification Issues
In our main specification, the empirical identification of any causal effects of a country’s legal efficiency is very challenging. Like most constructs that are measured on the country level, legal efficiency plausibly overlaps other characteristics of local institutions and the economic environment. Many of these characteristics complement each other and it is notoriously difficult to isolate the economic consequences of a single factor such as legal efficiency. To add more confidence to our main results, we extend the evidence in the next step and use five major legal reforms that were adopted at different times in different sample countries and that likely increased the efficiency of local insolvency proceedings. These changes in national legal efficiency enable us to estimate a difference-in-differences model.
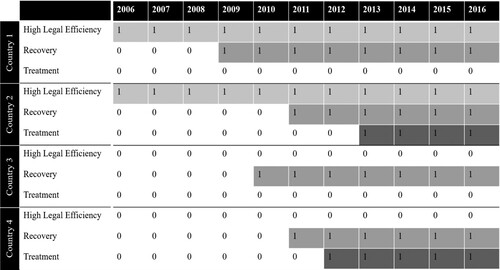
Our empirical strategy has three building blocks: first, variation in the timing of the legal reforms; second, variation in the timing of the recovery periods; and third, the fixed effects accounting for unobserved heterogeneity on the firm and year level. Our treatment group thus comprises banks from countries in which the level of legal efficiency changes in different years during the post-crisis recovery period, while our control group includes banks from countries with a constant level of legal efficiency during all stages of the economic cycle. The countries in the treatment group have a different level of legal efficiency (high vs low) prior to the reforms. Figure illustrates our identification strategy for this analysis.
Figure 1. Identification Strategy. Figure illustrates our identification strategy for the NPL ratio effects of changes in legal efficiency. The figure illustrates the identification strategy with our three variables of interest. High Legal Efficiency is a binary summary score that takes the value of ‘1’ for countries that have an above the median legal efficiency score. Recovery is a binary variable that takes the value of ‘1’ beginning in the first year that the country enters a period of three years consecutive GDP growth. Treatment is a binary indicator variable that takes the value of ‘1’ for firm-years after a reform of the insolvency framework took place.
We exploit five major legal reforms that significantly changed the insolvency law in the respective countries during their economic recovery period (Austria, Belgium, Estonia, France, Latvia).Footnote18 Major elements of the reforms included, among others, the introduction of specialized insolvency courts (France), the facilitation of out-of-court proceedings (France) and of restructuring procedures (Austria, Belgium, Latvia, Estonia), the strengthening of creditor rights (Austria, Belgium, France), the easing of asset liquidations (Latvia), and measures to reduce the cost and duration of personal insolvencies (Latvia). We provide a detailed overview of these legal reforms in our Online Appendix, Table OA-3. Our research did not reveal any systematic pattern of concurrent legal reforms in these five countries around the different adoption dates of their insolvency reforms. We estimate the following difference-in-differences regression:
(3)
(3)
To avoid triple interaction terms, we follow Christensen et al. (Citation2013) and include two separate non-overlapping indicators for (1) the post-reform period of high legal efficiency countries (β6) and (2) the post-reform period of low legal efficiency countries (β7).Footnote19 Splitting the treatment effect into disjunct groups allows an easier interpretation of the group effects compared with an interaction model that relies on both main and interaction effects. We define all other variables as in our cross-sectional bank level tests in equation Equation(1)
(1)
(1) . Like in our other analyses on the bank-level, we include year- and firm-fixed effects to account for the general time trend as well as time-invariant bank and country characteristics. As such, our fixed-effects structure subsumes factors that are specific to a certain year or a particular bank. Therefore, the coefficient estimate for β6 (β7) captures the difference in NPL levels of banks in our treatment countries with a high (low) legal efficiency score between the periods before and after the local reform during the recovery period and compared to banks in countries that were not yet or never treated (see Figure for an illustration). Note that the recovery periods start at different points in time as do the legal reforms in the different countries. Therefore, the results of this analysis do not simply pick up a potential time trend. For an alternative explanation to remain valid, any country-level factor that potentially confounds legal efficiency would need to change at about the same time in the five different countries (i.e. follow the same unique time pattern). This is much less plausible than the existence of simple correlations between country-level factors that could confound our findings in the main specification. Figure OA-1 (online appendix) also addresses this concern and documents that there is no significant difference in pre-treatment trends between our treatment and control group, rendering a strategic selection of countries in the treatment group based on their previous NPL levels implausible.
In all our tests, we draw statistical inferences based on robust standard errors clustered by country to adjust for time-series correlation within countries (Petersen, Citation2009).
5. Empirical Results
5.1. Descriptive Statistics
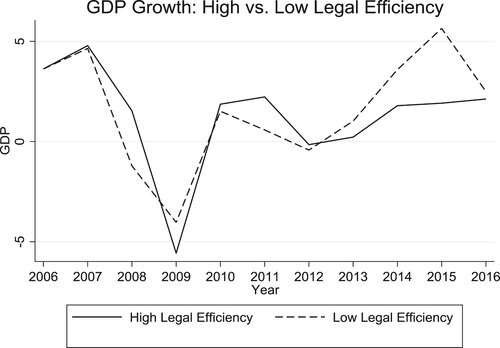
We start with a descriptive analysis of NPLs across countries. Figure plots the NPL ratios of countries with high and low legal efficiency relative to their NPL peak. We show the scaling relative to the NPL peak because countries reach the NPL peak in different years. The graph provides two descriptive insights. All countries follow a similar NPL growth trajectory in the period before the NPL peak although high legal efficiency countries have slightly lower NPL growth three and two years before the peak. More importantly, we also observe that high legal efficiency countries have a substantially steeper negative slope after the NPL peak indicating a faster reduction in NPLs compared to countries with low legal efficiency. An obvious concern from this descriptive observation is that the NPL development could be a reflection of different economic growth patterns across countries that we capture with our legal efficiency measure. However, when depicting national GDP growth and legal efficiency in Figure , we document relatively similar economic growth patterns across the two subgroups of countries. Therefore, it seems unlikely that the cross-country variation in NPL reductions after the global financial crisis is solely attributable to differences in economic growth.
Figure 2. NPL Ratios and GDP Development for High vs. Low Legal Efficiency Countries. Figure shows the NPL Ratio relative to the NPL peak of high vs. low legal efficiency countries during the sample period from 2006-2016. NPL Ratios are normalized to zero in the calendar year when a country reaches the highest NPL ratio. The x-axis shows the calendar years relative to this benchmark period. High Legal Efficiency is a binary summary score that takes the value of ‘1’ for countries that have an above the median legal efficiency score. The legal efficiency score consists out of five individual legal efficiency measures: Insolvency Duration, Insolvency Cost, Contract Enforcement Cost, Contract Enforcement Duration, and Loss Given Default that take the value of ‘1’ if a country is below the median during the sample period.
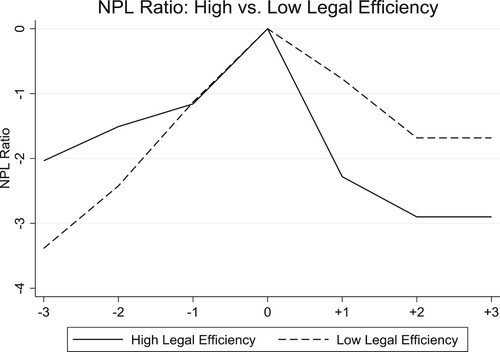
Figure 3. GDP Development for High vs. Low Legal Efficiency Countries. Figure shows the GDP growth development over the sample period from 2006–2016 for high and low legal efficiency countries. GDP is the annual GDP growth in percentage points. High Legal Efficiency is a binary summary score that takes the value of ‘1’ for countries that have an above the median legal efficiency score. The legal efficiency score consists out of five individual legal efficiency measures: Insolvency Duration, Insolvency Cost, Contract Enforcement Cost, Contract Enforcement Duration, and Loss Given Default that take the value of ‘1’ if a country is below the median during the sample period.
Additional descriptive statistics in Table , Panel A confirm that the average NPL ratio varies greatly across countries. The average NPL ratio by country is 6.7% and ranges between 3.6% in Germany and 19.3% in Lithuania. Panel B documents that our bank-level sample is representative for the respective countries and comparable to prior research. In Panel C we show pairwise correlations between NPLs, GDP, bank-specific variables, and legal efficiency. NPLs are negatively correlated with legal efficiency, GDP and the performance of the bank (RoA) while they are positively correlated with the loan ratio.
Table 1. Descriptive statistics and pairwise correlations
Overall, we conclude that while both high and low legal efficiency countries follow similar patterns in the increasing phase of the NPL cycle, countries that achieve timelier reductions in NPLs are characterized by a more efficient legal system. We aim to support this conjecture in the next section with a more formal analysis.
5.2. Determinants of NPLs in Different Economic Cycles
We begin our analysis by estimating whether bank specific factors, legal efficiency and macroeconomic growth are associated differently with NPLs during economic recoveries in Table , Panel A. Our main result in column (1) indicates that banks in high legal efficiency countries have on average 6.7 percentage points lower NPL ratios compared to banks in low legal efficiency countries during recovery periods (p-value < 0.01). Furthermore, we document in column (1) that countries with a 1bn Euro higher GDP have on average a 1.3 percentage points lower NPL ratio (p-value < 0.01). In addition, recovery periods are on average associated with 3.4 percentage points higher NPL ratios (p-value < 0.05). This is consistent with the idea that banks enter the recovery period with elevated NPL ratios that get resolved in the following periods. In line with prior literature, the signs of the coefficient estimates for our control variables indicate that banks with higher profitability, higher tier 1 ratios, higher loan ratios and higher cost–income ratiosFootnote20 are associated with lower NPL ratios on average.
Table 2. T ic growth on NPL ratios over the business cycle
We vary the research design in columns (2)-(5) to address different concerns about the results from the main specification. We start in column (2) by adding an additional control variable for the ratio of corporate loans to retail loans to ensure that the different NPL trajectory is not driven by changes in banks’ lending portfolios. Although the sample is smaller in this specification, it is much more balanced across countries. Our inference in Column (2) remains robust. Banks in high legal efficiency countries are on average associated with 6.9 percentage points lower NPL ratios during recovery periods. Column (3) adds firm x period fixed effects splitting the firm fixed effect into two distinct time periods to further control for changes in unobserved firm heterogeneity that might change during the sample period.Footnote21 For example, banks could choose a different composition of their loan portfolios during the early and the late sample period and this difference could also explain a change in NPL levels. Our results confirm the negative association between legal efficiency and NPL ratios during economic recoveries, although the coefficient is slightly smaller (0.041, p-value < 0.05). Column (4) excludes Italy and Germany (the two largest countries in our sample) to address concerns about the imbalance of our initial sample and support the generalizability of our results. The effect size is identical to Column (1) although the statistical significance is slightly lower (p-value = 0.029). Column (5) presents the results for the exclusion of Italy and Germany when also adding firm x period fixed effects. The effect size in this most conservative specification is slightly smaller with on average 4.1 percentage points lower NPL ratios for high legal efficiency countries during economic recovery periods (p-value = 0.029).
In the next step of our empirical analysis, we employ our country-level dataset to explore the influence of legal efficiency and economic growth for the duration of the increasing and the decreasing period of the NPL cycle. The first period spans from the start of the sample in 2007 until the country reaches its highest NPL ratio (NPL increasing phase). The second period runs from the start of an economic recovery (positive economic growth in three consecutive years after 2009) until the bank decreases its NPL ratio for the first time. We then explore whether the duration of these two periods is driven by identical factors.
Table , Panel B, column (3) documents that the odds-ratio of ending an increasing NPL phase is on average approximately 1.7 times higher when GDP growth increases by 1 percentage point (p-value < 0.001) while the influence of legal efficiency during the period of increasing NPLs is insignificant. However, column (6) shows that the odds ratio of high legal efficiency countries entering period of decreasing NPLs during an economic recovery is almost 10 times higher than for low legal efficiency countries (p-value = 0.005). Furthermore, higher GDP growth does on average not significantly increase the likelihood of entering a period of decreasing NPLs during economic recoveries.
5.3. Changes in Legal Efficiency
To provide a more textured picture and to explore the role of legal efficiency in greater detail, we continue our analyses with employing a continuous measure for legal efficiency.
The results in Table , Panel A, corroborate our findings from the time-invariant cross-sectional analysis of legal efficiency. Column (1) documents a negative association between GDP and NPL ratios. Column (2) indicates that changes in legal efficiency are negatively associated with NPLs. In addition, Column (3) shows that legal efficiency has on average a significantly negative association with NPL ratios during recovery periods. An increase in our legal efficiency score by 1 point during a recovery period is on average associated with a 1.3 percentage points lower NPL ratio (p-value < 0.001). That is, our inference supports the findings from our main tests by documenting that changes in legal efficiency have an incremental effect on NPLs during recovery periods. We also find some evidence that legal efficiency already plays a role during the period of increasing NPLs. On average, NPL ratios are 1.5 percentage points lower for an increase by 1 point in our legal efficiency score during this period.
Table 3. Time-series variation in legal efficiency
We confirm these results in our country level logit model when analyzing the duration of the periods of increasing and decreasing NPLs. Table , Panel B, column (3), shows that a change in legal efficiency during the NPL upbuilding phase is not significantly associated with the duration of the NPL increase. Column (6) shows that the odds of achieving an NPL decrease in a recovery period are 2.39 times higher if the legal efficiency score increases by 1 point (p-value < 0.01). Even though time-series changes in legal efficiency offer a better identification compared to a measure that varies only cross-sectionally, we caution that this analysis is still rather descriptive. To strengthen our inference, we continue our analysis with a difference-in-differences analysis in the next step.
5.4 Difference-in-Differences Analysis Around Legal Reforms
We proceed by exploiting five legal reforms that increased the legal efficiency of the affected countries to explore in a difference-in-differences analysis whether changes in legal efficiency are associated with incrementally lower NPL ratios during economic recoveries. Table presents the results from our estimation of equation Equation(3)(3)
(3) .
Table 4. Difference-in-differences analysis of legal reforms
Table , column (4) shows that banks in low legal efficiency countries experiencing a legal efficiency increasing reform during the recovery period are on average associated with 13.5 percentage points lower NPL ratios in the post-reform period. Note that this effect is relative to (i) the NPL levels during the recovery periods before the reform and (ii) NPL levels in non-treated countries after the reform. Since the recovery periods start at different points in time and treatment countries adopt the reforms in different years, these results do not simply pick up a potential time trend. While there is no significant incremental treatment effect for high legal efficiency countries, banks without a treatment in high legal efficiency countries are still associated with on average 6.2 percentage points lower NPL ratios during recovery periods compared to untreated (or not yet treated) banks in low legal efficiency countries; i.e. the main effect for high legal efficiency countries persists. These countries apparently just gain less from a reform. The effect size for the low legal efficiency countries seems plausible, given the scope of these legal reforms. Overall, the results from the difference-in-differences analysis confirm our inference that legal efficiency plays an incrementally important role during economic recovery periods. Furthermore, we add to our cross-sectional findings by documenting that a legal reform that increases the efficiency of insolvency proceedings offers benefits especially for countries with low legal efficiency ex ante.
5.5. The Role of Contract Enforcement and Insolvency Proceedings for NPLs in Different Economic Cycles
We continue with a closer examination of the associations between the different individual proxies for legal efficiency and NPL ratios. For these additional cross-sectional tests, we decompose our main legal efficiency measure and replace the binary variable in equation Equation(1)(1)
(1) with the five individual partitioning variables.
Table , Panel B, columns (1)–(4) show that low Insolvency Duration, Insolvency Cost, Enforcement Duration, and Enforcement Cost are all significantly negative associated with NPLs in recovery periods (coefficients between −0.041 and −0.085, p-values between 0.000 and 0.066). Column (1) documents that banks in countries with a below median insolvency duration are associated with NPL ratios that are on average 4.1 percentage points lower (p-value < 0.1) during recovery periods compared to banks in countries with above median insolvency duration. The coefficient estimate shows a 4.8 percentage point decrease for countries with low insolvency costs (column [2]), an 8.5 percentage point decrease for countries with short contract enforcement duration (column [3]), and a 4.8 percentage point decrease for countries with low contract enforcement cost (column [4]). Only one of our five proxies for legal efficiency ‘Loss Given Default’, which measures the average amount recovered during insolvency procedures, is not significantly associated with NPL ratios during recovery periods on an individual basis (see column [5]).
Table 5. Decomposition of the legal efficiency measure
Taken together our results confirm the hypothesis that insolvency and contract enforcement procedures are significantly associated with NPL ratios and that this association is confined to economic recovery periods.Footnote22
5.6. Robustness Tests
In the last step of our analysis, we perform several robustness tests to ensure the validity of our results. The results are reported in our Online Appendix, Table OA-2. We show that the incremental association between legal efficiency and NPLs in economic recovery periods remains robust even when controlling for various proxies of supervisory power, overall regulatory quality, governance, and political stability.
6. Conclusions
This paper presents evidence on the determinants of banks’ NPL portfolios at different stages of the economic cycle. In particular, we examine whether the importance of macroeconomic, bank-specific, and legal factors differs between periods of economic downturn and economic expansion. Using bank-level data on NPLs, we first estimate the determinants of NPL levels during these two periods. We distinguish between macroeconomic conditions (i.e. GDP growth), a country’s legal infrastructure and other controls for a bank’s business model (e.g. loan portfolio composition). Our results suggest that the impact of macroeconomic conditions does not significantly vary along the economic cycle. These economy-wide factors, together with a bank’s business model, help explain both the build-up of NPLs during the crisis and the resolution during the recovery period.
While bank-level variables and macroeconomic conditions help explain the level of banks’ NPL holdings at all stages of the economic cycle, the efficiency of a country’s legal system does not play a meaningful role for the build-up of NPLs during a crisis. However, business model and macroeconomy do not subsume the incremental effect of legal efficiency during economic recovery periods. We find that the lower costs and higher efficiency of insolvency and contract enforcement proceedings are the most important factors of a country’s legal infrastructure and enable banks to swiftly workout their NPL portfolios after a crisis. To strengthen the empirical identification of this effect, we exploit major legal reforms that have increased the efficiency of insolvency proceedings in five sample countries at different points in time. The evidence from this difference-in-differences analysis supports the conjecture that improvements in the legal efficiency are key policy tools to improve and accelerate the resolution of banks’ NPL portfolios and thus strengthen the banking system in post-crisis periods. The potential for a beneficial effect of these reforms is most pronounced in countries with a low level of legal efficiency ex ante.
These findings can help inform regulators, policymakers and supervisors when addressing high NPL levels in the future. This seems of particular relevance against the backdrop of the recent economic downturn during the COVID-19 pandemic that will likely result in NPL increases in future periods. Policymakers, in particular, should carefully evaluate the recent insolvency reforms during the pandemic such as the temporary suspension of the filing obligation (e.g. in Germany, Austria, France, Spain, and the Czech Republic). This temporary suspension can lead to an accumulation of insolvency filings after the end of the grace period swamping the courts. The resulting inefficiencies will halt the workout of NPLs and present a potential threat to the stability of the banking system that bank supervisors alone will not be able to overcome.
Studies on cross-country differences in the legal framework have natural limitations. First, while we can rule out several alternative explanations related to confounding country characteristics, our analyses are partly descriptive and potentially not fully able to pin down causal economic effects. While we also study changes in the rather persistent legal framework in Europe, we interpret these results with caution because reforms occur mostly infrequently and in highly idiosyncratic situations. Second, we do not offer evidence on other policy tools that are potentially suitable to improve the workout of NPLs. Some of these tools have simply not been in frequent use in our sample countries. For example, external sales of NPL holdings to specialized investors offer conceptual benefits over internal workouts but are subject to considerable legal restrictions. That is, we are not able to benchmark the costs and benefits of changes to legal efficiency and the insolvency framework against other potential reforms that could foster NPL reductions during crisis periods. While our results suggest that changes in these legal institutions can have a meaningful impact on post-crisis NPL resolution, other reforms might be less costly to implement for policy makers.
Online_Appendix.pdf
Download PDF (204.6 KB)Disclosure statement
No potential conflict of interest was reported by the author(s).
Data Availability
Data are available from the public sources cited in the text.
Supplemental data
Supplemental data for this article can be accessed http://doi.org/10.1080/09638180.2022.2071960.
Additional information
Funding
Notes
1 Accepted by Pepa Kraft. We thank two anonymous reviewers, Rimmy Tomy (discussant), Nico Lehmann (discussant), Holger Daske, and seminar participants at the 2021 European Accounting Review Conference, LMU Munich, University of Mannheim, University of Zurich, and the TRR Accounting for Transparency conference for very helpful comments. We thank Xiaodong Chi, Oriana Delessert, Patrick Hamann, Alessio Pacifico, Marc Philipp, Luca Poidinger, Corinne Schönholzer, and Bastian Stundebeek for excellent research assistance. Jannis Bischof and Nicolas Rudolf gratefully acknowledge funding from the German Research Foundation (DFG) under the CRC TRR 266 program (‘Accounting for Transparency’), Project ID 403041268. Additional materials are available in an online supplement at the journal’s Taylor and Francis website.
2 While there is no universal definition of a non-performing loans, we follow the definition of the ECB which requires banks to record a loan as non-performing if the borrower is 90-days past due, and the borrower is unlikely to pay the obligation back in full (ECB, Citation2017).
3 Under Basel 3, NPLs are subject to a risk weight of 150 percent when applying the standardized approach.
4 We present a similar analysis of the firm-level duration of these periods in our online appendix (Table OA-1).
5 Of course, legal infrastructure is correlated with economic growth (e.g., Djankov et al., Citation2008) and can as such have a potential second-order effect. We do not examine this interrelation in this paper.
6 The evidence is largely consistent across many different geographic settings such as the US (Ghosh, Citation2015), Spain (e.g., Salas & Saurina, Citation2002), Italy (Bofondi & Ropele, Citation2011; Cucinelli, 2015; Japelli et al., 2005), Japan (Mamatzakis et al., Citation201Citation6), India (Ghosh, Citation2007), Greece (Louzis et al., Citation2011), the Czech Republic (Podpiera & Weill, Citation2008), Romania (Filip, Citation2014), the Gulf area (Espinoza & Prasad, Citation2011), and Eastern Europe (Agoraki, Citation2011; Klein, Citation2013), underscoring the generalizability of the finding.
7 The conjecture that determinants of NPLs change across economic cycles is further supported by anecdotal evidence from Japan; see Hoshi and Kashyap (Citation2010).
8 In addition, NPL reductions could be driven by firm-specific incentives such as the financial performance of the bank and the available regulatory capital enabling the bank to write-off loans earlier. We investigate this alternative explanation in our analyses.
9 Consistent with our view, the literature commonly refers to NPLs as a non-discretionary indicator of loan defaults (e.g., Beatty and Liao, Citation2014).
10 In an untabulated analysis, we extend the sample period until 2019 and find statistically and economically similar results.
11 For consistency, we conduct an equivalent random-effects logit analysis on the firm level. We provide these in the online appendix (Table OA-1).
12 The ‘Doing Business’ report was discontinued in response to documentations concerning attempts by Saudi Arabia, the United Arab Emirates, Azerbaijan, and China to influence the rankings in 2018 and 2020 (Reuters, Citation2021). In our empirical tests we rely only on very specific variables from the ‘Doing Business’ report (i.e., several subscores of the business climate ranking). We do not use the overall country rankings that were subject to the alleged manipulation. Furthermore, none of the involved countries is part of our sample.
13 Our inference on the association of Legal Efficiency with the NPL Ratio remains qualitatively and quantitatively similar if we employ GDP growth instead of GDP levels.
14 In untabulated analyses, we show that the findings are not sensitive to replacing the GDP measure by a GDP growth measure (i.e., controlling for changes in growth).
15 In untabulated analyses, we follow the approach by Ghosh (Citation2015) and confirm that our inference is robust to the use of a dynamic panel system-GMM estimation including lagged NPLs as explanatory variable (Arellano & Bover, Citation1995; Blundell & Bond, Citation1998).
16 We define the beginning of an economic recovery as the country’s first year of positive GDP growth after 2009. In addition, we require that this upturn has to be sustained for at least three consecutive years to avoid misclassification of some individual slightly positive growth years as economic recovery. Furthermore, this classification allows us to ensure that every country has only one continuous recovery period after the global financial crisis which fits with the National Bureau of Economic Research’s definition of an economic expansion. All countries in our sample except Greece entered an economic recovery during the sample period.
17 A discrete-time model with a complementary log-log link is an approximation to the Cox proportional hazards model leading to directly comparable coefficients.
18 We started our reform selection process by retrieving all legal reforms during the recovery periods for our sample countries from The World Bank’s ‘Doing Business’ database. This procedure yielded eight reforms that took place in our sample countries and during our sample period. In the next step, we systematically searched for the precise content and evidence of reform effectiveness (the sources include press articles from Google News, practitioner articles, documents from regulators and releases of enforcement agencies). This investigation led to the exclusion of two insolvency reforms that did not lead to material changes in actual insolvency procedures: the personal insolvency reforms in Lithuania (2012) and the Act on the Implementation of Measures to Stabilize the Financial Market in Germany (2011).
19 We can transform equation (3) with interactions in an econometrically equivalent way leading to the same results and inferences by replacing coefficient β6 and β7 with β6 Post Treatment + β7 Post Treatment * High Legal Efficiency
20 This result is in favor of the bad luck hypothesis from Berger and DeYoung (Citation199Citation7). Under the bad luck hypothesis increases in problem loans are caused by exogenous events such as an economic downturn and subsequently require extra expenses for managing these exposures. Therefore, the additional expenses for NPL management create an impression of higher cost-to-income ratios (and hence, lower cost efficiency) for banks that put substantial effort in the resolution of NPLs.
21 We use 2011 to split the firm fixed effect but confirm the robustness of the finding when splitting the fixed effect in other sample years between 2009 and 2013. Note that we cannot use firm x year fixed effects as they would absorb all variation because we only have one observation per bank and year.
22 Due to the high correlation between the individual measures for legal efficiency it is econometrically not feasible to include all individual legal efficiency measures in the same specification without multicollinearity issues.
References
- Agoraki, M. E. K., Delis, M. D., & Pasiouras, F. (2011). Regulations, competition and bank risk-taking in transition countries. Journal of Financial Stability, 7(1), 38–48. https://doi.org/10.1016/j.jfs.2009.08.002
- Angelini, P., Bofondi, M., & Zingales, L. (2017). The origins of Italian NPLs. Working paper.
- Arellano, M., & Bover, O. (1995). Another look at the instrumental variable estimation of error-components models. Journal of Econometrics, 68(1), 29–51. https://doi.org/10.1016/0304-4076(94)01642-D
- Ari, A., Chen, S., & Ratnovski, L. (2021). The dynamics of non-performing loans during banking crises: A new database with post-COVID-19 implications. Journal of Banking & Finance 133, 106140. https://doi.org/10.1016/j.jbankfin.2021.106140
- Barseghyan, L. (2010). Non-performing loans, prospective bailouts, and Japan's slowdown. Journal of Monetary Economics, 57(7), 873–890. https://doi.org/10.1016/j.jmoneco.2010.08.002
- Barth, J. R., Caprio Jr, G., & Levine, R. (2004). Bank regulation and supervision: What works best? Journal of Financial Intermediation, 13(2), 205–248. https://doi.org/10.1016/j.jfi.2003.06.002
- Beatty, A., & Liao, S. (2011). Do delays in expected loss recognition affect banks’ willingness to lend? Journal of Accounting and Economics, 52(1), 1–20. https://doi.org/10.1016/j.jacceco.2011.02.002
- Beatty, A., & Liao, S. (2014). Financial accounting in the banking industry: A review of the empirical literature. Journal of Accounting and Economics, 58(2–3), 339–383. https://doi.org/10.1016/j.jacceco.2014.08.009
- Beck, R., Jakubik, P., & Piloiu, A. (2013). Non-performing loans: What matters in addition to the economic cycle? Working Paper, https://doi.org/10.2139/ssrn.2214971
- Becker, K., Bischof, J., & Daske, H. (2021). IFRS: Markets. Practice, and Politics. Foundations and Trends in Accounting, 15(1-2), 1–262. https://doi.org/10.1561/1400000055
- Behr, P., Schmidt, R. H., & Xie, R. (2010). Market structure, capital regulation and bank risk taking. Journal of Financial Services Research, 37(2-3), 131–158. https://doi.org/10.1007/s10693-009-0054-y
- Berger, A. N., & De Young, R. (1997). Problem loans and cost efficiency in commercial banking. Journal of Banking & Finance, 21(6), 849–870. https://doi.org/10.1016/S0378-4266(97)00003-4
- Betz, J., Krüger, S., Kellner, R., & Rösch, D. (2020). Macroeconomic effects and frailties in the resolution of non-performing loans. Journal of Banking & Finance, 112, 105212. https://doi.org/10.1016/j.jbankfin.2017.09.008
- Bischof, J., Daske, H., Elfers, F., & Hail, L. (2022). A tale of two supervisors: Compliance with risk disclosure regulation in the banking sector. Contemporary Accounting Research, 39(1), 498–536. https://doi.org/10.1111/1911-3846.12715
- Bischof, J., Laux, C., & Leuz, C. (2021). Accounting for financial stability: Bank disclosure and loss recognition in the financial crisis. Journal of Financial Economics, 141(3), 1188–1217. https://doi.org/10.1016/j.jfineco.2021.05.016
- Blundell, R., & Bond, S. (1998). Initial conditions and moment restrictions in dynamic panel data models. Journal of Econometrics, 87(1), 115–143. https://doi.org/10.1016/S0304-4076(98)00009-8
- Bofondi, M., & Ropele, T. (2011). Macroeconomic determinants of bad loans: Evidence from Italian banks. Bank of Italy Occasional Paper, 89, https://doi.org/10.2139/ssrn.1849872
- Breuer, J. B. (2006). Problem bank loans, conflicts of interest, and institutions. Journal of Financial Stability, 2(3), 266–285. https://doi.org/10.1016/j.jfs.2006.07.001
- Burgstahler, D. C., Hail, L., & Leuz, C. (2006). The importance of reporting incentives: Earnings management in European private and public firms. The Accounting Review, 81(5), 983–1016. https://doi.org/10.2308/accr.2006.81.5.983
- Cerulli, G., D’Apice, V., Fiordelisi, F., & Masala, F. (2019). Benchmarking Non-performing loans. Working Paper, https://doi.org/10.2139/ssrn.2903851
- Christensen, H. B., Hail, L., & Leuz, C. (2013). Mandatory IFRS reporting and changes in enforcement. Journal of Accounting and Economics, 56(2-3), 147–177. https://doi.org/10.1016/j.jacceco.2013.10.007
- D'Apice, V., Fiordelisi, F., & Puopolo, G. W. (2021). Lending quality and contracts enforcement reforms. Working Paper, https://doi.org/10.2139/ssrn.3786050
- Dimitrios, A., Helen, L., & Mike, T. (2016). Determinants of non-performing loans: Evidence from euro-area countries. Finance Research Letters, 18, 116–119. https://doi.org/10.1016/j.frl.2016.04.008
- Djankov, S., Hart, O., McLiesh, C., & Shleifer, A. (2008). Debt enforcement around the world. Journal of Political Economy, 116(6), 1105–1149. https://doi.org/10.1086/595015
- Djankov, S., La Porta, R., Lopez-de-Silanes, F., & Shleifer, A. (2003). Courts. The Quarterly Journal of Economics, 118(2), 453–517. https://doi.org/10.1162/003355303321675437
- EBA. (2019). EBA report on NPLs – progress made and challenges ahead. European Banking Authority.
- ECB. (2015). Financial stability report. European Central Bank.
- ECB. (2016). Stocktake of national supervisory practices and legal frameworks related to NPLs. European Central Bank.
- ECB. (2017). Stocktake of national supervisory practices and legal frameworks related to NPLs. European Central Bank.
- ECB. (2019). Communication on supervisory coverage expectations for NPEs. European Central Bank.
- ECB. (2020). ECB banking supervision provides further flexibility to banks in reaction to coronavirus. Press release, March 2020.
- ECOFIN. (2017). Non-performing loans – Action plan. European Commission: Council Economic and Financial Affairs. 3555th Council meeting, Brussels.
- Espinoza, R., Prasad, A., & Williams, O. (2011). Regional financial integration in the GCC. Emerging Markets Review, 12(4), 354–370. https://doi.org/10.1016/j.ememar.2011.04.005
- European Commission. (2020). Tackling non-performing loans in the aftermath of the COVID–19 pandemic. Brussels, 16.12.2020 COM(2020) 822 final.
- Filip, B. F. (2014). Non-performing loans-dimension of the non-quality of bank lending/loans and their specific connections. Theoretical and Applied Economics, 5(594), 127–146.
- Ghosh, A. (2015). Banking-industry specific and regional economic determinants of non-performing loans: Evidence from US states. Journal of Financial Stability, 20, 93–104. https://doi.org/10.1016/j.jfs.2015.08.004
- Ghosh, S. (2007). Does Financial liberalization lower Problem Loans in banks? Economic Notes, 36(2), 171–188. https://doi.org/10.1111/j.1468-0300.2007.00179.x
- Granja, J., & Leuz, C. (2020). The death of a regulator: Strict supervision, bank lending and business activity. Center for Financial Studies Working Paper No. 60, https://doi.org/10.2139/ssrn.3289934
- Haselmann, R., Pistor, K., & Vig, V. (2010). How law affects lending. The Review of Financial Studies, 23(2), 549–580. https://doi.org/10.1093/rfs/hhp073
- Hoshi, T., & Kashyap, A. K. (2010). Will the US bank recapitalization succeed? Eight lessons from Japan. Journal of Financial Economics, 97(3), 398–417. https://doi.org/10.1016/j.jfineco.2010.02.005
- IMF. (2015). A strategy for resolving Europe’s problem loans. IMF Staff Discussion Note SDN/15/19.
- Jappelli, T., Pagano, M., & Bianco, M. (2005). Courts and banks: Effects of judicial enforcement on credit markets. Journal of Money, Credit and Banking, 37(2), 223–244. https://doi.org/10.1353/mcb.2005.0021
- Kasinger, J., Krahnen, J. P., Ongena, S., Pelizzon, L., Schmeling, M., & Wahrenburg, M. (2021). Non-performing loans-new risks and policies? NPL resolution after COVID-19: Main differences to previous crises (No. 84). SAFE White Paper.
- Kauko, K. (2012). External deficits and non-performing loans in the recent financial crisis. Economics Letters, 115(2), 196–199. https://doi.org/10.1016/j.econlet.2011.12.018
- Klein, N. (2013). Non-performing loans in CESEE: Determinants and impact on macroeconomic performance. IMF Working Paper, WP/13/72.
- Leuz, C. (2010). Different approaches to corporate reporting regulation: How jurisdictions differ and why. Accounting and Business Research, 40(3), 229–256. https://doi.org/10.1080/00014788.2010.9663398
- Leuz, C., Nanda, D., & Wysocki, P. D. (2003). Earnings management and investor protection: An international comparison. Journal of Financial Economics, 69(3), 505–527. https://doi.org/10.1016/S0304-405X(03)00121-1
- Liu, C. C., & Ryan, S. G. (2006). Income smoothing over the business cycle: Changes in banks’ coordinated management of provisions for loan losses and loan charge-offs from the pre-1990 bust to the 1990s boom. The Accounting Review, 81(2), 421–441. https://doi.org/10.2308/accr.2006.81.2.421
- Louzis, D. P., Vouldis, A. T., & Metaxas, V. L. (2012). Macroeconomic and bank-specific determinants of non-performing loans in Greece: A comparative study of mortgage, business and consumer loan portfolios. Journal of Banking & Finance, 36(4), 1012–1027. https://doi.org/10.1016/j.jbankfin.2011.10.012
- Mamatzakis, E., Matousek, R., & Vu, A. N. (2016). What is the impact of bankrupt and restructured loans on Japanese bank efficiency? Journal of Banking & Finance, 72(Supplement), 187–202. https://doi.org/10.1016/j.jbankfin.2015.04.010
- Maskara, P. K., & Mullineaux, D. J. (2011). Information asymmetry and self-selection bias in bank loan announcement studies. Journal of Financial Economics, 101(3), 684–694. https://doi.org/10.1016/j.jfineco.2011.03.019
- Nkusu, M. (2011). Nonperforming loans and macrofinancial vulnerabilities in advanced economies. IMF Working Paper, WP/11/161.
- Petersen, M. A. (2009). Estimating standard errors in Finance Panel data sets: Comparing approaches. The Review of Financial Studies, 22(1), 435–480. https://doi.org/10.1093/rfs/hhn053
- Podpiera, J., & Weill, L. (2008). Bad luck or bad management? Emerging banking market experience. Journal of Financial Stability, 4(2), 135–148. https://doi.org/10.1016/j.jfs.2008.01.005
- Ponticelli, J., & Alencar, L. S. (2016). Court enforcement, bank loans, and firm investment: Evidence from a bankruptcy reform in Brazil. The Quarterly Journal of Economics, 131(3), 1365–1413. https://doi.org/10.1093/qje/qjw015
- Reuters. (2021). External review finds deeper rot in World Bank ‘Doing Business’ rankings. September 2021. Available at: https://www.reuters.com/business/external-review-finds-deeper-rot-world-bank-doing-business-rankings-2021-09-20/
- Salas, V., & Saurina, J. (2002). Credit risk in two institutional regimes: Spanish commercial and savings banks. Journal of Financial Services Research, 22(3), 203–224. https://doi.org/10.1023/A:1019781109676
- Suarez, J., & Sànchez-Serrano, A. (2021). Approaching non-performing loans from a macroprudential angle. ESRB: Advisory scientific committee reports No. 2019/87. http://doi.org/10.2139/ssrn.3723327
- Whalen, G. (1991). A proportional hazards model of bank failure: An examination of its usefulness as an early warning tool. Economic Review, 27(1), 21–31.