
 ?Mathematical formulae have been encoded as MathML and are displayed in this HTML version using MathJax in order to improve their display. Uncheck the box to turn MathJax off. This feature requires Javascript. Click on a formula to zoom.
Abstract
This study develops a corporate social responsibility (CSR) measure for abnormal CSR. Based on a microeconomic framework, we argue and show that firm-level variables determine a firm-specific, normal (expected) level of CSR performance, where the marginal costs of CSR equal its marginal benefits. Any deviation from these equilibrium points is a proxy for abnormal CSR, which is negatively related to a firm’s short-term financial performance (i.e., profitability). Hereby, larger values result in proportionally larger decreases in financial performance (inverted U-shape). We conduct our empirical analyses using cross-sectional CSR performance data for U.S. listed companies from 1991 to 2013. Further analyses reveal that this negative effect of abnormal CSR exists for both positive and negative abnormal CSR. Our results hold for alternative measures of firm and CSR performance, an instrumental variable regression, and propensity score matching. Our model could serve as a first indicator for abnormal CSR for investors and other stakeholders.
1. Introduction
This study introduces a firm-year measure of abnormalFootnote1 Corporate Social Responsibility (hereafter: ‘CSR’) to the literature. Our construct of interest are (over- and under-) investments in CSR. Yet, since CSR investments are not directly observable, we follow prior research and use KLD CSR performance data as a proxy for CSR investments (Chen et al., Citation2020).Footnote2 We split a firm’s CSR into a normal and an abnormal CSR component. Normal CSR captures a firm’s optimal CSR level, whereas abnormal CSR captures over- and underinvestments in CSR beyond a firm’s optimum. Normal CSR is determined by economic determinants such as firm size, financial constraints, and firm growth. Our basic premise is that abnormal CSR as deviations from a firm’s optimal CSR level is linked to agency issues and managerial opportunism (Masulis & Reza, Citation2014) and should lower short-term financial performance.
A number of studies provide support for agency issues translating into suboptimal CSR-related choices (Petrovits, Citation2006; Wang et al., Citation2008). There are several potential reasons why managerial opportunism and agency issues might translate into abnormal CSR. For instance, firms that aim to opportunistically manage their image or corporate reputation without creating stakeholder value might engage in ‘greenwashing’ while actually under-investing in CSR (Beder, Citation1998; Laufer, Citation2003). Management may spend on corporate CSR to increase their personal utility to the detriment of shareholders, causing different stakeholder groups’ objectives to diverge (Barnea & Rubin, Citation2010; Masulis & Reza, Citation2014). Management may also forego CSR projects to avoid an increase in cash outflows, as some benefits of CSR are rather long-term (Deng et al., Citation2013; Edmans, Citation2011). In some cases, CSR underinvestment can be an indicator of costly management of earnings (Caskey & Ozel, Citation2017; Petrovits, Citation2006). Consequently, abnormal CSR might harm firm profitability because managerial incentives such as prestige, power, status, and compensation are not aligned with shareholder benefits.
The relationship between CSR and firm financial performance is one of, if not the most, exhaustively analyzed matter in CSR research (Friede et al., Citation2015). This is not surprising given the vast amounts companies are increasingly spending on CSR. According to a report by the consulting firm EPG, U.S. and UK companies in the Fortune Global 500 spent $15.2 billion on CSR in 2013.Footnote3 Examining the determinants and consequences of CSR is hence an important and relevant research field. Yet, empirical findings on a directional effect remain inconclusive, with a number of studies finding a negative relationship, no relationship, or mixed results on the link between CSR performance and firm performance. Hence, it is reasonable to argue that the research community is far from agreeing on a well-established link (Garcia-Castro et al., Citation2010; Margolis & Walsh, Citation2003).
There are several potential reasons for these mixed findings. Prior research argues that the inconsistencies could arise due to a lack of comparability resulting from different definitions and measurements of CSR (Diebecker et al., Citation2019) and different theoretical approaches (Griffin & Mahon, Citation1997). Econometric concerns in terms of endogeneity, measurement error, and omitted variables are also frequently raised (Garcia-Castro et al., Citation2010; McWilliams & Siegel, Citation2000). We argue that there is another potentially important factor that needs further consideration: the functional form of the relationship between CSR performance and financial performance. Prior studies primarily assume a linear relationship between CSR and financial performance, measuring CSR performance mainly at an absolute level (Barnea & Rubin, Citation2010; Fatemi et al., Citation2015). In our paper, we challenge the assumption that an increase in CSR investment increases a firm’s financial performance monotonously and disaggregate CSR performance into two components: normal and abnormal CSR, which allow us to investigate potentially non-linear relationships between normal CSR, abnormal CSR, and firm profitability.
We base our approach on microeconomic theory, according to which firms trade off costs against benefits when making investment decisions (Yoshikawa, Citation1980). Here, CSR spending is an investment problem that requires the firm to trade off costs and benefits (Nguyen et al., Citation2020). Assuming firms pursue a profit-maximizing strategy, they increase CSR investments until the CSR-related marginal benefits exceed the marginal costs (Lundgren, Citation2011; Yoshikawa, Citation1980).
In a two-stage estimation strategy, we employ economic determinants to empirically predict a firm-specific optimal level of CSR investment (CSR equilibrium model, first stage). As a proxy for CSR investments, we use CSR performance data from MSCI ESG STATS for publicly listed U.S. firms from 1991 through 2013.Footnote4 In line with prior research, we define CSR performance as the difference between the MSCI ESG STATS CSR strengths and the CSR concerns score. As economic determinants, we include firm-level variables such as firm size or profitability obtained from prior studies (Di Giuli & Kostovetsky, Citation2014).
We use these economic determinants in the first stage to capture optimal levels of CSR (e.g., predicted values capturing normal CSR). In equilibrium, CSR-related marginal costs will equal marginal benefits. Consequently, any deviation from these equilibrium points, be it positive or negative, would imply inefficient CSR investment (abnormal CSR). Overinvestment in CSR (positive abnormal CSR) incurs costs that are not offset by CSR benefits, whereas underinvestment in CSR (negative abnormal CSR) incurs opportunity costs because projects with a positive net present value are not undertaken (Barnea & Rubin, Citation2010; Bénabou & Tirole, Citation2010; Gillan et al., Citation2010; Goss & Roberts, Citation2011).
In the second step, we use the results from the first-stage regressions, where the predicted (residual) values represent normal (abnormal) CSR. Here, we examine the link between normal CSR performance, abnormal CSR performance, and financial performance. We predict that a CSR investment at the equilibrium point is not negatively related to financial performance (McWilliams & Siegel, Citation2000), and that any deviation from the optimum (abnormal CSR) is negatively related to financial performance, with the link being stronger the higher the deviation (i.e., an inverted U-shaped relationship) (Fatemi et al., Citation2015; Lundgren, Citation2011).
Turning to our empirical results, we find evidence in line with our predictions. We do indeed find a positive or no significant relationship between firm profitability and the predicted values of CSR, in line with normal CSR capturing an equilibrium point. Regarding abnormal CSR, we show a negative relationship between firm profitability and abnormal CSR in the form of an inverse U-shape, suggesting that abnormal CSR does indeed capture inefficiencies relating to CSR. To mitigate endogeneity concerns, we perform an instrumental variable regression approach. Here, we instrument abnormal CSR with public attention for CSR, building on prior research arguing that managers use CSR as a way to gain personal attention at the expense of shareholders (Petrenko et al., Citation2016). We argue that the higher the attention levels for CSR overall, the larger the individual incentive for a CEO to use CSR as an opportunistic way to boost their public (CSR-related) image. We obtain similar results with this instrumental variable approach. Our results also hold for alternative CSR data, different constructions of (ab)normal CSR, propensity score matching, and a simpler one-step approach to estimate normal vs. abnormal CSR (i.e., normal CSR as the median CSR value per industry-year group).
Our contribution to the literature is twofold. First, we develop a novel approach for estimating and examining a firm-specific optimal level of CSR performance based on microeconomic theory. Although benchmark/equilibrium-based analyses and comparisons among industry peers are a well-established approach in other fields of accounting research (e.g., estimation of earnings management with discretionary accruals or estimation of labor efficiency with abnormal net hire), to our knowledge, no such measure is available for CSR. We fill this research gap with our measure of abnormal CSR. Our estimation approach disaggregates CSR data into a normal and an abnormal component, allowing for the identification of firm-specific CSR investment inefficiencies. While the normal component results from rational investments in CSR, as predicted by microeconomic theory (in line with the majority of prior studies finding a (weak) positive association between CSR and profitability; see Friede et al., Citation2015), the abnormal component is subject to agency problems (Petrovits, Citation2006; Wang et al., Citation2008). In essence, splitting CSR into a normal and abnormal component allows us to tie in the empirical evidence from prior literature while providing another important explanation for the heterogeneity of the results.
As our second contribution to the literature, we provide empirical evidence that only normal CSR is not negatively associated with financial performance, whereas the relationship between abnormal CSR and financial performance is negative. Though prior research provides some arguments in line with our findings (see, e.g., Barnea & Rubin, Citation2010; Bénabou & Tirole, Citation2010; Fatemi et al., Citation2015; Gillan et al., Citation2010; Lundgren, Citation2011), to the best of our knowledge there is currently no research that does so empirically. In line with the predictions of economic theory, we show that firms somewhat benefit from normal CSR and that firm profitability deteriorates with abnormal CSR. As abnormal CSR may be explained by agency issues, our study consequently also contributes to the literature that links CSR to opportunism (Masulis & Reza, 2015).
At the same time, these findings also have practical implications. We provide investors and other external stakeholders with a tool for the relative assessment of a firm’s CSR performance in addition to the absolute CSR measures provided by ASSET4 or KLD MSCI. External stakeholders may use our approach to measuring abnormal CSR as a first indicator to identify firm-specific CSR inefficiencies that have a negative impact on a firm’s financial performance as shown in our study.
The study closest to our own is that of Wang et al. (Citation2008). They find an inverse U-shaped relationship between percentage of charitable donations (relative to sales) and financial performance. It is unclear, however, whether their findings on donations are also applicable to CSR, given that CSR and donations are significantly different constructs, in four crucial ways. First, donations only capture a monetary output dimension (e.g., total dollar amount donated per firm-year). For this reason, donations have only a direct, monetary effect on a firm’s costs (e.g., cash outflow for the donation). Conversely, CSR captures both the monetary and non-monetary qualitative features of CSR. Here, costs can occur both directly (e.g., the cost of buying more sustainable production equipment) or indirectly (e.g., redressing a workplace gender imbalance via multiyear marketing campaigns specifically targeting female recruits). So, while we have evidence from Wang et al. (Citation2008) that direct costs potentially harm a firm’s financial performance, it is unclear, ex ante, whether a similar effect is observable for indirect costs, given their more complex nature.
Second, donations capture only parts of the social dimension of CSR, whereas we consider all its dimensions. Given that prior literature also finds mixed results across different CSR dimensions (see Friede et al., Citation2015) and across different CSR databases (Diebecker et al., Citation2019), it is important to consider all CSR dimensions simultaneously, also using different CSR datasets. We show that abnormal CSR negatively affects financial performance independent of which database is used (i.e., ASSET4 or MSCI ESG KLD STATS).
Third, the time dynamics of donations vs. CSR are fundamentally different. Donations incur neither setup nor settlement costs, so they are very transitory in nature and firms can initiate and terminate them quite spontaneously. Consequently, donations have no effect on the cost stickiness of firms (e.g., asymmetric cost behavior corresponding to sales increases vs. sales decreases). Conversely, CSR activities often involve both considerable setup and settlement costs (e.g., setting up CO2-reducing production processes). These additional constraints could impact the way CSR affects a firm’s financial performance. One potential channel here is cost stickiness caused by investments in CSR. In line with this, Habib and Hasan (Citation2019) find a positive association between CSR and cost stickiness.
Fourth, donations occur outside a firm’s core activities, so managers could use them as an efficient way to boost their personal reputation (Masulis & Reza, 2015). By contrast, to significantly improve a firm’s CSR performance, managers often need to change core activities incrementally, which is a longer-term process (Grisard et al., Citation2020).
Besides these four conceptual differences between CSR and donations, there is also an empirical reason why it is important to explore (abnormal) CSR in addition to donations. According to the sample values of Wang et al. (Citation2008), 50% of firms make no donations at all – and even those that do donate often give amounts that are likely of lesser relevance to firm performance (sample mean for donations divided by sales: 0.000). By contrast, most firms have abnormal CSR, albeit to differing extents. Hence, it remains an empirical question whether the finding of Wang et al. (Citation2008) on donations is also applicable to CSR.
The paper proceeds as follows. In section 2, we discuss prior research and develop our hypotheses. Section 3 explains our research design, sample, and data sources. In section 4, we present our results and perform a number of robustness checks. Section 5 concludes.
2. Literature Review and Hypothesis Development
2.1. CSR and Firm Financial Performance
Prior research provides extensive evidence for the notion that investing in CSR is financially beneficial for firms particularly in the long run, as it can improve operating performance, increase sales and profits, and reduce risks (Heal, Citation2005). There are various channels through which CSR investment materializes into benefits. For instance, CSR-driven product differentiation and customer awareness augment a firm’s competitive advantage (Luo & Bhattacharya, Citation2006; McWilliams & Siegel, Citation2001; Servaes & Tamayo, Citation2013). Firms with high levels of CSR also have increased worker productivity, loyalty, and commitment (Brammer et al., Citation2007; Collier & Esteban, Citation2007; Kim et al., Citation2010). Finally, CSR can also function as a means to mitigate potential conflicts with stakeholders such as regulators, which again benefits firm value (Brown & Dacin, Citation1997; Chen et al., Citation2020; Lev et al., Citation2010).
In line with the evidence supporting these benefits of CSR performance, a cross-sectional examination of studies on the link between CSR and financial performance shows a rather positive relationship. In a comprehensive review of the relevant literature, Margolis and Walsh (Citation2003) examine 127 studies and report that 54 of them find evidence of a positive relationship between CSR and financial performance. However, the other 73 studies find no relationship, a negative relationship, or have mixed results (for a similar overview, see also Friede et al., Citation2015).
2.2. CSR as an Investment Optimization Problem
Prior studies on the relationship between CSR and financial performance typically share a similar research design. Financial performance is explained by CSR as the variable of interest (or vice versa), assuming a linear relationship. In our analysis, we attempt to break up that general assumption and model the relationship between CSR and firm financial performance as a problem of investment optimization under agency problems. We argue that CSR should be split into two components, a normal component, and an abnormal component, each resulting from a specific motivation. On the one hand, the normal component results from rational investments in CSR as predicted by microeconomic theory and known determinants from prior literature. The abnormal component, on the other hand, is subject to problems with CSR management and agency issues.
In line with this argumentation, we deviate from a linearity assumption regarding the relationship between CSR and profitability. Instead, we follow Barnea and Rubin (Citation2010) and assume a non-monotonic, concave relationship between a firm’s CSR activities and its financial performance. This allows us to partition CSR activities into optimal and suboptimal expenditures, where CSR demand and supply are in equilibrium at the CSR optimum (Barnea & Rubin, Citation2010; Hillman & Keim, Citation2001; McWilliams & Siegel, Citation2001). McWilliams and Siegel (Citation2001) were among the first to develop a supply-demand framework determining the existence of a firm-specific optimal level of CSR investment. For example, CSR demand may be driven by firm size, as larger firms are more visible (Di Giuli & Kostovetsky, Citation2014). Then again, CSR supply may be affected by financial constraints, as more financially constrained firms must incur relatively higher costs to finance CSR investments (Hong et al., Citation2012). In the spirit of McWilliams and Siegel (Citation2001), Lundgren (Citation2011) theoretically analyzes the economic mechanisms of CSR expenditures conditional on such an optimal level. Exploring the rationale behind CSR expenditure via a microeconomic model, he argues that firms with profit-maximizing preferences trade off the marginal benefits of CSR against its marginal costs, determining a firm’s (optimal) CSR expenditures by its individual cost–benefit function.
For instance, CO2 emissions can initially be reduced quite cost-efficiently by replacing old production machinery. However, once a firm has newer equipment, further CO2 reductions would require the entire production process to be modified, or even an entirely new business model to be developed, which would incur greater marginal costs. Furthermore, firms can increase financial performance by engaging in CSR-related customer acquisition. For instance, once a firm can label its products as ‘climate-friendly’ (e.g., low impact on climate change), it might be able to target new customers. However, if the firm then starts labeling its products as ‘climate-neutral’ (e.g., no impact on climate change), the marginal effect of customer acquisition declines, because CSR-related consumer behavior has already been triggered some time before.
In such a microeconomic setting, we assume firms to be profit maximizers (Yoshikawa, Citation1980), meaning that they attempt to engage in the kind of CSR that will deliver maximum profit. That is, the higher the increase in financial performance that can be achieved by CSR, the more extensively firms will engage in it. Consumers are likely to evaluate a firm’s products based on its CSR investments (Klein & Dawar, Citation2004). Just as on the supply side, the more CSR costs (e.g., higher prices for greener products; Di Giuli & Kostovetsky, Citation2014), the lower consumers’ demand for it (all else being equal). The lower the price of CSR, the more consumers will demand CSR instead of relatively more expensive goods (i.e., a substitution effect). The demand-and-supply theory of microeconomics predicts that CSR price and CSR quantity will stabilize at the level at which the quantity supplied equals the quantity demanded – the market equilibrium. In our context of firms as profit maximizers, firms have multiple economic determinants that shape their individual CSR equilibrium. For instance, larger firms are likely to engage more in CSR, because they are more visible, and their reputational concerns are more pronounced (Di Giuli & Kostovetsky, Citation2014). Then again, firms under financial constraints (e.g., high leverage) will incur relatively higher costs when funding CSR investments, making it less likely that they will spend significant amounts on CSR (Hong et al., Citation2012).
In line with this notion, CSR spending beyond the equilibrium represents overinvestment and therefore reduces firm profitability. Conversely, if firms invest less than the equilibrium suggests, even though a marginal increase in the cost would marginally increase the benefits of the investment, the firm incurs opportunity costs (foregoing projects with a positive net present value). Thus, firms that underinvest in CSR are also expected to exhibit lower firm profitability. Thus, both over- and underinvestment in CSR can be denoted as suboptimal, or abnormal, CSR from a maximization perspective. Hereby, larger magnitudes of over- and underinvestment have proportionally larger marginal (opportunity) costs (i.e., a concave relationship).
Consistent with microeconomic theory, we predict a non-monotonic, concave relationship between a firm’s CSR activities and its financial performance. In this context, CSR is expected to increase financial performance at a decreasing rate up to the equilibrium (e.g., normal CSR), while financial performance decreases for CSR values above the equilibrium value. For firms investing in a normal level of CSR we should find evidence of a firm-specific optimal level: the turning point of the individual utility function. We present our underlying model in Figure for the range of KLD CSR data.
Figure 1. Overview of our microeconomic model for normal and abnormal CSR. This figure presents an overview of our microeconomic model for normal and abnormal CSR and spans from −33 to +59 – the range of KLD CSR data: A firm that has all concerns in all dimensions and no strengths (−33) vs. a firm that has all strengths in all dimensions and no concerns (+59).
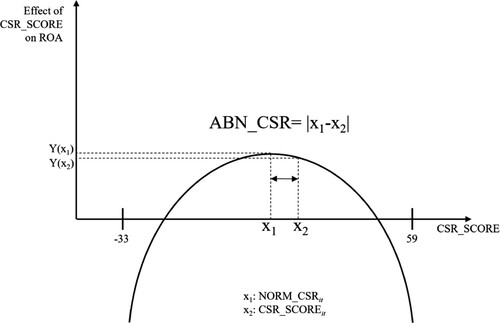
Differentiating observed CSR levels into normal (optimal) and abnormal (suboptimal) levels of CSR helps interpret heterogeneous findings on the relationship between CSR and firm financial performance. For firms investing at the normal level of CSR, we should find evidence of a somewhat positive effect on firm profitability (Fatemi et al., Citation2015). However, as we employ industry-adjusted profitability measures, in line with prior research (Jo & Harjoto, Citation2012; Kim et al., Citation2012), the effect of normal CSR could also be insignificant if most firms adopt the same CSR investment behavior (e.g., all firms being at the optimum).Footnote5 Consequently, we expect either a positiveFootnote6 or an insignificant association between normal CSR and profitability. Formally, we hypothesize:
H1: Normal CSR performance is not negatively associated with a firm’s profitability.
While microeconomic theory typically analyzes situations in which all contracting parties have perfect information and the ability to fully monitor any investments, including those in CSR, we argue that agency problems provide a specific motive for an abnormal CSR component, which captures CSR investments incurred for reasons other than shareholder value maximization (Berle & Means, Citation1932; Jensen & Meckling, Citation1976). Managers are expected to maximize their own utility under information asymmetry, while stakeholders cannot perfectly monitor CSR for manipulation. For instance, managers may realize opportunistic short-term goals and neglect long-term objectives, causing investment inefficiencies such as budget cuts (Narayanan, Citation1985). Jensen (Citation1986) predicts that personal perquisites provide a specific motive for overinvestment, such that managers build empires and grow firms beyond their optimal size.Footnote7
In line with the overinvestment explanation of abnormally high CSR levels, Masulis and Reza (2015) find supportive evidence that corporate donations mainly reflect CEOs’ own opportunistic preferences, and that such donations are usually penalized by shareholders. Hemingway and Maclagan (Citation2004) suggest that in some cases, management use CSR investments to limit reputational damage or to cover up corporate misconduct. Other studies examine so-called ‘greenwashing’ strategies, where management simply claim they are engaging in environmentally responsible practices without actually doing so. In such cases, CSR is used for window-dressing, without creating any real, long-term value (Laufer, Citation2003; Ramus & Montiel, Citation2005). Under conditions where the benefits arising from CSR investments do not exceed the cost of investment, observed CSR levels seem to be an outcome of overinvestment from a profit-maximizing point of view.
In turn, management may also forego CSR investment to avoid short-term cash outflows, sacrificing long-term gains. Consistent with this notion, Petrovits (Citation2006) shows that firms that make discretionary choices about charitable donations by adjusting their expenditures to meet or beat earnings benchmarks use CSR expenditures as an off-balance sheet reserve. In a similar vein, Caskey and Ozel (Citation2017) find that firms trying to meet earnings expectations reduce employee health and safety measures. In line with this argumentation, Chen et al. (Citation2020) find that CSR investment increases in an improved monitoring environment. Exploiting a natural experiment, they find support for an increase in institutional investors’ holdings leading to an increase in CSR performance ratings, mainly through a reduction in misconduct that could incur future litigation costs. Interestingly, once institutional investors’ attention decreases, so does CSR performance, with a stronger effect in weakly governed firms.
To summarize, any additional dollar spent on CSR beyond the normal (i.e., optimal) level results in overinvestment and therefore reduces firm profitability. Conversely, if a firm invests less than the equilibrium suggests, even though a marginal increase in cost would marginally increase the benefits of the investment, it incurs opportunity costs (foregoing projects with a positive net present value). Thus, firms that underinvest in CSR are also expected to exhibit lower firm profitability compared to their peer firms. Both over- and underinvestment in CSR can thus be denoted as suboptimal, or abnormal, CSR from a maximization perspective. Hence, based on these microeconomic considerations (Lundgren, Citation2011; Yoshikawa, Citation1980), we argue that abnormal CSR will deteriorate firm profitability. Hereby, higher values of abnormal CSR should result in relatively larger decreases in firm profitability due to the non-linear marginal costs and benefits functions as displayed in Figure . We hypothesize formally:
H2a: Abnormal CSR is negatively related to firm profitability.
H2b: The relationship between abnormal CSR and firm profitability is concave (i.e., larger values of abnormal CSR have a stronger negative relation with firm profitability).
3. Research Design
3.1. CSR Performance Scores as a Proxy for the CSR Cost–Benefit Equilibrium
To empirically address efficient investment levels, a firm’s cost–benefit function has to be known – a challenge that is exacerbated in a CSR setting. As financial statements do not feature a CSR expenditure account, examining the exact dollar amounts spent on CSR is not feasible (Chen et al., Citation2020; Di Giuli & Kostovetsky, Citation2014). Instead, CSR spending can only be indirectly estimated by looking at various items on the income statement and balance sheet, such as selling, general, and administrative (SG&A) expenses (e.g., promoting greener products), costs of goods sold (COGS) (e.g., producing greener products), or capital expenditure (CAPEX) (e.g., investing in more CO2-efficient equipment) (Di Giuli & Kostovetsky, Citation2014). These accounts, in turn, are noisy measures of CSR expenditure, as they incorporate many different expenses under the same item. Further, even if expenditure on CSR were precisely known, the benefits of an additional dollar spent on CSR would still have to be calculated via the demand side. The additional (future) value to shareholders created by setting up daycare for employees’ children or appointing an additional female director to the board is hard to estimate and observe, as some of the benefits of CSR investments are rather long-term, multidimensional, and unobservable by nature (see Eurosif, Citation2016).
Using CSR performance measures as a proxy for CSR expenditures is one way this issue is addressed in the literature (e.g., Chen et al., Citation2020). Vast sustainability databases such as ASSET4 or MSCI ESG KLD STATS rate companies on their performance in different areas of CSR. By rating how the respective company ranks relative to its peers, it is possible to consider both demand and how certain issues are being addressed. For instance, KLD only evaluates a firm in the categories that are identified as CSR risk factors for the firm’s operations, leaving out those that do not apply (MSCI, Citation2015).
In a recent study, Chen et al. (Citation2020) translate increases in KLD CSR ratings into dollar changes in SG&A expenses. Their identification strategy builds on the assumption that SG&A expenses go some way towards capturing CSR investments such as expenditures from social activities (e.g., charitable giving) or pollution prevention (see, e.g., Di Giuli & Kostovetsky, Citation2014). Hence, SG&A expenses provide outsiders with a rough view of a firm’s actual CSR investments. The link between CSR investments and SG&A expenses seems quite meaningful. According to the empirical finding of Chen et al. (Citation2020), an increase of one KLD CSR rating point corresponds to a $40 million increase in SG&A. Of course, this is still a noisy and incomplete proxy, as not all CSR spending will be reported under SG&A (and not all SG&A expenses relate to CSR spending), but it supports our assumption that KLD rating scores are a meaningful proxy for CSR investment levels. As prior studies also show that some of the KLD rating categories – namely, those that are material to a company – are significantly related to future financial performance, using the expected values of these scores as a proxy for optimal investment levels seems plausible (Grewal et al., Citation2016; Khan et al., Citation2016). Compared to using SG&A as a proxy for CSR investments, using the KLD rating data has also the advantage that it can capture CSR investments unrelated to SG&A (e.g., greener products that would show up in cost of goods sold, or greener production methods that would affect capital expenditure).
3.2. Empirical Models
3.2.1. (Ab)normal level of CSR
To empirically estimate a firm-specific benchmark for normal levels of CSR performance, we use MSCI ESG STATS CSR rating data.Footnote8 For each firm, MSCI ESG STATS evaluates CSR performance on dimensions organized according to the seven qualitative issue areas community, corporate governance, diversity, employee relations, environment, human rights, and product characteristics, and the controversial business issues alcohol, gambling, tobacco, firearms, military, and nuclear power. This evaluation translates into a binary ranking for positive (CSR strengths) and negative performance indicators (CSR concerns) for several criteria in each of the seven qualitative issue areas. For controversial business issues, rankings are available for CSR concerns only.
When a company meets (does not meet) a criterion in a given year, MSCI ESG STATS assigns a 1 (0) score for that criterion. For example, there are 29 criteria in total for the qualitative issue area environment, 17 (12) of which belong to the strengths (concerns) section.Footnote9 A firm may, for instance, fulfill 10 out of 17 strength criteria (i.e., is assigned a score of 1 for 10 out of the 17 criteria) and three out of 12 concern criteria under environment. In line with prior literature, we accumulate these ratings separately for strengths (CSR_STR) and concerns (CSR_CON) over five of the seven qualitative issue areas, namely community, diversity, employee relations, environment, and product characteristics.Footnote10 We propose a firm-specific benchmark model, which we estimate per-size deciles and fiscal year groupsFootnote11 to acknowledge for systematic differences across smaller vs. larger firms and across time.Footnote12 Given that the CSR data is structured as count data (i.e., number of strengths and concerns), we run the benchmark models using Poisson regressions:Footnote13
(1a/b)
(1a/b)
To estimate the normal level of CSR, we regress it on firm-level variables that aim to determine firm-specific CSR equilibria, as has been done in prior studies that predicted investment optima in accounting research (e.g., Biddle et al., Citation2009). We include firm size and firm growth to capture public pressure/focus, as larger and growing firms attract more public attention and hence may be expected to engage more in CSR (i.e., the marginal benefits are greater for large versus small firms and for growing versus mature firms). We estimate firm size with the natural logarithm of net sales (SIZE), growth with a firm’s sales growth (GROWTH), and growth opportunities with the book-to-market ratio (BTM) (Gamerschlag et al., Citation2011; McWilliams & Siegel, Citation2000; Prior et al., Citation2008). With respect to the financial situation of a firm, prior literature has shown that CSR expenditures are limited by budget restrictions. The less free capital is available, the higher the CSR-related financing costs, which in turn affects the magnitude of the marginal cost of CSR investment (e.g., Bansal, Citation2003; Graves & Waddock, Citation1994; Waddock & Graves, Citation1997) and budget cuts (Petrovits, Citation2006). We thus include ROA, the dividend payout ratio (DIV), leverage (LEV), cash holdings (CASH), and KZ-INDEX (a relative measurement of reliance on external financing) as proxies for different dimensions of financial restrictions.
We also control for research and development expenses (R&D), capital intensity (CAPEX), SG&A expenses (SGA), and advertising expenses (ADV), because prior research has linked them to a firm’s CSR performance (Chen et al., Citation2020; McWilliams & Siegel, Citation2000). As prior research has also linked corporate governance to a firm’s CSR, we include a firm’s corporate governance score as a separate control (Jo & Harjoto, Citation2012). Finally, we control for two-digit SIC industry-fixed effects (SIC_2) because studies have documented the influence of industry characteristics such as the degree of regulation, and public attendance on CSR levels (e.g., Brammer & Millington, Citation2006). For detailed descriptions of all variables used in our main models, please refer to the Appendix.
As highlighted above, we aim to provide a firm-specific benchmark for the normal level of CSR performance, our proxy for CSR cost–benefit equilibria. Our non-pecuniary measure relies on aggregated CSR performance data – since the individual cost–benefit function of a firm is not publicly available – and aims to capture the tradeoff between CSR expenditures and their benefits.Footnote14 Therefore, we predict an average CSR benchmark for groups of firms by their size deciles and fiscal years, accounting for possible measurement error in a cross-sectional analysis. Hence, we allow the intercept and coefficient estimates to vary with firm-size deciles and fiscal years to take into account external shocks (e.g., financial crisis years). Finally, we estimate the CSR equilibrium model separately for CSR strengths and CSR concerns (1a/b). We then use the differences between predicted CSR strengths and CSR concerns to calculate the predicted net CSR performance, because a firm’s CSR strengths and concerns may differ in terms of their (marginal) cost–benefit function (Di Giuli & Kostovetsky, Citation2014).
To develop the firm-specific benchmark for a normal level of CSR performance, we use the predicted values from Equations (1a/b). We interpret the predicted values of CSR strengths (NORM_CSR_STR) and CSR concerns (NORM_CSR_CON) as a firm-specific benchmark for normal levels of investment in CSR. Next, we calculate the difference between expected CSR strengths (NORM_CSR_STR) and expected CSR concerns (NORM_CSR_CON) to retrieve an aggregate benchmark for the normal level of CSR performance at the corporate level. Calculating a firm’s CSR performance as the difference between its CSR strengths and concerns allows us to offset negative CSR performances with positive ones (El Ghoul et al., Citation2011):
(2)
(2)
Assuming that the CSR equilibrium model (1a/b) is well specified, any deviation in actual CSR strengths (CSR_STR) and concerns (CSR_CON) from their predicted values results from inefficient CSR investment. We thus interpret these residuals as abnormal CSR. By taking the difference between the actual CSR strengths (concerns), as evaluated by MSCI ESG STATS, and predicted CSR strengths (concerns) of each firm, we denote the residuals of Equations (1a/b) as abnormal CSR strengths (concerns):
(3a)
(3a)
(3b)
(3b)
Similar to Equation (2), we define abnormal CSR as the difference between abnormal CSR strengths (ABN_CSR_STR) and abnormal CSR concerns (ABN_CSR_CON). Essentially, ABN_CSR captures the difference between a firm’s actual CSR performance as obtained by its KLD MSCI CSR rating and its normal (i.e., predicted) CSR performance. We argue that this difference is a proxy for the inefficient component of a firm’s CSR performance:
(4)
(4)
3.2.2. CSR and firm profitability
We test the relation between (ab)normal CSR and profitability with a linear model:
(5)
(5)
where ADJ_ROA is the industry-adjusted return on assets as a measure of a firm’s short-term profitability.Footnote15 CONTROLS is a vector of controls. We use aggregated expected CSR (NORM_CSR) and aggregated abnormal CSR (ABN_CSR) as our variables of interest to analyze the CSR equilibrium as well as the relationship between CSR investment and a firm’s financial performance. Because our microeconomic framework predicts a non-linear relationship between CSR and financial performance for larger distances between a firm’s actual and normal CSR (e.g., abnormal CSR), we include abnormal CSR as a linear and a quadratic term.
We control for lagged industry-adjusted profitability (ADJ_ROAt-1) to mitigate concerns relating to serial correlation of ADJ_ROA. All other control variables are the same as in models (1a/b) and are based on prior research. For instance, we control for firm growth to capture potential effects relating to a firm’s investment policies (Fairfield & Yohn, Citation2001). We also include firm size to consider size-related effects on profitability. Further, financial restrictions could limit a firm’s investment behavior. Ultimately, firms could be forced to refrain from initiating projects with a positive net present value due to capital/financial constraints, which is why we include a control for leverage, and a firm’s KZ-Index. We present and define all control variables in the Appendix. Finally, we take into account concerns due to omitted variable bias (e.g., time-invariant unobservables) on a firm level (industry level) by controlling for firm-fixed effects () (two-digit SIC industry-fixed effects).
3.3. Sample
We collect data for all publicly listed firms in the U.S. from the Compustat database for the period 1991 through 2013, as MSCI ESG STATS CSR data are available from 1991. In line with prior research (e.g., Kim et al., Citation2012), we exclude firms in the financial sector (SIC 6000–6799) due to systematic differences in their accounting characteristics (e.g., high leverage) compared to the other industries.Footnote16 After merging the Compustat sample with MSCI ESG STATS, we obtain an initial sample of 30,473 firm-year observations. We require non-missing information for any of the variables used in Equation (1) and delete firm-years with negative book values of equity. This results in 15,620 firm-year observations that we use in the CSR equilibrium model (1). To obtain the final sample for the profitability model, we follow prior research and drop any firm-year observation where a firm’s net sales, total assets, or market value of equity are less than $10 million (e.g., Dickinson, Citation2011). We do so for two reasons. First, small denominators skew the variables. Second, these firms are likely to be extreme cases (e.g., firms with a market value below $10 million are usually on the verge of insolvency). To ensure these observations do not drive or bias our results, we exclude them.Footnote17 Finally, we require non-missing information for any of the variables used in the profitability model (9). This results in a final sample of 15,438 firm-year observations. We winsorize all continuous variables at the top and bottom percentiles to mitigate the influence of outliers. Table summarizes the sample selection procedure.
Table 1. Summary of the sample selection procedure.
4. Results
4.1. Descriptive Statistics and CSR Equilibrium Model
Tables and show the descriptive statistics and the Pearson correlation tables for our sample. The descriptive statistics of our variables compare well with prior literature (e.g., El Ghoul et al., Citation2011; Jo & Harjoto, Citation2012). For instance, the average firm size is relatively large at 7.608 (which is common for studies using CSR data), and moderately leveraged, indicated by a mean LEV of 0.201. The Pearson correlation table reveals a significant positive correlation between SIZE and CSR. This correlation is in line with prior literature, which finds firm size as a proxy for public pressure to be an important CSR determinant at the organizational level (Aguinis & Glavas, Citation2012). None of the correlations between the independent variables raises multicollinearity concerns.
Table 2. Descriptive statistics of regression variables.
Table 3. Pearson correlation table.
As the coverage of MSCI ESG data is considerably smaller than that of the Compustat-CRSP universe, it is important to compare common firm characteristics between the two samples to understand the extent to which our results are generalizable. We find that the mean values of all CSR determinant variables for MSCI sample firms versus the full Compustat-CRSP universe are within the bandwidth of plus/minus one standard deviation, except for total assets (MSCI predominantly covers larger firms). Comparing our sample to the Compustat-CRSP universe, our sample also covers similar shares of firms from different industries. The industry distribution of our sample firms also shows that our results are based on firms from a wide range of industries, with no strong influence from any one industry in particular.
Table provides the distribution of significant coefficients for the cross-sectional regressions of the CSR strengths (concerns) model. As we predict ab(normal) CSR strengths and concerns using Poisson regressions, we do not provide average coefficients (as they provide little insight). Instead, to better understand which determinants are particularly important for CSR strengths and concerns, we list the percentage of regressions (i.e., regression per size deciles and fiscal years) in which each CSR strength or concern determinant is either positively or negatively significant.
Table 4. Percentage of significant coefficients from the cross-sectional Poisson regressions (per size deciles and fiscal years) on CSR strength (CSR_Strit) and concerns (CSR_Conit).
Overall, CSR determinants are better able to explain CSR strengths than CSR concerns. Firm size (SIZE) is positively associated with CSR strengths (concerns) in 35.41% (15.05%) of the regressions. Meanwhile, R&D expenses (R&D) is positively associated with CSR strengths in 22.86% of the regressions, whereas a firm’s growth (GROWTH) and leverage (LEV) are significantly negatively related with CSR strengths (15.92% and 14.06%). Then again, SG&A expenses (SG&A) seem to help firms to mitigate CSR concerns: In 11.05% of the regressions, we find a significant negative coefficient for SG&A with CSR_CON as the dependent variable. For the next step, where we regress firm profitability on (ab)normal CSR, we use the estimated values and residuals of these models as proxies for normal and abnormal CSR.
4.2. Abnormal CSR and Profitability
Table provides the multivariate results of the profitability model in Equation (5). As predicted, we find heterogeneous results for the effects of normal and abnormal levels of CSR on firm financial performance. When not partitioning CSR performance into normal and abnormal levels, but instead using the observed level of CSR performance, as done in prior literature, the coefficient is positive and significant with industry-fixed effects (Column (1)). However, it becomes insignificant when controlling for firm-fixed effects (Column (2)). This suggests that the relationship between a firm’s CSR performance and its profitability is positive and captured by time-invariant firm-specific characteristics.
Table 5. Results for regressing (abnormal) CSR (NORM_CSRit; ABN_CSRit) on financial performance (ADJ_ROAit).
In Columns (3)–(6), we split CSR into normal and abnormal CSR. In line with H1, the coefficient on normal CSR performance is positive with industry-fixed effects and becomes insignificant when including firm-fixed effects. In contrast, the coefficient for the quadratic term of abnormal CSR (ABN_CSR2) is significantly negative (in line with Hypothesis 2a) no matter whether we also include ABN_CSR as a linear term or not, and no matter whether we include industry- or firm-fixed effects. Interestingly, while the quadratic term of ABN_CSR is significantly negative, the linear term of ABN_CSR is insignificant suggesting that the empirical relationship between abnormal CSR and short-term financial performance is likely non-linear as predicted with Hypothesis 2b. Comparing the effect size of normal and abnormal CSR, both are quite similar. Hence, the positive effect of normal CSR and the negative effect of abnormal CSR on profitability seem to offset each other (at least in the short-run), which is in line with the insignificant coefficient for CSR performance in Column (2).
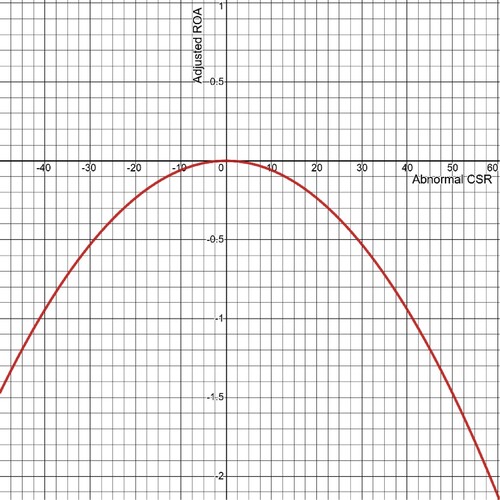
To better understand the functional relationship between abnormal CSR and a firm’s profitability, we calculate the marginal effect of abnormal CSR as a joint function of the linear and quadratic function. Based on the coefficients estimates, the function equals: −0.00000171*ABN_CSR – 0.000589*ABN_CSR2. We present the corresponding function in Figure . As argued in our theoretical framework and illustrated in Figure , our empirical estimation for the abnormal CSR function does indeed show an inverted U-shape. Larger values of abnormal CSR do indeed result in larger decreases of firm profitability. To better illustrate the non-linear relationship, we calculate the effect of abnormal CSR on firm profitability, when a firm has an abnormal CSR of 1, 2, and 3 rating points. The corresponding effects of ABN_CSR equal −0.0006, −0.0024, and −0.0053. Relative to an abnormal CSR value of 1 rating point, the effect size of 2 (3) rating points of abnormal CSR is approximately 4 (9) times as large, highlighting the inverted U-shaped relationship between abnormal CSR and financial profitability.
Figure 2. Empirical estimation: Non-linear relationship between abnormal CSR and financial performance. This figure shows the graph of the estimated quadratic function between abnormal CSR (x-axis) and industry-adjusted ROA (y-axis). The underlying mathematical equation based on the coefficients for abnormal CSR is: Y = −0.00000171x – 0.000589x2. The figure includes the full range of KLD CSR data: a firm that has all concerns in all dimensions and no strengths (−33) vs. a firm that has all strengths in all dimensions and no concerns (+59).
The model’s adjusted R2 with industry-fixed effects (firm-fixed effects) is 70.2% (73.0%) (columns (5) and (6)), and the control variables behave consistent with our expectations and results reported in prior literature. ADJ_ROA is positively correlated with future profitability, likely due to serial correlation. In line with prior literature (Gamerschlag et al., Citation2011; McWilliams & Siegel, Citation2000; Prior et al., Citation2008), we find a positive and significant coefficient for GROWTH in all specifications. R&D, LEV, and KZ-INDEX all show negative coefficient estimates, which is in line with the rationale on decreasing returns with short-term investment in R&D and capital constraints linked to financial leverage and the KZ-INDEX.
Next, we test whether multicollinearity is a concern in our estimation. We follow prior research (e.g., Lennox et al., Citation2012) and calculate variance-inflation factors (VIFs) based on the estimated regression covariates. Multicollinearity is usually regarded as high (very high) if a VIF exceeds 10 (20) (Belsley et al., Citation1980; Greene, Citation2008; Lennox et al., Citation2012). Our VIFs are considerably below the critical value of 10 (maximum of 3.36 for KZ_INDEX). It is, therefore, unlikely that our results are subject to multicollinearity issues.
4.3. 2SLS, Additional Analyses, and Robustness Tests
A firm’s (abnormal) CSR performance and financial performance are both likely influenced by its corporate governance and related agency issues. While we explicitly control for a firm’s corporate governance strengths and concerns, we cannot fully rule out that other (agency-related) unobservables drive our empirical association between abnormal CSR and financial performance. To mitigate these endogeneity concerns, we conduct a 2SLS instrumental variable approach. Here, our key challenge is to identify a factor that influences abnormal CSR, but not a firm’s profitability, other than through the channel of the variable to be instrumented (i.e., abnormal CSR).
Given that prior research has linked (over-)investments in CSR to CEOs’ desire for public attention (Petrenko et al., Citation2016), we expect CEOs to engage in more opportunistic CSR activities when levels of external attention on CSR are higher. We measure external attention on CSR at the industry-year-level as firm-specific attention levels for CSR are likely endogenous. We proxy external attention on CSR with the frequency of CSR-related questions (CSR_WC) of analysts in earnings conference calls per industry-year-group. We develop a ∼400-item list of common CSR terms based on the GRI standards, which includes terms such as biodiversity, carbon emissions, or waste management. We present the results of this instrumental variable regression in Table . Panel A presents the first-stage and Panel B the second-stage results.
Table 6. 2SLS regression.
In the first stage, we find a significant positive coefficient for CSR_WC, suggesting that abnormal CSR values are higher for firms in industries where analysts ask more CSR-related questions. Turning to the second-stage results, we continue to find a significant negative coefficient for the (instrumented fraction of the) quadradic term of abnormal CSRFootnote18, alleviating endogeneity concerns. Ex post, we also validate the 2SLS estimation with the Sanderson-Windmeijer multivariate F test of excluded instruments, the Kleibergen-Paap underidentification test, and the Anderson–Rubin Wald weak instrument robust test. All three of these tests reject their respective nulls, suggesting that our 2SLS estimation is in line with common validation criteria.
Next, we conduct additional analyses and robustness tests to ensure the validity of the results. We discuss these results here untabulated (all untabulated results are available upon request). To ensure our results are not sensitive to the functional form specification, and to further mitigate endogeneity concerns, we perform propensity score matching, where we match firms based on all the controls of our profitability model. We define the binary treatment variable based on whether a firm’s abnormal CSR is smaller (larger) than the mean minus (plus) 1 standard deviation of abnormal CSR. The average treatment effect (ATE) is significantly negative, with a z-score of −3.62, suggesting that our main results are not sensitive to the functional form specification.
As we estimate (ab)normal CSR per size-year groups, and some of these groups are relatively small, we might be prone to overspecification concerns. To mitigate concerns that these concerns impact our results, we rerun our results with a much simpler measurement approach of (ab)normal CSR – namely, the median value of CSR per two-digit SIC industry-year (see Rouen (Citation2020) for a similar split between unexplained and explained pay disparity). When we do so, we continue to find a significantly negative coefficient for the quadratic term of the alternative measure of abnormal CSR (and insignificant coefficients for normal CSR and the linear abnormal CSR term), showing the robustness of our results to alternative measurement approaches of abnormal CSR.
Our results are also not driven by the particular way of how we measure a firm’s short-term financial performance. When we replace adjusted ROA with adjusted return on equity (ROE), we continue to find a significant positive coefficient for normal CSR (in line with H1) and a significant negative coefficient for the quadratic term of abnormal CSR (in line with H2a/b). Our control variables show similar patterns, except for lagged ROE. Here, we now find a significant negative coefficient compared to a significantly positive coefficient of lagged ROA in our main results.
We cannot directly observe firm-level CSR investments but approximate them with the CSR data from KLD MSCI as an observable output measure. We argue that the link between CSR investments and CSR performance is likely to differ over time, but remains rather stable across similar firms (e.g., large firms) at a given point in time. For this purpose, we estimate normal and abnormal CSR per firm size and year group. What remains as a potential factor is managerial ability. Better managers may translate CSR investments into higher CSR performance than their less able peers. We therefore control for managerial ability using the managerial ability score of Demerjian et al. (Citation2012). The main results of the abnormal CSR and profitability model remain unaffected.
Furthermore, we test whether the results are affected by the specification of the CSR equilibrium model in Equation Equation(1)(2)
(2) . First, we verify whether the results depend on controlling for lagged ROA in the CSR equilibrium model. For instance, the finding on a negative relationship between ABN_CSR and ADJ_ROA could result from the mean reversion of profitability over time. Hence, we repeat our main analysis using ABN_CSR retrieved from the adjusted CSR equilibrium model (e.g., without lagged ROA as a CSR determinant) in Equation (1). We also ensure that the results are unaffected by the choice to estimate the cross-sectional regression per size deciles. We repeat the analysis using the cross-sectional regression per size quintiles (terciles) and fiscal years (instead of size deciles and fiscal years) and find similar results in each robustness check. Furthermore, we want to ensure that our results are not driven by the impact of the financial crisis during the period 2007–2009 (Lins et al., Citation2017) and therefore exclude observations between fiscal years 2007 and 2009 and repeat the analysis. Again, we find similar results.
To mitigate the risk that our results are driven by a rather short-term analysis horizon, we repeat the analysis using future industry-adjusted return on assets as the dependent variable of our analysis in Equation (5). In other words, we repeat the analysis using ADJ_ROAt+1 instead of contemporary ADJ_ROA as the left-hand side variable in Equation (5). Again, the results are similar to those presented in Table .
We also interact ABN_CSR2 with an indicator of whether a firm’s abnormal CSR is positive (dummy = 1) to see whether the effect of abnormal CSR on firm profitability is more or less pronounced for positive or negative abnormal CSR. While the coefficient ABN_CSR2 remains significantly negative, the interaction term is insignificant, suggesting that the negative relation between abnormal CSR and firm performance is driven similarly by positive and negative abnormal CSR.
Recent research highlights that the CSR measures of different databases differ considerably and can significantly impact the empirical results (Diebecker et al., Citation2019).Footnote19 To ensure our results also hold for different concepts of CSR data, we repeat our main analysis using the CSR score from Thomson Reuters ASSET4. ASSET4 is another commonly used dataset in empirical CSR studies, especially in non-U.S. cross-country studies (Diebecker & Sommer, Citation2017). We repeat the analysis using ASSET4 CSR data and continue to find a negative and significant coefficient for ABN_CSR2 regardless of whether we include industry- or firm-fixed effects. Taken together, this indicates that our measure of abnormal CSR is applicable not only for studies using KLD MSCI data, but also for those using ASSET4 data.
Next, we want to ensure that our results are not driven by how we construct the (raw) CSR score. KLD MSCI does not provide a comprehensive score, so we have to construct it based on the firms’ individual CSR strengths and concerns. Consequently, our CSR score is the difference between the sums of strengths and concerns. To ensure our results are not sensitive to the construction of the CSR score based on the KLD MSCI raw data, we also construct the CSR score using two alternative approaches as outlined in Diebecker et al. (Citation2019). The authors present three ways to construct a CSR score based on the KLD MSCI data: M1 as the difference between the sum of strengths and the sum of concerns (our main approach), M2 as the difference between the adjusted sum of strengths and the adjusted sum of concerns, and M3 as the equally weighted pillar scores (weighting performed before calculating the adjusted overall score). We replace our CSR_SCORE with approaches M2 and M3 and continue to find significant results in line with our hypotheses.
5. Conclusion
This paper introduces a measure of abnormal CSR performance to the CSR literature. Prior research examining the link between CSR and firm financial performance is vast, yet still inconclusive about the directional effect. We use these inconsistent findings as a motivator for the innovative approach developed in our study, which provides more scope for the underlying complexity of CSR performance across firms and over time. Based on microeconomic theory, we argue that inefficiencies arise if firms do not invest in CSR around an economic equilibrium point. We expect firms that have an abnormally low or high CSR performance will suffer from lower short-term financial performance. In addition, given a predicted concave relationship between CSR and financial performance, we expect larger deviations from the equilibrium to have a relatively stronger negative link to financial performance.
Our empirical results offer support for our theoretical predictions. First, we find a weakly positive relationship between normal CSR and short-term firm profitability. Second, we show a strong negative link between firm profitability and abnormal CSR in the form of an inverted U-shape. The higher the abnormal CSR, the higher the marginal decrease in firm profitability. Our results are robust to alternative measurements of firm profitability (ROE instead of ROA), different CSR data used (ASSET4 instead of MSCI ESG STATS), an instrumental variable approach, propensity score matching, and a simpler industry-median approach to estimate normal vs. abnormal CSR performance.
Like all empirical studies, our study is also subject to some limitations. First, we acknowledge that our measures of normal and abnormal CSR may be noisy in the cross-section, as may the underlying variables (e.g., CSR data from MSCI ESG STATS). Second, we cannot directly observe a firm’s specific cost–benefit function of CSR. While we include a wide range of control variables based on prior research, we cannot definitively rule out that our empirical proxies of these control variables do not fully capture a firm’s specific cost–benefit function. Third, as with most CSR studies, our results are based on CSR data from large, publicly listed U.S. firms, which should be kept in mind when interpreting (and generalizing) our results.
Future research may benefit from distinguishing between normal and abnormal levels of CSR in several ways. For instance, our measure for abnormal CSR performance may be used in studies that further explore agency problems relating to CSR (Masulis & Reza, Citation2014) or in studies that analyze the link between CSR and earnings management (Kim et al., Citation2012). Given the inverted U-shape we observe between abnormal CSR and short-term financial performance, future studies should include abnormal CSR as a quadratic term.
At the same time, our study also has important practical implications. Corporations are spending more and more on CSR. Hence, it is important for shareholders and other external stakeholders to identify over- or underinvestment in CSR relating to agency issues. So far, external parties have had to rely on CSR rating data from public sources, which provide absolute CSR levels. Our study complements these CSR databases by providing a relative assessment of CSR based on a microeconomic equilibrium model (e.g., abnormally high or low CSR performance), which investors and other external stakeholders may use as a first indicator to identify firm-specific CSR inefficiencies.
Declaration of Interest Statement
This research did not receive any specific grant from funding agencies in the public, commercial, or not-for-profit sectors. We have no potential conflict of interest to disclose.
Acknowledgments
We appreciate helpful comments received from Michel Magnan (editor), two anonymous reviewers, Thomas Kaspereit, Frank Schiemann, as well as from participants at the 2016 NORACC meeting (Copenhagen, Denmark), the 2018 EAA meeting (Milan, Italy), the 2018 BAFA meeting (London, United Kingdom), and the 2018 annual VHB meeting (Magdeburg, Germany). Furthermore, we appreciate helpful comments from reviewers of the 2016 EAA meeting (Maastricht, Netherlands) and the 2016 annual VHB meeting (Munich, Germany). We are also grateful for the valuable work of Bianca Beyer on an earlier draft of this paper and excellent research assistance from Thomas Tammen. All remaining errors are our own.
Disclosure statement
No potential conflict of interest was reported by the author(s).
Data Availability Statement
The data that support the findings of this study are available from public sources as described in the manuscript. Restrictions apply to the availability of these data, which were used under license for this study.
Notes
1 By using this term, we do not mean to make any moral judgment that firms are doing either ‘too little’ or ‘too much’ in terms of CSR. On the contrary, our analysis recognizes CSR as an economically grounded response to shareholders’ demands that considers all stakeholders’ needs. From this perspective, ‘abnormal’ CSR simply means a deviation from a microeconomic CSR equilibrium point.
2 For the sake of readability, we sometimes refer to only ‘CSR’ instead of ‘CSR investments’ or ‘CSR performance’. In essence, CSR investments is our theoretical construct of interest, whereas CSR performance is how we operationalize (i.e., measure) the construct.
3 A more detailed description of the report is available at https://www.ft.com/content/95239a6e-4fe0-11e4-a0a4-00144feab7de (paid subscription).
4 Unfortunately, no direct measure for CSR investments is available. We argue, in line with prior research, that KLD MSCI CSR rating data is the best available proxy for CSR investments (Chen et al., Citation2020). We elaborate more on this issue in section 3.1.
5 For instance, in the fashion industry, it is common practice to outsource production facilities to developing countries to cut wage costs. According to the resource-based view, firms can only benefit from CSR investment if it is not a common industry practice, such that they gain a competitive advantage through differentiation (Barney, Citation2001).
6 We acknowledge that if all firms were to invest at their optimal levels, we would, on average, find no significant relationship between CSR investment and firm performance in the cross-section. However, as our empirical analysis reveals, firms quite frequently invest more/less in CSR than predicted by the CSR equilibrium model—a fact that their peers may benefit from through spillover effects.
7 Several empirical studies find evidence for Jensen’s theoretical predictions—for instance, concerning activities such as mergers, acquisitions, or labor investments (Bertrand & Mullainathan, Citation2003; Dittmar & Mahrt-Smith, Citation2007; Goel & Thakor, Citation2008; Masulis et al., Citation2007; Titman et al., Citation2004; Williamson, Citation1963).
8 Our results do not depend on the choice of CSR rating data from MSCI ESG STATS. In the robustness checks, we repeat the analysis using CSR data from the ASSET4 database and find similar results.
9 Examples of such strengths, or positive performance indicators, that are used to evaluate a company in the category environment are beneficial products and services; property, plant, and equipment; or clean energy. Concerns in the same area are, for instance, hazardous waste or regulatory problems.
10 As MSCI ESG STATS only provides data on the human rights category from 2002 onwards, and our data start in 1991, we exclude this category. Controversial business issues are rather industry-specific, which we control for by including two-digit SIC industry-fixed effects in our regressions.
11 We obtain similar results if we estimate Equation (1) by firm size groups (instead of firm size and year groups).
12 Since MSCI ESG STATS provides the CSR rating data at year-end, and because CSR investment requires some planning/implementation time, we use lagged control variables (e.g., Jo & Harjoto, Citation2012).
13 Our results hold if we estimate (ab)normal CSR using OLS regressions.
14 Quantifying the monetary benefits of CSR expenditures is challenging for firm-outsiders, so prior research has relied on CSR performance data provided by commercial data providers as a proxy for optimal levels of CSR investment, considering both shareholder demands and CSR expenses at the same time (see, e.g., Chen et al., Citation2020).
15 We acknowledge that not all CSR-related costs and benefits are immediatelly observable in the short-term. Hence, our empirical model likely undererstimates the effects of normal and abnormal CSR (i.e., namely those effects that are rather long-term). However, we decided to focus on short-term effects to avoid methodological issues arising from cofounding events, which is a common concern in long-term studies.
16 Our results still hold when we also exclude firms from the utility industry.
17 Our results are not sensitive to whether or not we include these observations.
18 We only include the quadratic term and ommit the linear term as we otherwise would have an overspecified model (i.e., two endogenous variables with only one exogenous variable).
19 Diebecker et al. (Citation2019) provide a comprehensive discussion of the qualitative and quantitative differences across KLD MSCI data and Thomson Reuters ASSET4 (ESG) data.
References
- Aguinis, H., & Glavas, A. (2012). What we know and what we don’t know about corporate social responsibility: A review and research agenda. Journal of Management, 38(4), 932–968. https://doi.org/10.1177/0149206311436079
- Bansal, P. (2003). From issues to actions: The importance of individual concerns and organizational values in responding to natural environmental issues. Organization Science, 14(5), 510–527. https://doi.org/10.1287/orsc.14.5.510.16765
- Barnea, A., & Rubin, A. (2010). Corporate social responsibility as a conflict between shareholders. Journal of Business Ethics, 97(1), 71–86. https://doi.org/10.1007/s10551-010-0496-z
- Barney, J. B. (2001). Resource-based theories of competitive advantage: A ten-year retrospective on the resource-based view. Journal of Management, 27(6), 643–650. https://doi.org/10.1177/014920630102700602
- Beder, S. (1998). Global spin: The corporate assault on environmentalism. Chelsea Green Publishing.
- Belsley, D., Kuh, E., & Welsch, E. R. (1980). Regression diagnostics: Identifying influential data and sources of collinearity. Wiley.
- Bénabou, R., & Tirole, J. (2010). Individual and corporate social responsibility. Economica, 77(305), 1–19. https://doi.org/10.1111/j.1468-0335.2009.00843.x
- Berle, A. A., & Means, G. C. (1932). The modern corporation and private property. Transaction.
- Bertrand, M., & Mullainathan, S. (2003). Enjoying the quiet life? Corporate governance and managerial preferences. Journal of Political Economy, 111(5), 1043–1075. https://doi.org/10.1086/376950
- Biddle, G., Hilary, G., & Verdi, R. (2009). How does financial reporting quality relate to investment efficiency? Journal of Accounting and Economics, 48(2-3), 112–131. https://doi.org/10.1016/j.jacceco.2009.09.001
- Brammer, S., & Millington, A. (2006). Firm size, organizational visibility and corporate philanthropy: An empirical analysis. Business Ethics: A European Review, 15(1), 6–18. https://doi.org/10.1111/j.1467-8608.2006.00424.x
- Brammer, S., Millington, A., & Rayton, B. (2007). The contribution of corporate social responsibility to organizational commitment. International Journal of Human Resource Management, 18(10), 1701–1719. https://doi.org/10.1080/09585190701570866
- Brown, T. J., & Dacin, P. A. (1997). The company and the product: Corporate associations and consumer product responses. Journal of Marketing, 61(1), 68–84. https://doi.org/10.1177/002224299706100106
- Caskey, J., & Ozel, N. B. (2017). Earnings expectations and employee safety. Journal of Accounting and Economics, 63(1), 121–141. https://doi.org/10.1016/j.jacceco.2016.12.002
- Chen, T., Dong, H., & Lin, C. (2020). Institutional shareholders and corporate social responsibility. Journal of Financial Economics, 135(2), 483–504. https://doi.org/10.1016/j.jfineco.2019.06.007
- Collier, J., & Esteban, R. (2007). Corporate social responsibility and employee commitment. Business Ethics: A European Review, 16(1), 19–33. https://doi.org/10.1111/j.1467-8608.2006.00466.x
- Demerjian, P., Lev, B., & McVay, S. (2012). Quantifying managerial ability: A new measure and validity tests. Management Science, 58(7), 1229–1248. https://doi.org/10.1287/mnsc.1110.1487
- Deng, X., Kang, J.-K., & Low, B. S. (2013). Corporate social responsibility and stakeholder value maximization: Evidence from mergers. Journal of Financial Economics, 110(1), 87–109. https://doi.org/10.1016/j.jfineco.2013.04.014
- Dickinson, V. (2011). Cash flow patterns as a proxy for firm life cycle. The Accounting Review, 86(6), 1969–1994. https://doi.org/10.2308/accr-10130
- Diebecker, J., Rose, C., & Sommer, F. (2019). Spoiled for choice: Does the selection of sustainability datasets matter? (Working Paper).
- Diebecker, J., & Sommer, F. (2017). The impact of corporate sustainability performance on information asymmetry: The role of institutional differences. Review of Managerial Science, 11(2), 471–517. https://doi.org/10.1007/s11846-016-0195-y
- Di Giuli, A., & Kostovetsky, L. (2014). Are red or blue companies more likely to go green? Politics and corporate social responsibility. Journal of Financial Economics, 111(1), 158–180. https://doi.org/10.1016/j.jfineco.2013.10.002
- Dittmar, A., & Mahrt-Smith, J. (2007). Corporate governance and the value of cash holdings. Journal of Financial Economics, 83(3), 599–634. https://doi.org/10.1016/j.jfineco.2005.12.006
- Edmans, A. (2011). Does the stock market fully value intangibles? Employee satisfaction and equity prices. Journal of Financial Economics, 101(3), 621–640. https://doi.org/10.1016/j.jfineco.2011.03.021
- El Ghoul, S., Guedhami, O., Kwok, C. C. Y., & Mishra, D. R. (2011). Does corporate social responsibility affect the cost of capital? Journal of Banking and Finance, 35(9), 2388–2406. https://doi.org/10.1016/j.jbankfin.2011.02.007
- Eurosif. (2016). Eurosif response to European Commission’s public consultation on long-term and sustainable investment. Eurosif Report.
- Fairfield, P. M., & Yohn, T. L. (2001). Using asset turnover and profit margin to forecast changes in profitability. Review of Accounting Studies, 6(4), 371–385. https://doi.org/10.1023/A:1012430513430
- Fatemi, A., Fooladi, I., & Tehranian, H. (2015). Valuation effects of corporate social responsibility. Journal of Banking and Finance, 59, 182–192. https://doi.org/10.1016/j.jbankfin.2015.04.028
- Friede, G., Busch, T., & Bassen, A. (2015). ESG and financial performance: Aggregated evidence from more than 2000 empirical studies. Journal of Sustainable Finance and Investment, 5(4), 210–233. https://doi.org/10.1080/20430795.2015.1118917
- Gamerschlag, R., Möller, K., & Verbeeten, F. (2011). Determinants of voluntary CSR disclosure: Empirical evidence from Germany. Review of Managerial Science, 5(2–3), 233–262. https://doi.org/10.1007/s11846-010-0052-3
- Garcia-Castro, R., Arino, M. A., & Canela, M. A. (2010). Does social performance really lead to financial performance? Accounting for endogeneity. Journal of Business Ethics, 92(1), 107–126. https://doi.org/10.1007/s10551-009-0143-8
- Gillan, S. L., Hartzell, J. C., Koch, A., & Starks, L. T. (2010). Firms’ environmental, social and governance (ESG) choices, performance and managerial motivation. Working Paper.
- Goel, A. M., & Thakor, A. V. (2008). Overconfidence, CEO selection, and corporate governance. The Journal of Finance, 63(6), 2737–2784. https://doi.org/10.1111/j.1540-6261.2008.01412.x
- Goss, A., & Roberts, G. S. (2011). The impact of corporate social responsibility on the cost of bank loans. Journal of Banking and Finance, 35(7), 1794–1810. https://doi.org/10.1016/j.jbankfin.2010.12.002
- Graves, S. B., & Waddock, S. A. (1994). Institutional owners and corporate social performance. Academy of Management Journal, 37(4), 1034–1046. https://doi.org/10.5465/256611
- Greene, W. (2008). Econometric analysis. Pearson/Prentice Hall.
- Grewal, J., Serafeim, G., & Yoon, A. (2016). Shareholder activism on sustainability issues (Working Paper).
- Griffin, J. J., & Mahon, J. F. (1997). The corporate social performance and corporate financial performance debate: Twenty-five years of incomparable research. Business and Society, 36(1), 5–31. https://doi.org/10.1177/000765039703600102
- Grisard, C., Annisette, M., & Graham, C. (2020). Performative agency and incremental change in a CSR context. Accounting, Organizations and Society, 82, 1–22. https://doi.org/10.1016/j.aos.2019.101092
- Habib, A., & Hasan, M. M. (2019). Corporate social responsibility and cost stickiness. Business and Society, 58(3), 453–492. https://doi.org/10.1177/0007650316677936
- Heal, G. (2005). Corporate social responsibility: An economic and financial framework. Geneva Papers on Risk and Insurance: Issues and Practice, 30(3), 387–409. https://doi.org/10.1057/palgrave.gpp.2510037
- Hemingway, C. A., & Maclagan, P. W. (2004). Managers’ personal values as drivers of corporate social responsibility. Journal of Business Ethics, 50(1), 33–44. https://doi.org/10.1023/B:BUSI.0000020964.80208.c9
- Hillman, A. J., & Keim, G. D. (2001). Shareholder value, stakeholder management, and social issues: What’s the bottom line? Strategic Management Journal, 22(2), 125–139. https://doi.org/10.1002/1097-0266(200101)22:2<125::AID-SMJ150>3.0.CO;2-H
- Hong, H., Kubik, J. D., & Scheinkman, J. A. (2012). Financial constraints on corporate goodness (Working Paper).
- Jensen, M. C. (1986). Agency costs of free cash flow, corporate finance, and takeovers. American Economic Review, 76(2), 323–329.
- Jensen, M. C., & Meckling, W. H. (1976). Theory of the firm: Managerial behavior, agency costs and ownership structure. Journal of Financial Economics, 3(4), 305–360. https://doi.org/10.1016/0304-405X(76)90026-X
- Jo, H., & Harjoto, M. A. (2012). The causal effect of corporate governance on corporate social responsibility. Journal of Business Ethics, 106(1), 53–72. https://doi.org/10.1007/s10551-011-1052-1
- Khan, M., Serafeim, G., & Yoon, A. (2016). Corporate sustainability: First evidence on materiality. The Accounting Review, 91(6), 1697–1724. https://doi.org/10.2308/accr-51383
- Kim, H. R., Lee, M., Lee, H. T., & Kim, N. M. (2010). Corporate social responsibility and employee-company identification. Journal of Business Ethics, 95(4), 557–569. https://doi.org/10.1007/s10551-010-0440-2
- Kim, Y., Park, M. S., & Wier, B. (2012). Is earnings quality associated with corporate social responsibility? The Accounting Review, 87(3), 761–796. https://doi.org/10.2308/accr-10209
- Klein, J., & Dawar, N. (2004). Corporate social responsibility and consumers’ attributions and brand evaluations in a product–harm crisis. International Journal of Research in Marketing, 21(3), 203–217. https://doi.org/10.1016/j.ijresmar.2003.12.003
- Lamont, O., Polk, C., & Saaa-Requejo, J. (2001). Financial constraints and stock returns. Review of Financial Studies, 14(2), 529–554. https://doi.org/10.1093/rfs/14.2.529
- Laufer, W. S. (2003). Social accounting and corporate greenwashing. Journal of Business Ethics, 43(3), 253–261. https://doi.org/10.1023/A:1022962719299
- Lennox, C. S., Francis, J. R., & Wang, Z. (2012). Selection models in accounting research. The Accounting Review, 87(2), 589–616. https://doi.org/10.2308/accr-10195
- Lev, B., Petrovits, C., & Radhakrishnan, S. (2010). Is doing good good for you? How corporate charitable contributions enhance revenue growth. Strategic Management Journal, 31(2), 182–200. https://doi.org/10.1002/smj.810
- Lins, K. V., Servaes, H., & Tamayo, A. (2017). Social capital, trust, and firm performance: The value of corporate social responsibility during the financial crisis. The Journal of Finance, 72(4), 1785–1824. https://doi.org/10.1111/jofi.12505
- Lundgren, T. (2011). A microeconomic model of corporate social responsibility. Metroeconomica, 62(1), 69–95. https://doi.org/10.1111/j.1467-999X.2010.04087.x
- Luo, X., & Bhattacharya, C. B. (2006). Corporate social responsibility, customer satisfaction, and market value. Journal of Marketing, 70(4), 1–18. https://doi.org/10.1509/jmkg.70.4.001
- Margolis, J. D., & Walsh, J. R. (2003). Misery loves rethinking companies: Social initiatives. Administrative Science Quarterly, 48(2), 268–305. https://doi.org/10.2307/3556659
- Masulis, R. W., & Reza, S. W. (2014). Agency problems of corporate philanthropy. Review of Financial Studies, 28(2), 592–636. https://doi.org/10.1093/rfs/hhu082
- Masulis, R. W., Wang, C., & Xie, F. (2007). Corporate governance and acquirer returns. The Journal of Finance, 62(4), 1851–1889. https://doi.org/10.1111/j.1540-6261.2007.01259.x
- McWilliams, A., & Siegel, D. (2000). Corporate social responsibilty and financial performance: Correlation or misspeficiation? Strategic Management Journal, 21(5), 603–609. https://doi.org/10.1002/(SICI)1097-0266(200005)21:5<603::AID-SMJ101>3.0.CO;2-3
- McWilliams, A., & Siegel, D. (2001). Corporate social responsibility: A theory of the firm perspective. Academy of Management Journal, 26(1), 117–127. https://doi.org/10.2307/259398
- MSCI. (2015). MSCI ESG KLD STATS 1991–2014 data sets.
- Narayanan, M. P. (1985). Managerial incentives for short-term results. The Journal of Finance, 40(5), 1469–1484. https://doi.org/10.1111/j.1540-6261.1985.tb02395.x
- Nguyen, P. A., Kecskés, A., & Mansi, S. (2020). Does corporate social responsibility create shareholder value? The importance of long-term investors. Journal of Banking and Finance, 112, 1–21. https://doi.org/10.1016/j.jbankfin.2017.09.013
- Petrenko, O. V., Aime, F., Ridge, J., & Hill, A. (2016). Corporate social responsibility or CEO narcissism? CSR motivations and organizational performance. Strategic Management Journal, 37(2), 262–279. https://doi.org/10.1002/smj.2348
- Petrovits, C. M. (2006). Corporate-sponsored foundations and earnings management. Journal of Accounting and Economics, 41(3), 335–362. https://doi.org/10.1016/j.jacceco.2005.12.001
- Prior, D., Surroca, J., & Tribó, J. A. (2008). Are socially responsible managers really ethical? Exploring the relationship between earnings management and corporate social responsibility. Corporate Governance: An International Review, 16(3), 160–177. https://doi.org/10.1111/j.1467-8683.2008.00678.x
- Ramus, C. A., & Montiel, I. (2005). When are corporate environmental policies a form of greenwashing? Business and Society, 44(4), 377–414. https://doi.org/10.1177/0007650305278120
- Rouen, E. (2020). Rethinking measurement of pay disparity and its relation to firm performance. The Accounting Review, 95(1), 343–378. https://doi.org/10.2308/accr-52440
- Servaes, H., & Tamayo, A. (2013). The impact of corporate social responsibility on firm value: The role of customer awareness. Management Science, 59(5), 1045–1061. https://doi.org/10.1287/mnsc.1120.1630
- Titman, S., Wei, K. C. J., & Xie, F. (2004). Capital investments and stock returns. Journal of Financial and Quantitative Analysis, 39(4), 677–700. https://doi.org/10.1017/S0022109000003173
- Waddock, S. A., & Graves, S. B. (1997). Quality of management and quality of stakeholder relations. Business and Society, 36(3), 250–279. https://doi.org/10.1177/000765039703600303
- Wang, H., Choi, J., & Li, J. (2008). Too little or too much? Untangling the relationship between corporate corporate philantropy and firm financial performance. Organization Science, 19(1), 143–159. https://doi.org/10.1287/orsc.1070.0271
- Williamson, O. E. (1963). Managerial discretion and business behavior. The American Economic Review, 53(5), 1032–1057.
- Yoshikawa, H. (1980). On the “q” theory of investment. The American Economic Review, 70(4), 739–743.
Appendix
Table A1. Variable definitions.