
 ?Mathematical formulae have been encoded as MathML and are displayed in this HTML version using MathJax in order to improve their display. Uncheck the box to turn MathJax off. This feature requires Javascript. Click on a formula to zoom.
Abstract
In 2014, all larger Swedish private firms were required, at short notice, to adopt a new reporting standard (K3) based on IFRS for SMEs (2009 version). Using this shock to the reporting environment, we study the effects of the new reporting standard on groups’ financial reporting properties and cost of debt financing. We find that, following the introduction of K3, private groups exhibit reporting changes consistent with improved accounting quality; their financial statement comparability increases; and their cost of debt declines. Our results suggest that the cost-of-debt decline is related to changes in accounting numbers that are imputed to lending models. Our findings add to the literature on factors shaping private firms’ financial reporting and inform the ongoing discussion on accounting regulation for private firms.
1. Introduction
In 2014, all larger Swedish private firmsFootnote1 were required, on short notice, to adopt a new reporting standard (K3) based on IFRS for SMEs (2009 version). In developing the K3 standard,Footnote2 the Swedish national standard setter aimed to harmonize reporting practices and increase reporting transparency, thus serving firms and the external users of those firms’ financial statements. In this study, we examine the impact of the mandatory adoption of K3 on Swedish private groups’ financial reporting properties (i.e. accounting properties, financial statement comparability, and real earnings management) and cost of debt.
In contrast to full IFRS, which is mandatory for listed firms in EU member states, the adoption of IFRS for SMEs is at the discretion of each member state. However, full adoption is uncommon in Europe; instead, several European countries have created nationally adapted versions of IFRS for SMEs; Gassen (Citation2017) identifies four such countries: Sweden, Estonia, Ireland, and the United Kingdom.Footnote3 One reason why full adoption has been uncommon in Europe is because certain requirements in IFRS for SMEs conflict with EU Directives (EFRAG, Citation2010). As a result, evidence on the effects of IFRS-for-SMEs adoption at the firm level is still scarce, and we know little about whether and how mandatory adoption of such a reporting standard affects the financial reporting properties and cost of debt of private firms.
What accounting standards private firms apply is of high importance because, in the absence of stock market-based incentives for high-quality financial reporting, financial reporting regulation is the primary channel through which accounting quality can be affected. Mandatory adoption of national standards based on IFRS for SMEs is of particular interest in this context, as IFRS for SMEs may be characterized as a high-quality standard for private firms.Footnote4 However, there are factors that may obstruct improvements in reporting quality for mandatory adopters of IFRS-for-SME-based standards. First, while voluntary adoption of full IFRS in private firms is associated with higher reporting quality (Bassemir & Novotny-Farkas, Citation2018), studies in listed-firm settings demonstrate significant heterogeneity in the quality of mandatory IFRS adoption (Daske et al., Citation2013).Footnote5 Second, it is not clear whether adoption of a higher-quality reporting standard would yield improvements in the cost of external financing. Private firms typically have more concentrated ownership than publicly listed firms, rely more on bank financing, and often have close ties with their capital providers (Burgstahler et al., Citation2006; Hope & Vyas, Citation2017). Consequently, since key stakeholders in private firms are likely to have inside access to corporate information, reporting quality in such contexts may not play a significant role in debt-pricing decisions.
To investigate the effects of mandatory adoption of national standards based on IFRS for SMEs, we use the Swedish regulatory change in 2014 that requires consolidated financial statements presented by private firms to be prepared under the so-called K3 standard, with the only alternative being the voluntary adoption of full IFRS. Prior to the adoption of K3 in 2014, Swedish GAAP was characterized by a high degree of flexibility. It offered opportunities for ‘cherry-picking’ and practice-based choices in areas not explicitly covered by reporting standards (e.g. financial instruments). The K3 standard was developed with the purpose of overcoming these deficiencies and providing preparers and users with one coherent set of accounting standards.
Using a matched sample of 9,509 observations from Swedish privately held groups from 2010 to 2016 and their Norwegian counterparts,Footnote6 who were not subject to any major reporting regulation change during this period, we investigate how the financial reporting properties and the cost of debt changed following the adoption of K3. Our findings suggest that earnings smoothing has declined, reported return on assets has increased, financial statement comparability has increased, and the cost of debt has declined following the mandatory adoption of K3.
As external capital providers are among the key stakeholders in private firms, we investigate changes in financial reporting properties and full IFRS adoption spillover effects as potential channels through which the introduction of K3 may affect debt pricing decisions. We show that the decline in the cost of debt is most pronounced within firms that exhibit improvements in their financial reporting comparability and within those that reduce real and accounting earnings management. We do not find evidence that spillover effects from full IFRS adoption could be driving our results. Overall, our channel analysis suggests that changes in financial statement properties translate to cost-of-debt reductions because of changes in financial statement figures that are used as input for lenders’ in-house financial analysis as well as in credit score agencies’ credit score-setting process.
Our study makes several contributions to the literature. First, we add to the growing accounting literature on private firms. This is warranted, as much of the empirical work in accounting focuses on publicly listed firms (see reviews by Bar-Yosef et al., Citation2019; Beuselinck et al., Citation2021), even though most firms, for example, in the 28 EU member states are private (99.81% in 2019), and in nearly all countries, private firms account for at least 90% of the total number of firm observations (Beuselinck et al., Citation2021); similar numbers have been documented in the US. Recent studies on private firms show that product competition makes private firms avoid mandatory disclosure (Bernard, Citation2016) and that European private firms engage in size management to avoid mandatory disclosure and audits (Bernard et al., Citation2018). Another stream of the literature explores the determinants and consequences of voluntary full IFRS adoption (e.g. Bassemir, Citation2018; Bassemir & Novotny-Farkas, Citation2018; Cameran et al., Citation2014; Chi et al., Citation2013; Francis et al., Citation2008). We add to the literature on private firms by examining the impact of mandatory reporting regulation on private groups’ financial reporting properties and their cost of debt financing.
Second, this study complements the prior literature by providing empirical evidence on the economic consequences of adoption of IFRS for SME-based reporting standards at the firm level (privately held groups) in a European context (Sweden). Prior literature in this area provides an overview of accounting professionals’ preparedness for IFRS for SMEs adoption (e.g. Hussain et al., Citation2012; Uyar & Güngörmüş, Citation2013), accounting experts’ views on the contribution of IFRS for SMEs to private firm financial reporting (Gassen, Citation2017), as well as stakeholders’ (e.g. Albu et al., Citation2013) and preparers’ perceptions of costs and benefits associated with IFRS for SMEs adoption (e.g. Litjens et al., Citation2012; Zuelch & Burghardt, Citation2010). Furthermore, prior empirical-archival studies mainly focus on country-level determinants of IFRS for SMEs adoption(Kaya & Koch, Citation2015).
Third, our study contributes to the literature that investigates the link between financial reporting quality and debt contracting. Generally, prior literature suggests that high financial-reporting quality reduces information asymmetries with creditors (e.g. Balsmeier & Vanhaverbeke, Citation2018; Ding et al., Citation2016; Vander Bauwhede et al., Citation2015) but also that creditors prefer smooth earnings, an attribute often associated with earnings management (Gassen & Fülbier, Citation2015), and the use of alternative information sources (e.g. Cassar et al., Citation2015; Leftwich, Citation1983). Moreover, prior research also shows that mandatory disclosure improves banking relationships (Breuer et al., Citation2018), facilitates private firms’ access to venture capital and private equity financing (Baik et al., Citation2021), and increases the mimicking of capital structures (Bernard et al., Citation2021). Our study adds to this stream of research by examining the effect on cost of debt financing during a period of substantial changes in the reporting standard environment of Swedish firms. We show that the mandatory adoption of the new accounting standards generally reduced groups’ interest rates, primarily due to changes in the financial reporting figures that lenders and credit agencies use in their analysis. This finding thus highlights the benefits of financial reporting regulations in a private firm setting.
From a regulatory perspective, the findings reported in this study also add to the debate on financial reporting regulations for privately held firms. We show that mandatory accounting regulation can have a significant effect on firms’ financial reporting properties and debt pricing outcomes when stock market-based incentives are lacking.
The remainder of the paper is structured as follows: Section 2 provides a review of the Swedish regulatory setting. Section 3 discusses prior studies and develops the four hypotheses of this study. Section 4 describes the sampling and research design. Section 5 presents the results of the analyses. Section 6 presents additional analyses and robustness checks. Section 7 concludes the paper.
2. Background and Regulatory Setting
Listed firms around the world are subject to stock market regulations that tend to require consolidated financial statements to be prepared in accordance with either IFRS or a well-recognized national GAAP (e.g. US GAAP). In contrast, accounting regulations for private firms are more of a national matter, as legal entities must follow national company and tax legislation. Some private legal entities that control other entities will also have to prepare consolidated financial statements.Footnote7 Historically, these privately held groups have applied national GAAP; however, following the growing importance of full IFRS, and the development of IFRS for SMEs, national GAAPs may gradually have become obsolete with regard to consolidated financial statements.Footnote8 Jurisdictions have addressed this issue differently, for example, by allowing privately held groups to voluntarily adopt full IFRS, by allowing or requiring the use of IFRS for SMEs (or an adapted version of IFRS for SMEs), or sticking to continuing the use of a more traditional national GAAP (e.g. Gassen, Citation2017).
2.1. Overview of the Swedish Reporting Environment pre-K3
In Sweden, parent companies of privately held groups have the option of preparing consolidated financial statements in accordance with full IFRS (voluntary IFRS adoption). This option was introduced in connection with the mandatory adoption of EU-endorsed IFRS for listed firms in 2005. However, most firms chose to report under national GAAP, which meant following the Swedish Annual Accounts Act (SAAA; framework legislation based on the EU Directives), guidance from the Swedish Financial Accounting Standards Council (SFASC), and guidance from the Swedish Accounting Standards Board (SASB). Based on these three sources, the pre-K3 regulation landscape can be categorized as follows: (1) accounting areas with no or poor guidance beyond SAAA, (2) accounting areas with competing guidance from different Swedish standard setters (SFASC and SASB), and (3) accounting areas where SASB provides general leeway to deviate from the guidance provided by the SFASC. This reporting regulation landscape allowed for reporting ‘cherry-picking,’ a practice that was further exacerbated by the fact that during 2004–2013, no Swedish standard-setter issued any guidance in anticipation of the new K3 standard, thus leaving many grey areas in the reporting regulation.
2.2. Review of K3 Adoption
K3 was issued in 2012 with mandatory application to begin in the financial year starting after January 1, 2014. Due to the short period between issuance and mandatory application, very few firms chose early adoption of the standard. K3 must be used as a reporting standard by large firms (both for the individual financial statements of large legal entities and for the consolidated financial statements of large privately held groups); that is, a firm that fulfils at least two of the following criteria for two years in a row (based on EU thresholds):
Has more than 50 employees;
Has more than SEK 40 million (around EUR 4 million) in total assets;
Reports annual revenues of more than SEK 80 million (around EUR 8 million).
The K3 standard is a comprehensive package based on IFRS for SMEs (2009 version), adapted to meet the EU accounting directives and Swedish legislation, and complemented in areas where IFRS for SMEs had limited coverage (e.g. business combinations). The K3 standard was part of an even more comprehensive standard-setting project (the K-project), where all existing standards and other guidance for limited-liability firms (both large and small, both stand-alone legal entities and groups preparing consolidated financial statements) were replaced by new standards (K2 and K3), mandatorily applied for the first time in 2014.Footnote9
Following the K3 adoption,Footnote10 the discretion for accounting choice was significantly reduced, particularly in areas with no explicit prior guidance or in areas where reporting entities had a leeway option. We review several areas in more detail below (see Table OS1 in the Online Supplement for a more comprehensive overview).
Financial instruments comprise a complex accounting field for Swedish private firms. The complexity shows in that the K3 standard forces preparers to make an overt policy choice between a cost-based approach (Chapter 11) and a fair-value based approach (Chapter 12). This stands in sharp contrast to the pre-K3 environment, where SAAA includes little information, and IAS 39 was one of the few standards never adopted by SFASC (Category 1 in the Table OS1 in the Online Supplement). One possible effect of K3 may have been that groups with some ‘home-made’ fair value accounting might decide to discontinue their reporting practices due to the IAS 39-like requirements introduced by K3 in Chapter 12. It is also likely that foreign currency hedging-reporting activities were affected by the new requirements, both in terms of evaluating the consequences from choosing either cost-based or fair-value-based accounting but potentially also in terms of requirements regarding documentation, measurement of hedge effectiveness, and other disclosure demands, which may have affected entities’ reporting choices (and actual hedging activities).
Further, it is likely that K3 adoption has resulted in substantial reporting changes for groups with off-balance sheet leases and pension obligations, long-term contracts, and R&D activities SFASC (Category 2 in the Table OS1 in the Online Supplement). In the pre-K3 period, all these accounting areas were subject to competing guidance; following the K3 adoption, groups were likely to report more leases and pension obligation on the balance sheet (due to changes in capitalization requirements for such contracts), report revenues from long-term contracts earlier (as a consequence of moving from the completed-contract to the percentage-of-completion method), and expense a higher proportion of their R&D (due to more restrictive R&D capitalization criteria). The financial statements of the groups with high levels of PP&E were also affected by the transition from the maintain/enhance approach to the components approach, which tended to increase capitalization (and depreciation) of subsequent costs.
In the areas of impairment and provisions, high levels of flexibility have historically been observed owing to the leeway offered by the SASB SFASC (Category 3 in the Table OS1 in the Online Supplement). Impairment (with later reversals) and provisions (with later reversals) have been used for earnings-smoothing purposes (Andersson & Hellman, Citation2019; Hellman, Citation2011). Such smoothing should have become more difficult to perform under the K3 standard in the areas of impairment and provisions. In areas related to group accounting (business combinations, consolidation, associated companies, and joint ventures), it is likely that firms applied the SFASC guidance.
Overall, K3 was introduced as a comprehensive set of standards that restricted the reporting discretion for adopting groups. However, it is important to highlight that the new reporting standard has differentially affected different groups depending on their business models and asset structures. For instance, under the new standard, groups with high PP&E were able to report smoother earnings than in the pre-K3 period, whereas the opposite is true for groups that reported high R&D capitalization pre-K3. We examine these differences in more detail in Section 6.2.
3. Prior Research and Development of Hypotheses
3.1. Financial Reporting in Private Firms
Financial reporting regulations are expected to increase the quality of firms’ financial statements, improve reporting comparability, and subsequently decrease information asymmetries between corporate insiders and outsiders, primarily the owners.Footnote11 In private firms, however, owners often have access to internal information, and the demand for financial information is mainly driven by relationships with lenders, suppliers, employees, and the government (Hope & Vyas, Citation2017), whereas high-quality reporting is limited by firms’ unwillingness to publicly disclose internal information (Bernard et al., Citation2018; Bernard, Citation2016; Breuer et al., Citation2018; Minnis & Shroff, Citation2017). That is, compared to public firms, private firms face different types of agency conflicts and information asymmetries, resulting in different financial reporting demands.Footnote12
In the absence of financial reporting regulations, financial reporting is shaped by the supply and demand forces mentioned above. On the one hand, financial reporting plays a role in resolving agency conflicts arising primarily from contractual relationships with creditors, an important source of long-term financing for private firms (as documented by Goyal et al. (Citation2011) for Europe and Brav (Citation2009) for the UK). In bank-financing relationships, both formal and informal contracts arise to minimize agency costs (Armstrong et al., Citation2010). While informal relationships are build on aspects such as reputation and corporate governance rules, formal contracts include loan-related details, including loan amount, duration, interest rate, and debt covenants (Armstrong et al., Citation2010). Thus, both the existence and the structure of debt contracts may incentivize managers of private firms to consider the effects on certain financial-ratio targets, as well as to avoid violation of debt covenants, when making accounting choices related to accounting methods and accounting judgments (Watts & Zimmerman, Citation1986). In addition to complying with ongoing debt contracts, financial information may be used as a credible signaling device during the credit-granting decision period to reduce informational frictions faced by external credit providers (Hope & Vyas, Citation2017). Correspondingly, extant research shows that managers of European private firms cater to creditors’ demands and report smoother earnings (Gassen & Fülbier, Citation2015).Footnote13
On the other hand, due to firm-level unwillingness to voluntarily disclose information, lack of reporting regulation is likely to result in socially undesirable, i.e. too low, levels of disclosure and transparency in financial reporting. Indeed, Bernard (Citation2016) shows that German private firms avoided public disclosures until a strict enforcement regime was implemented and that this avoidance increased with the level of financial constraints in firms. Furthermore, European private firms tend to use size management to avoid mandatory disclosures and audit requirements (Bernard et al., Citation2018), while German private firms prefer lower levels of reporting in the absence of a financial reporting regulation (Breuer et al., Citation2018). Similarly, based on a survey of European private firms and international standard setters, Minnis and Shroff (Citation2017) document that, due to proprietary costs, most of the firms would not continue to disclose their financial results publicly if the regulation was removed. These findings indicate that private firms have incentives to avoid public disclosures about their financial situation because the perceived private costs of disclosure exceed its benefits. As such, the market solution creates individually optimal but jointly suboptimal financial reporting outcomes (Kothari et al., Citation2010).
Overall, with a high flexibility reporting requirement, firm-level reporting incentives are likely to yield financial statements that cater to each firm’s specific needs but may not be directly comparable across firms and may not be sufficiently transparent from the perspective of an external user. The primary goal of reporting regulation in such a setting is thus to restrict the influence of individual managers’ incentives on financial reporting choices, and stricter reporting regulations allow for lower agency costs, increased market-wide cost savings, and other positive externalities such as reporting standardization.Footnote14
However, notwithstanding these potential positive externalities, it is not obvious that the adoption of K3 would significantly change the Swedish private groups’ reporting landscape. Indeed, prior studies on mandatory IFRS adoption in listed firms show that accounting-quality improvements in relation to adoption of a new standard are dependent on firms’ reporting incentives (Christensen et al., Citation2015; Daske et al., Citation2013), strength of the enforcement regime (Ahmed et al., Citation2013), and subjectivity allowed under IFRS Standards compared to domestic reporting standards (Capkun et al., Citation2016). For European private firms specifically, Gassen and Fülbier (Citation2015) demonstrate that firms with larger shares of creditor financing report smoother earnings. Hence, firm-level reporting incentives may result in label adoption, limiting the effects of the new reporting standard on financial reporting properties. Whether mandatory accounting standard adoption affects the accounting properties, such as reported earnings volatilities, extent of accrual use, and profitability, of these firms is an empirical question. In light of these arguments, we formulate the following hypothesis in a null form:
H1a: The mandatory adoption of the K3 standard is not related to changes in accounting properties.
In situations where accounting discretion is decreased and hinders earnings management through accounting practices, firms may shift from accrual-based earnings management to real earnings management to meet debt covenants and financial targets (e.g. Khurana et al., Citation2018). For instance, Cohen et al. (Citation2008) show that following the enactment of the Sarbanes-Oxley Act in 2002, firms switched from accrual-based to real earnings management methods. Similarly, if the K3 standard restricts the accounting discretion allowed under pre-K3 Swedish GAAP, managers’ attention may be drawn to real earnings management activities. However, as discussed earlier, it is also possible that groups only adopt the K3 standard nominally, in which case such groups would not have any new incentives for real earnings management. Hence, we formulate the following sub-hypothesis in a null form:
H1b: The mandatory adoption of the K3 standard is not related to changes in real earnings management.
While accounting properties primarily pertain to the characteristics of financial numbers at the firm level, an important feature of high-quality reporting is that it is expected to provide financial market participants with transparent and comparable financial statements that assist them in making economic decisions. From a regulatory point of view, transparency and comparability can be enhanced through standardization of financial statements, as standardized financial statement information reduces information-processing costs (Minnis & Shroff, Citation2017). In the Swedish setting, the adoption of K3 may have improved the comparability of the financial statements in terms of the types of financial items reported.Footnote15 We thus formulate the following sub-hypothesis in a null form:
H1c: The mandatory adoption of the K3 standard is not related to the changes in financial statement comparability.
3.2. The Effects on Firms’ Financing Costs
As previously stated, extant literature provides evidence that private firms’ reporting decisions are shaped by debt contracting considerations. We next turn to the other side of this relationship, focusing on the lenders’ debt pricing decisions and the role of financial reporting properties in these decisions. Prior research suggests that high-quality reporting and timely information on financial position can provide decision-useful information and consequently reduce information asymmetries between the firm and its creditors; this is because such information provides basis for evaluating firms’ future cash flows and assessing firms’ creditworthiness, thus increasing debt-contracting efficiency (Hope & Vyas, Citation2017; Jensen & Meckling, Citation1976; Watts & Zimmerman, Citation1986). High accounting quality has therefore been shown to increase private firms’ access to bank debt (Balsmeier & Vanhaverbeke, Citation2018; Ding et al., Citation2016; García-Teruel et al., Citation2014a; Van Caneghem & Van Campenhout, Citation2012), decrease the effective interest cost (Allee & Yohn, Citation2009; Ding et al., Citation2016; Vander Bauwhede et al., Citation2015), and increase the probability of using long-term debt and having a higher proportion of long-term debt in total debt (De Meyere et al., Citation2018).Footnote16
However, alternative information sources can partially substitute formal financial reporting in meeting creditors’ information demands. Cassar et al. (Citation2015) document that the interest rate benefits from accrual accounting decrease when a borrower’s credit score is higher and/or the length of its banking relationship with the lender is longer. Minnis and Sutherland (Citation2017) show that banks request financial statements for only about half of the loan applications, and that this request is related to borrower credit risk, relationship length, collateral, and the provision of business tax returns. Further, Leftwich (Citation1983) suggests that borrowers and lenders negotiate, without any regulatory intervention, their own set of accounting information that is necessary for monitoring lending agreements. Bigus and Hillebrand (Citation2017) argue that through relationship lending, a bank can acquire and interpret proprietary information via private channels and does not need financial reports. Thus, private firms may have limited interest in public disclosures, as creditors obtain firm-specific information through private or alternative channels rather than through public disclosures and make debt-pricing decisions based on information other than financial reports.
In sum, prior evidence shows that creditors reward high accounting quality with lower cost of debt (e.g. Vander Bauwhede et al., Citation2015); however, creditors also prefer smooth earnings, an attribute often associated with earnings management (Gassen & Fülbier, Citation2015), and use alternative information sources (e.g. Cassar et al., Citation2015; Leftwich, Citation1983). Thus, it is an empirical question whether implementation of the K3 standard will impact the financing costs for groups subject to this regulation change. On the one hand, higher perceived accounting quality associated with K3 adoption and/or changes in financial reporting properties may have resulted in lower information asymmetries and potentially shifted lenders’ focus from alternative information channels to financial statements (Breuer et al., Citation2018). On the other hand, if in our setting creditors primarily obtain information via alternative information sources, then the K3 adoption and associated changes in financial reporting properties may not play a role in debt-pricing decisions. Further, considering the insights from prior research that lenders prefer smoother earnings, more reduced opportunities for earnings smoothing following the K3 adoption may also have had adverse effects on lender relationships and cost of debt. We therefore formulate our second hypothesis (null form) as follows:
H2: The mandatory adoption of the K3 standard is not associated with changes in cost of debt.
4. Research Design
4.1. Data Sources and Sample Construction
We test our hypotheses using a matched sample of Swedish (treatment sample) and Norwegian (control sample) privately held groups.Footnote17 We focus only on consolidated financial statements in order to exclude tax-related drivers of accounting choices (K3 offers a number of accounting choice exceptions for legal entities related to tax effects).Footnote18 We choose Norway as a control sample due to its geographic and economic proximity to Sweden, as well as the reporting framework stability for privately held groups. The most recent major regulatory change affecting private firms in Norway took place in 1998; since then, no major modifications of mandatory nature have occurred, making Norwegian privately held groups a suitable control sample for our analyses. The Swedish data come from the Serrano database, which contains financial information from the Swedish business register. In addition, we manually collected information about audit firms and the applied accounting standards (old Swedish GAAP, full IFRS, K3) directly from the annual reports. This is in line with the suggestion from Beuselinck et al. (Citation2021) that data from national business registers be used more extensively. The Norwegian data come from Experian AS. We also manually checked this data for the applied accounting standard (i.e. Norwegian GAAP or full IFRS).
Our sample construction process is shown in . We start by collecting firm-year observations for the years 2010–2016 for private Swedish and Norwegian firms that were above the mandatory K3-adoption threshold in 2013, as described in Section 2.2. We only consider firms above the total assets, revenue, and employee size thresholds for mandatory K3-adoption in 2013 to ensure that K3 adoption for the affected firms is of a mandatory nature.Footnote19 We identify 52,149 Swedish and 46,345 Norwegian group-year observations that satisfied these requirements. As we focus only on groups, we eliminate all legal entities from our sample. Next, we eliminate all the groups that prepared their financial statements under IFRS at any point in 2010–2016. We do so to ensure that the effects observed in our subsequent analyses can be reasonably attributed to K3-adoption rather than IFRS-related financial reporting changes in either Swedish or Norwegian groups. Finally, we retain only groups that have at least two firm-year observations before and after the K3 adoption, and only those observations for which we are able to calculate our key measures. After these restrictions, we retain 1,068 Swedish groups (6,972 group-years) and 1,402 Norwegian groups (9,138 group-years).
Table 1. Sample construction.
Using these observations, we construct a matched sample by matching Swedish and Norwegian groups on the 2013 values of asset size, leverage, sales growth, return on assets, equity growth, auditor BIG4 status, and industry classification. We use propensity score matching without replacement. We successfully match the 727 Swedish groups with the 727 Norwegian groups, yielding 9,509 group-year observations. Following the matching procedure, we observe that both groups are similar in terms of all matching characteristics in the matching year as well as in the two years prior; these statistics are reported in .
Table 2. Results from matching procedure.
4.2. Variable Construction and Empirical Models
4.2.1. New Standard Adoption Identifiers
To capture the effects of the adoption of the new accounting standard, we construct the indicator variables K3f and POSTt. These variables identify the groups that switched to K3 in 2014 (K3f) and the period following the K3 adoption (POSTt). All Swedish groups are classified as K3 adopters, all Norwegian groups are a control group, and POSTt is set to 1 for all financial years starting on or after January 1, 2014.
4.2.2. Measures for Accounting Properties
We use four different measures to capture changes in the accounting properties following the K3 adoption. Following Barth et al. (Citation2008), we construct a three-year rolling standard deviation of change in ROA (SD3_D_ROAft). Following Ahmed et al. (Citation2013), we construct a three-year rolling correlation between total accruals and cash flows (CORR3ft). For both measures, higher values indicate lower earnings smoothing. These measures primarily capture the effects of transitioning between the capitalization and expensing approaches, as well as changes in fair value reporting rules and financial instrument accounting practices.
We also construct a measure of total absolute accruals (UNSIGNED_ACCRft) to capture average changes in accrual accounting around the K3 adoption. While previous literature typically uses absolute accruals as a measure of the extent of earnings management, we use this measure to capture the extent of accrual-based reporting driven by accounting regulation changes.
As a final proxy for changing accounting properties, we investigate return on assets, structured as net income divided by total average assets. Our focus on ROAft is from the perspective of accounting regulation effects on reported results rather than economic business performance. The accounting regulation changes introduced by K3 may have mechanically affected ROA levels due to changes in fair-value accounting, capitalization practices, leasing and pension accounting, and other changes in accounting practices. As such, the empirical question is whether the new accounting standard has had a significant effect on the reported performance.
4.2.3. Measure for real earnings management
The more restrictive nature of the K3 Standard relative to the earlier available accounting approaches may have prompted groups to engage in real earnings management as a substitute to previously available accounting choices. To capture changes in such behaviors, we follow Khurana et al. (Citation2018) and calculate REM3ft as a 3-year rolling correlation between the managed and unmanaged ROA components based on abnormal discretionary accruals. We then multiply the measure by (−1) so that a higher REM3ft value indicates higher real earnings management.
4.2.4. Financial Statement Comparability-Related Measures
We use two measures to capture the changes in financial statement characteristics around the K3 adoption.
First, we develop a financial statement comparability score, which is calculated as follows:
where COMMON REPORTED ACCOUNTSft is a group-year count of non-missing accounts that are also reported by at least one other group in that industry-country-year combination, UNIQUE REPORTED ACCOUNTSft is a group-year count of non-missing accounts that are only reported by that group in the industry-country-year combination, COMMON INDUSTRY ACCOUNTSindustry,country,t is a count of non-missing accounts that are filed by at least two groups in that industry-country-year combination. We use ten industries based on the first digit of the European NACE classification. The measure is calculated independently for the Swedish and Norwegian subsamples; that is, changes in one country’s reporting regulation do not influence another country’s comparability measures.
The intuition behind this measure is that information usefulness is related not only to its granularity (captured by FIRM_ENTRIESft as described below; see also Chen et al. (Citation2015)), but also to its comparability, as high comparability reduces information processing costs. If comparable groups decide to report different accounting items, the comparability of their financial statements is distorted, and COMPARABILITYft scores will be lower in that industry-country-year combination. The introduction of a more restrictive reporting standard may limit such accounting choices by eliminating certain reporting items that are not universally applied by peers, thus increasing financial statement comparability among all peers.Footnote20As such, this measure captures the extent to which financial reporting becomes more standardized following the adoption of the K3 standard.
Second, we construct a basic measure (FIRM_ENTRIESft), which is a count of the number of non-zero financial statement line items reported by a group in a given year. This measure allows directly testing for the changes in granularity of the financial statements around the K3 adoption. This measure thus allows inferring what kind of changes–that is, account consolidation or increasing reporting granularity–drive any observed changes in COMPARABILITYft.
4.2.5. Measure for cost of debt
We calculate the effective interest rate (EFF_INT_RATEft) following Minnis (Citation2011). We calculate this measure as a ratio of financial expenses scaled by average total debt to external credit institutions, truncated at 5% and 95%. We calculate EFF_INT_RATEft only for group years with reported non-zero external debt. We note that the degree of granularity of income statement reporting does not allow us to fully isolate the interest expenses, attributed to debt from the external financial institutions, from other types of financial expenses. As such, EFF_INT_RATEft is likely inflated. Further, following the K3 adoption, financial expenses may increase due to changed leasing and pension reporting requirements (note, however, that leasing- and pension-related obligations are reported separately from the debt to external financial institutions and thus do not affect the denominator in EFF_INT_RATEft calculation). The results from the effective interest rate analyses should be interpreted with these measurement features in mind.
5. Results
5.1. Descriptive Statistics
The descriptive statistics for the treatment and control samples are presented in . Both samples are similar in terms of size, auditor BIG4 status, and profitability. In contrast, the Norwegian sample groups on average report higher leverage and exhibit somewhat lower sales growth. To account for these differences, we include in our models the group fixed effects, industry-year fixed effects, as well as a range of group-level controls in each specification.
Table 3. Descriptive statistics.
We also observe significant differences in our outcome variables between the two samples. Changes in ROA volatility (SD3_D_ROAft), absolute accruals (UNSIGNED_ACCRft), and reporting comparability (COMPARABILITYft) are, on average, higher in the Norwegian sample, whereas the Swedish groups exhibit larger negative correlations between accruals and cash flows, indicating lower earnings smoothing activity (CORR3ft), higher real earnings management activity (REM3ft), and, on average, higher effective interest rates (EFF_INT_RATEft). The Swedish groups appear to report, on average, more financial statement line items than their Norwegian counterparts (FIRM_ENTRIESft); however, we avoid making any direct comparisons of these figures due to different database reporting structures for the Swedish and Norwegian groups.
5.2. Analysis of K3 Adoption Effects
To investigate the effects of K3 adoption on corporate outcomes, we use the following difference-in-differences model in our multivariate analyses:
(1)
(1)
where OUTCOMEft is one of the corporate outcomes (financial reporting properties, real earnings management, or cost of debt), as described in Section 4.2. The key coefficient of interest in main specifications is β3. It captures the differences in reporting behavior changes following the introduction of K3 between K3 adopters (treatment sample) and Norwegian private groups reporting under local GAAP (control sample).
All our models include a range of control variables that are expected to correlate with our outcome variables (Balsmeier & Vanhaverbeke, Citation2018; Barth et al., Citation2008; Chaney et al., Citation2004; Downes et al., Citation2018; Minnis, Citation2011; Vural, Citation2017). Generally, we control for firm asset size (SIZEft, natural logarithm of consolidated assets), debt-to-asset ratio (LEVft), annual sales growth (SalesGRft), asset turnover (TURNOVERft,) calculated as revenue scaled by lagged total assets (in the specifications for accounting properties and real earnings management) or return on assets (ROAft; in the specifications for comparability-related characteristics and cost of debt; calculated as net income scaled by lagged total assets), and the presence of BIG4 auditor (BIG4ft). In the financial reporting comparability analysis, we include a loss indicator (LOSSft) and its interaction with ROAft. In the cost-of-debt analysis, we also control for the asset structure by including PP&E and intangible assets, scaled by lagged total assets (PPERATIOft and INTANGRATIOft, respectively) and debt coverage, calculated as EBITDA scaled by lagged interest-bearing debt to credit institutions (DEBT_COVERAGEft). All continuous variables are winsorized at 1% and 99%. In all specifications, we include country-level GDP growth (GDPft) and prevailing corporate income tax rates (STRft) to account for country-level differences between Sweden and Norway. Finally, we include group and industry-year fixed effects to account for unobserved group-level trends and industry-year specific effects. In all specifications, we cluster standard errors by groups. For exact specifications for each estimation, see the detailed reported results in Table OS2 in the Online Supplement.
5.2.1. K3 effects on accounting properties
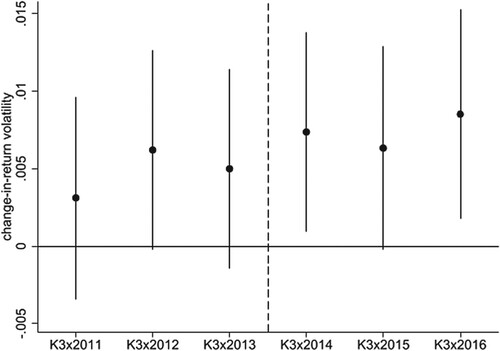
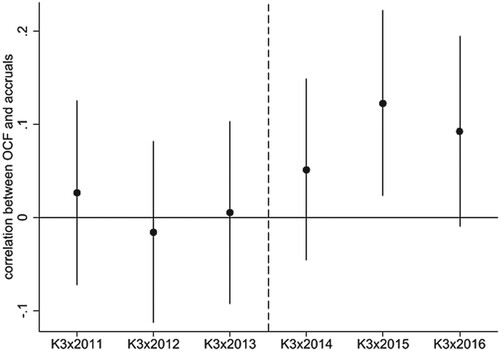
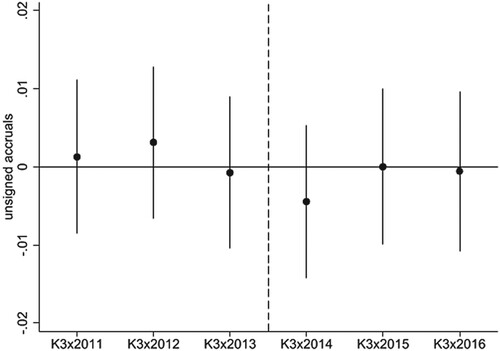
The results from analyzing accounting properties around K3 adoption are reported in , specifications (1) to (4). We observe positive and significant coefficients for the K3f×POSTt interaction with SD3_D_ROAft and CORR3ft as dependent variables, suggesting that the extent of income smoothing declined in K3 groups relative to the control sample of Norwegian groups following the introduction of K3.Footnote21 The coefficient for UNSIGNED_ACCRft is negative but not significant at conventional levels. The interaction coefficient for ROAft is positive at 0.009 and significant at the 1% level. We graphically present the trends of these outcome variables in Figures . These figures suggest that the parallel trend assumption is not violated in these four specifications.
Figuere 1. Timing of the effect on the change-in-return volatility (SD3_D_ROAft). This figure presents the K3f × YEAR coefficients obtained from estimating Model (1) on SD3_D_ROAft, where we replace POSTt with year indicator variables. The year 2010 serves as a base year. The bold dots indicate the estimated coefficients. Vertical bars indicate 95% confidence intervals for the estimated coefficients. Dashed bars separate the pre-treatment and post-treatment periods.
Figuere 2. Timing of the effect on the correlation between operating cash flows and accruals (CORR3ft). This figure presents the K3f × YEAR coefficients obtained from estimating Model (1) on CORR3ft, where we replace POSTt with year indicator variables. The year 2010 serves as a base year. The bold dots indicate the estimated coefficients. Vertical bars indicate 95% confidence intervals for the estimated coefficients. Dashed bars separate the pre-treatment and post-treatment periods.
Figuere 3. Timing of the effect on the unsigned accruals (UNSIGNED_ACCRft). This figure presents the K3f × YEAR coefficients obtained from estimating Model (1) on UNSIGNED_ACCRft, where we replace POSTt with year indicator variables. The year 2010 serves as a base year. The bold dots indicate the estimated coefficients. Vertical bars indicate 95% confidence intervals for the estimated coefficients. Dashed bars separate the pre-treatment and post-treatment periods.
Figuere 4. Timing of the effect on the return on assets (ROAft). This figure presents the K3f × YEAR coefficients obtained from estimating Model (1) on ROAft, where we replace POSTt with year indicator variables. The year 2010 serves as a base year. The bold dots indicate the estimated coefficients. Vertical bars indicate 95% confidence intervals for the estimated coefficients. Dashed bars separate the pre-treatment and post-treatment periods.
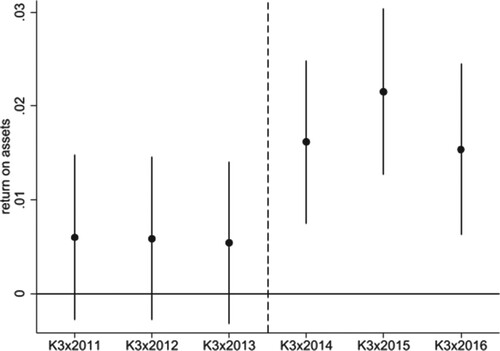
Table 4. Effects of K3 adoption.
As discussed in Section 2.2., declining income-smoothing activity (measured as SD3_D_ROAft and CORR3ft) is an expected outcome due to transitioning between the capitalization and expensing approaches, changes in fair value reporting rules, and changes in financial instrument accounting rules. To shed more light on the increases that we observe in ROAft, we manually check 60 Swedish groups (corresponding to about 8% of treatment groups) with largest ROAft changes in 2014 to identify whether and which changes in the financial reporting rules have affected such developments. The insights from these checks suggest that the ROAft increases observed in our empirical tests are driven by groups changing their depreciation/amortization schedules, removing previously capitalized intangible assets from their balance sheets, and engaging more in the component capitalization.Footnote22
Overall, these results suggest that mandatory K3 adoption has reduced observed earnings smoothing and increased the reported profitability. Therefore, we formally reject Hypothesis 1a that K3 adoption is not associated with a change in the accounting properties among K3 adopters.Footnote23
5.2.2. K3 Effects On Real Earnings Management
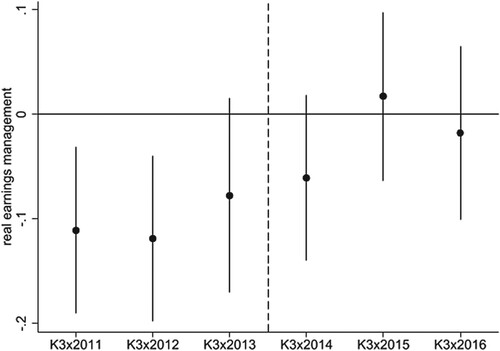
Our previous results indicate that income smoothing (measured as SD3_D_ROAft and CORR3ft) declined following the introduction of K3. Should such developments have occurred, at least in part due to the more restrictive characteristics of K3 relative to prior reporting standards, groups may rely more on real earnings management under K3 to achieve their reporting goals (Ipino & Parbonetti, Citation2017). The results reported in , specification (5), do not provide substantial evidence that K3 adopters engaged more in real earnings management (measured as REM3ft) relative to the matched sample of Norwegian groups (K3f×POSTt coefficient positive but not significant at conventional levels).Footnote24 We thus do not formally reject Hypothesis 1b.
5.2.3. K3 effects on Financial Statement Comparability-Related Characteristics
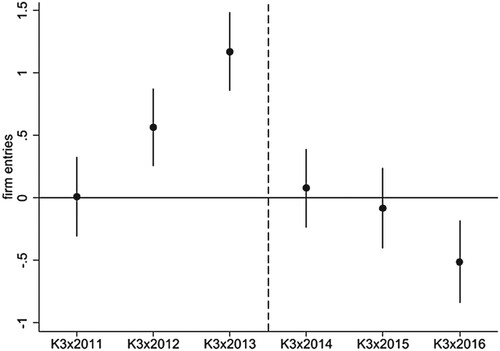
We report the analysis for COMPARABILITYft and FIRM_ENTRIESft in , specifications (6) and (7). The estimation results indicate that, for K3 groups, the number of reported items decreased. We highlight that, as demonstrated in Panel G, K3 adoption has broken the trend of an increasing number of reported financial statement line items. That is, while the parallel trend assumption in the FIRM_ENTRIESft specification is not satisfied, we nevertheless observe a significant change in reporting behavior around the K3 adoption.
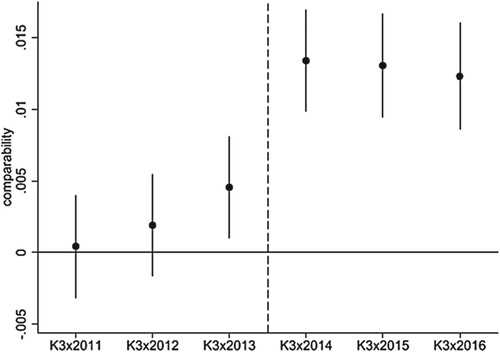
On the other hand, the COMPARABILITYft results indicate that, relative to the control sample of Norwegian groups, the comparability levels have increased for the K3 adopters (K3f×POSTt coefficient positive and significant at 1% level). In , we observe some COMPARABILITYft increases in 2013 and a significant jump following the adoption of K3 in 2014. Comparability increase in 2013 may, at least to some extent, be explained by the increases in firm entries that we report in . Thus, while the parallel trend assumption is not strictly satisfied in these specifications, our results nevertheless suggest that K3 adoption, at least to some extent, affected the financial statement structure.Footnote25 We thus formally reject Hypothesis 1c.
Figuere 5. Timing of the effect on the real earnings management (REM3ft). This figure presents the K3f × YEAR coefficients obtained from estimating Model (1) on REM3ft, where we replace POSTt with year indicator variables. The year 2010 serves as a base year. The bold dots indicate the estimated coefficients. Vertical bars indicate 95% confidence intervals for the estimated coefficients. Dashed bars separate the pre-treatment and post-treatment periods.
Figuere 6. Timing of the effect on financial statement comparability (COMPARABILITYft). This figure presents the K3f × YEAR coefficients obtained from estimating Model (1) on COMPARABILITYft, where we replace POSTt with year indicator variables. The year 2010 serves as a base year. The bold dots indicate the estimated coefficients. Vertical bars indicate 95% confidence intervals for the estimated coefficients. Dashed bars separate the pre-treatment and post-treatment periods.
Figuere 7. Timing of the effect on financial statement entries (FIRM_ENTRIESft). This figure presents the K3f × YEAR coefficients obtained from estimating Model (1) on FIRM_ENTRIESft, where we replace POSTt with year indicator variables. The year 2010 serves as a base year. The bold dots indicate the estimated coefficients. Vertical bars indicate 95% confidence intervals for the estimated coefficients. Dashed bars separate the pre-treatment and post-treatment periods.
To shed more light on these financial statement structure changes, we check which reporting items tend to disappear from the financial reports following the introduction of K3. Most notably, we observe a systematic, industry-level disappearance of line items such as extraordinary income, items affecting comparability, depreciation of various tangible assets, amortization of R&D, and unclassified depreciation/amortization. All these items are income statement items; to some extent, the disappearance of these items reflects a switch by some K3-adopters from cost-by-nature to cost-by-function presentation, where depreciation/amortization is allocated to functions, such as cost of sales. While these changes cannot be directly attributed to changes in reporting regulation (both presentation formats were allowed both before and after the K3 adoption), it appears that the regulatory overhaul has triggered an overview of reporting practices more broadly in at least some groups, resulting in higher financial statement standardization.
5.2.4. K3 Effects On The Cost Of Debt
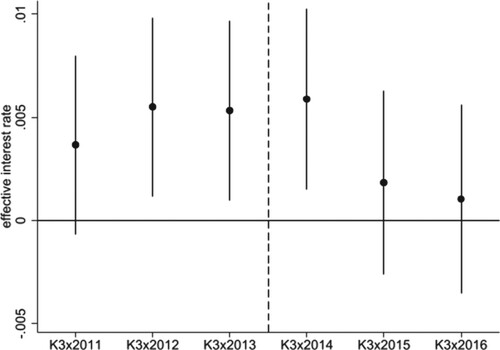
So far, our analysis has provided evidence that accounting properties and financial statement comparability have changed in groups subject to mandatory K3 adoption. We next investigate whether these changes also affected the privately held groups in terms of their cost of debt. The results of this analysis are reported in , specification (8). We find that relative to the Norwegian control sample, groups that adopted K3 experienced a significant decline in their cost of debt (POSTt x K3f coefficient negative and significant at the 1% level). These findings are consistent with prior studies that document capital-market improvements following the IFRS adoption and/or improved public disclosure requirements (Breuer et al., Citation2018; Brüggemann et al., Citation2013; Daske et al., Citation2013; De George et al., Citation2016). shows that the Swedish groups had a higher cost of debt than the Norwegian groups in 2011–2014 but experienced a significant reduction in 2015. This is consistent with lagging debt pricing readjustments following the changes in financial statement characteristics. We thus formally reject Hypothesis 2.
Figuere 8. Timing of the effect on effective interest rates (EFF_INT_RATEft + 1 + 1). This figure presents the K3f × YEAR coefficients obtained from estimating Model (1) on EF_INT_RATEft + 1, where we replace POSTt with year indicator variables. The year 2010 serves as a base year. The bold dots indicate the estimated coefficients. Vertical bars indicate 95% confidence intervals for the estimated coefficients. Dashed bars separate the pre-treatment and post-treatment periods.
6. Additional Analyses and Robustness Tests
6.1. Channels for Cost of Debt Effects
Our main analysis suggests an important economic consequence of the K3 adoption in terms of declining cost of debt. In this section, we investigate two potential channels for this effect. First, we investigate the variations in changes in financial statement properties. If lenders directly or indirectly base their decisions on financial statement numbers, then the extent to which these numbers changed following the K3 adoption should be related to the cost of debt changes. Second, we investigate whether cost-of-debt declines could be attributed to changes in the information environment due to peers that report, or begin reporting, under full IFRS.Footnote26
6.1.1. Changes in financial reporting properties and cost of debt
We first zoom into the link between changes in cost of debt and changes in financial reporting properties. The financial statement numbers can be used in lender decision-making either directly (i.e. in the in-house analysis) or indirectly (as an input to the credit score calculation bythe credit-score agencies).Footnote27 The financial statement changes that occur due to the adoption of the K3 standard may thus have a direct effect on the credit risk evaluation and, subsequently, on the cost of debt.Footnote28
To investigate this channel, we calculate the changes in all reporting-property measures from 2013 to 2016 and identify the groups with changes in the top quartile of the distribution. We then construct a time-invariant indicator variable (INCREASEf) and set it to 1 for those groups. We construct a corresponding indicator variable (DECREASEf), which we set to 1 for groups with reporting-property changes in the bottom quartile of the distribution. Using these indicator variables, we test how changes in reporting-properties measures are associated with the changes in cost of debt.
The results of these estimations are presented in . Our results suggest that K3 adopters with SD3_D_ROAft and CORR3ft changes in the top quartile of the distribution experience the strongest effective interest rate reductions (K3f×POSTt×INCREASEf coefficients negative and significant at 1% and 10% levels in specifications (1) and (2), respectively). We also observe that firms with largest negative changes in REM3ft appear to drive the cost-of-debt declines, indicating that cost-of-debt declines accumulate in firms that do not engage in real earnings management behavior (K3f×POSTt×DECREASEf coefficient negative and significant at the 5% level in specification (5)). Finally, our results indicate that increases in financial reporting comparability levels and the number of financial statement line items are associated with a more pronounced reduction in cost of debt (K3f×POSTt×INCREASEf coefficient negative and significant at 1% in specifications (6) and (7)), whereas decreases in the variables are associated with increased cost of debt (K3f×POSTt×DECREASEf negative and significant at 5% in specification (6), negative but marginally insignificant in specification (7)). Overall, these results suggest that lenders prefer reporting properties that are mostly consistent with the market-wide mandatory K3 adoption consequences, thus suggesting that the K3 adoption-driven financial statement changes, at least to some extent, influence the cost-of-debt reductions.
Table 5. Effect on cost of debt by different types of reporting changes.
6.1.2. Cost of Debt And Spillover Effects
We next test whether some of the cost-of-debt improvements may arise due to spillover effects from IFRS-reporting peer-information disclosure. This is because some groups have chosen to adopt full IFRS instead of K3. Indeed, in 2013 (2014), the number of voluntary first-time IFRS adopters was about three (seven) times higher than that during the remaining sample-period years. More disclosure by IFRS adopters may improve the overall information environment and yield positive externalities for their peers as well (Badertscher et al., Citation2013). In other words, the cost-of-debt reduction may, at least to some extent, arise due to more groups adopting full IFRS and not because of K3 effects on the financial statements.
We test this peer-information spillover channel in two ways. First, we identify whether groups adopting K3 have any industry peers (as per 4-digit NACE classification) that report under IFRS. We construct an indicator variable (IFRS_PEERSft) that is set to 1 if the focal group has at least one peer reporting under IFRS in a given year (i.e. IFRS_PEERSft is a time-varying variable).Footnote29 Second, we construct a time-invariant indicator variable (IFRS_PEERS_K3f) that is set to 1 for K3-adopting groups with peers that have adopted IFRS in 2013 or 2014. We then use these measures to investigate differences in cost-of-debt outcomes due to peer-reporting behavior following the K3 adoption.
The results of this investigation are reported in . They suggest that the effects of K3 adoption on effective interest rates are less pronounced in groups with IFRS-reporting peers (positive significant coefficient for K3f×POSTt× IFRS_PEERSft in column (1)) but that such groups had lower cost of debt even before K3 adoption (negative significant coefficient for IFRS_PEERSft). This result is consistent with the transparency argument that IFRS reporters create positive externalities for their peers by improving the information environment and reducing the cost of debt. We do not find any significant results for the K3 groups with peers that adopted IFRS in 2013 or 2014 (positive insignificant coefficient for K3f×POSTt× IFRS_PEERS_K3f interaction in column (2)).
Table 6. Cost of debt and IFRS peers.
Overall, these results indicate that IFRS-reporting peers do create positive transparency-related externalities, but that IFRS adopters are not driving the effective cost-of-debt reductions for K3 adopters following the reporting-regulation change.
6.2. Cross-sectional Analyses
Our main results suggest declining income smoothing, increasing accounting profitability, increasing comparability, and declining cost of debt for K3-adopting groups. In this section, we briefly report the results of testing the robustness of our main findings and the additional analysis relating to the K3 adoption effects for independent legal entities and listed firms.
6.2.1. Differential Exposure to K3 Regulation Changes
As discussed in Section 2, real estate firms were affected by the K3 adoption primarily due to the transition from the maintain/enhance approach to the components approach, allowing for more extensive cost capitalization with higher subsequent depreciation expenses. Thus, for the real estate groups, observed earnings smoothing is expected to increase following the K3 adoption. For groups with high intangible assets before the K3 adoption, the new reporting standard has restricted the scope of R&D capitalization. As a result, observed earnings smoothing for such groups is expected to decline. Consistent with these expectations, we find evidence of increased earnings smoothing for real estate groups but declining earnings smoothing for groups with high intangible assets before the K3 adoption. We also observe declining (increasing) real earnings management among real estate (high intangible asset) groups (see Table OS3 in the Online Supplement); this is consistent with a view of accounting-standard restrictions and real earnings management functioning as each other’s substitutes (e.g. Khurana et al., Citation2018).
6.2.2. Groups with Changing Auditors
A specific feature of the K3-reporting framework development in Sweden was that BIG4 firms were actively involved in the process (Sigonius, Citation2019) and thus could be considered experts in K3 implementation. Switches to a BIG4 auditor could be interpreted as signals of high-level compliance and scrutiny when a new reporting standard is adopted. Accordingly, the K3-adoption effect could be expected to be less pronounced among groups that switch to a non-BIG4 auditor around the reporting regulation change.Footnote30
To test this, we construct an indicator variable (from BIG4f) and set it to 1 for groups that have switched from a BIG4 to a non-BIG4 audit firm at any point during 2013–2015. We do so for both the treatment (Swedish) and the control (Norwegian) groups. We also construct an indicator variable (to BIG4f) that is set to 1 for groups that have switched from a non-BIG4 to a BIG4 audit firm in 2013–2015.
The results of this analysis are reported in Table OS4 in the Online Supplement. Consistent with our expectations, we find that groups switching from a BIG4 to a non-BIG4 auditor exhibit declining return volatilities, increasing real earnings management, and declining financial statement comparability. We do not find any significant changes for the groups switching to BIG4 auditors.
6.3. K3 Adoption Effects in Legal Entities and Listed Firms
6.3.1. K3 effects in Independent Legal Entities
We exclude independent legal entities from our main sample, as the K3 standard includes tax-related reporting exceptions for legal entities in their preparation of individual financial statements. Thus, within K3, there is a discrepancy between the reporting standards applicable to the legal entity’s preparation of individual financial statements and those applicable to the group’s consolidated financial statements. This limits the potential impact of K3 adoption on accounting properties; however, K3 adoption may have triggered other reporting changes in the form of increasing financial statement comparability and corresponding capital market benefits. To test this, we construct a separate matched sample of Swedish and Norwegian independent legal entities. The results (reported in Table OS5 in the Online Supplement) do not show any significant changes in accounting properties for K3 adopters but indicate increasing real earnings management, increasing financial statement comparability, increasing number of financial statement line items, and declining effective interest rates for such legal entities.
6.3.2. K3 Adoption Effects In Listed Firms
To the extent that the supply of capital is limited, a natural question arises of whether cost-of-debt reductions for K3-adopting privately held firms occur at the expense of listed firms’ cost of debt. We test this by creating a matched sample of Swedish and Norwegian listed firms and investigate the cost-of-debt changes across these samples. We find no significant difference in the cost of debt between these two sets of firms following the adoption of K3 in Sweden. The results of these tests are reported in Table OS6 in the Online Supplement.
7. Conclusions
In this study, we investigate the impact of the mandatory adoption of a new IFRS for SMEs-based reporting standard (K3) on Swedish private groups’ financial reporting properties and cost of debt. We utilize a setting where, prior to the adoption, Swedish GAAP for private firms was characterized by flexibility, incomplete guidance, and opportunities for ‘cherry-picking’ among competing standards. In 2014, larger Swedish private firms had to adopt K3, a comprehensive set of newly developed accounting standards, also covering areas previously not covered. Our empirical results suggest that the earnings smoothing of Swedish privately held groups has declined following the introduction of the K3 standard, while the reported profitability, on average, increased. Furthermore, our results suggest that the financial reporting comparability increased after the adoption of K3, and that the K3 adoption was associated with a reduction in group-level cost of debt. This is in line with the argument that high-quality reporting reduces information asymmetries between informed managers of privately held groups and their creditors, consequently lowering their borrowing costs. Our additional analysis suggests that the cost-of-debt reduction is due to the changing properties and comparability of the financial statement items that are used as an input for lenders’ in-house analysis as well as in external credit-score setting process.
The results of this study have important implications for policymakers and private firms. Globally, many private firms are not required to provide disclosures and audited financial statements, and this makes this study relevant for jurisdictions considering the introduction of mandatory standards for private firms. Our results suggest that financial reporting regulation using IFRS for SMEs-based standards affects the financial reporting properties in a way that is consistent with higher reporting quality. Furthermore, our results indicate that private firms can, through increased reporting comparability, reduce information asymmetries with contracting parties.
Our study has some limitations. Most importantly, we investigate a setting where an IFRS for SMEs-based standard has replaced more flexible local standards. While we could expect similar effects of mandatory IFRS for SMEs-based adoption in settings where local standards provide ambiguous reporting guidance, our results should be extrapolated to other jurisdictions keeping this institutional feature in mind. Also, we primarily focus on the K3 adoption effects in the context of one type of external stakeholder, i.e. external credit institutions. Future research could investigate the implications of IFRS for SMEs adoption, and the use of changing financial information, for other stakeholders such as owners/investors, regulators, and employees. Finally, our focus in this study is the mandatory adoption of a new reporting standard, and we thus investigate entities that have limited choice in the matter. However, it is important to recognize that the adoption of a stricter reporting regime will trigger some firms to avoid exposure to the new reporting requirements by managing their size (as shown by Bernard et al., Citation2018), changing their organizational structure, or discontinuing certain types of reporting. We still know little about this side of reporting-regulation changes, as well as the costs associated with such behavior.
Online_Supplement_.docx
Download MS Word (49.7 KB)Acknowledgements
Accepted by Beatriz García Osma. We thank two anonymous reviewers, Rodrigo Verdi (discussant), Ting Dong, Mariya Ivanova, and Juha-Pekka Kallunki, the participants of the internal research seminar at the Stockholm School of Economics, the EAA 2021 Virtual Congress, and the European Accounting Review 2021 Annual Conference for their helpful comments. We are grateful to John Christian Langli for providing us with the data on Norwegian private firms.
Disclosure statement
The authors report there are no competing interests to declare.
Data Availability
The data are available from the sources identified in the text.
Supplemental Data and Research Materials
Supplemental data for this article can be accessed on the Taylor & Francis website, https://doi.org/10.1080/09638180.2022.2085758https://doi.org/10.1080/09638180.2022.2085758
Additional information
Funding
Notes
1 Private firms comprise two categories of entities: privately held groups that prepare consolidated financial statements and limited-liability legal entities that prepare individual financial statements.
2 The K3 standard was issued by the Swedish Accounting Standards Board in late 2012. It is based on IFRS for SMEs (2009 version) and has the same chapter structure as this standard, but adaptations were made to comply with EU Directives and Swedish legislation (e.g., Sigonius, Citation2019). In areas where IFRS for SMEs (2009 version) is incomplete, full IFRS was used for further guidance (e.g., consolidation, financial instruments, share-based payment, pension obligations).
3 Eighty-four countries require or permit the use of IFRS for SMEs, while the standard is under consideration in twelve additional countries (IFRS Foundation, Citation2022).
4 For example, Gassen (Citation2017) refers to interviews where respondents view IFRS for SMEs as a (p. 542) ‘[…] principles-based, simplified, and up-to-date financial reporting regime that remains relatively similar to IFRS.’
5 Studies focusing on IFRS adoption in listed firms suggest that such adoption improves accounting information comparability across countries (Yip & Young, Citation2012) and is associated with less earnings management, more timely loss recognition, and higher value relevance (Barth et al., Citation2008). On the other hand, mandatory IFRS adoption is also associated with an increase in observed reporting aggressiveness and income smoothing (e.g., Ahmed et al., Citation2013). However, these insights, notably mixed, may not apply to private firms due to different stakeholder structures and reporting incentives.
6 We chose Norway as a control sample due to geographic and economic proximity, regulatory environment stability, and data availability; see Section 4.2.
7 Consolidation requirements vary across countries but are typically a function of group size and ownership structure.
8 Traditional national GAAPs may lack comprehensive standards for areas such as share-based payment, financial instruments, pensions, and business combinations.
9 A simplified reporting standard K2 for smaller firms was issued in 2008 and K3 in 2012; however, as both standards needed to be in force before the smaller firms could choose between them, none of the standards were, de facto, adopted by firms until the mandatory adoption date (financial years beginning on January 1, 2014, or later). This creates an empirical setting where private firms before 2014 applied the flexible Swedish GAAP. In 2014, they had to adopt K3.
10 We focus on the K3 standard applicable to consolidated financial statements. The K3 standard for legal entities deviates from the K3 standard for consolidated reports and is beyond the scope of this review.
11 Many existing accounting studies examine the relationship between IFRS/IAS adoption and financial-reporting quality among publicly listed firms. These studies show that even though the same reporting standards are applied, significant differences in firms’ reporting practices remain. These findings have been attributed to either variation in reporting incentives across firms (e.g., Ahmed et al., Citation2013; Christensen et al., Citation2015) or subjectivity and enforcement difficulties under IFRS Standards compared to domestic reporting standards (e.g., Capkun et al., Citation2016). Also see extensive reviews by Brüggemann et al. (Citation2013), De George et al. (Citation2016), and Leuz and Wysocki (Citation2016).
12 Extant research on private firms examines the link between accounting-standard regulation and accounting quality but focuses primarily on voluntary adoption of IFRS (e.g., Bassemir & Novotny-Farkas, Citation2018; Cameran et al., Citation2014; Chi et al., Citation2013; Francis et al., Citation2008). Since the reporting incentives of voluntary vs. mandatory adopters as well as for listed vs. private firms differ (e.g., Burgstahler et al., Citation2006; Christensen et al., Citation2015), this literature does not allow for direct inferences about the potential effects of mandatory IFRS / IFRS for SMEs adoption on private firms’ reporting properties and economic consequences.
13 While the relationship between trade credit and financial information has been less investigated, evidence exists that suppliers also reward lower earnings variability with more generous trade credits (García-Teruel et al., Citation2014b).
14 For a discussion on rationales for regulating disclosures, see Leuz and Wysocki (Citation2008), and Minnis and Shroff (Citation2017) for regulation in the private firm setting.
15 Prior research on financial reporting comparability builds on the notion that comparability is high when, given similar economic events, firms produce similar financial statements, and uses stock-market performance as identification of economic events (De Franco et al., Citation2011; Neel, Citation2017). Such analysis is not available for private firms that do not have publicly traded equity. We therefore focus on the information provided in the financial statements by a focal firm and its peers as a measure of comparability. We discuss our measurement approach in detail in Section 4.2.
16 In contrast, Mafrolla and D’Amico (Citation2017), using a sample of Italian, Portuguese, and Spanish SMEs, document that earnings management activities increase firms’ access to debt, both at the time of lending and before the lending agreement is made. This association, however, was strengthened after the enactment of the Basel II regulation, indicating unintended economic consequence of the regulation.
17 A cross-country matching procedure is increasingly common in contemporary literature, as it allows to meaningfully approximate the counterfactual (see, e.g., Bernard et al., Citation2021).
18 As the individual financial statements of limited-liability legal entities are influenced by tax considerations, these statements are not directly comparable with the consolidated financial statements. Sweden is similar to Germany in this respect where two recent studies also focus only on consolidated financial statements (Bassemir, Citation2018; Bassemir & Novotny-Farkas, Citation2018). Bassemir and Novotny-Farkas (Citation2018) argue that (p. 766): ‘Our focus is on consolidated financial statements, because they have no legal implications for dividend distributions or taxes […]’A reference is made to Leuz and Wüstemann (Citation2004) who states (p. 462): ‘the group accounts are neither the basis of dividends nor tax payments […]’ As regards dividend distribution, it is true also in Sweden that the legal restrictions focus on the individual financial statements.
19 K3 adoption was mandatory for all privately held groups; however, groups below the size thresholds may choose to not prepare consolidated financial statements, thus avoiding preparing consolidated financial statements under K3. We exclude small privately held groups that prepare consolidated financial statements, since we cannot establish whether K3 adoption in these groups is mandatory or voluntary.
20 Note that this measure is distinct from the DQ score developed by Chen et al. (Citation2015). Their DQ score is based on the subaccount items adding up to the group accounts, which in turn add up to higher level accounts (referred to as parent accounts by Chen et al. (Citation2015)). We have constructed this measure for the Swedish private firms following the Chen et al. (Citation2015) procedure. Most of the group accounts have the DQ average of 0.98, with the only exceptions being Income Statement accounts, Depreciation, and Employee costs. The total average DQ score for these Swedish firms is 0.95, and it does not vary with time. Our interpretation of this outcome is that private firms present less detailed financial statements which, due to a relatively low amount of reporting items, typically yield a high observed DQ score. However, this score does not inform about the comparability of the financial statements, which is the focus of this part of our investigation.
21 The coefficient for POSTt is absorbed by year-fixed effects. The coefficient for K3f is absorbed by group-fixed effects.
22 Financial reporting-driven ROAft decreases are primarily related to stricter leasing capitalization rules. Such effects, however, are much less pronounced than accounting changes leading to ROAft increases.
23 Our findings that earnings smoothing has declined following the mandatory K3 adoption contrasts prior studies that have documented unchanged, or increasing, earnings smoothing activity following mandatory IFRS adoption among listed firms (see, e.g., Ahmed et al. (Citation2013); Christensen et al. (Citation2015)) and earnings quality improvements only among private groups with stronger high quality reporting incentives (Bassemir & Novotny-Farkas, Citation2018). This likely is because IFRS allows for higher level of discretionary reporting choices than K3 (and IFRS for SMEs on which K3 is based) and, in many cases, than the local standards that it replaces. On the other hand, K3 has reduced reporting discretion (see Section 2), reducing thus the role of managerial incentives in determining accounting quality.
24 The graphs for parallel trends and change timing reported in indicate that the Swedish groups have engaged relatively less in real earnings management in 2011 and 2012 than Norwegian groups, with this difference disappearing again in 2013. While real earnings management activities in 2013 may have occurred in anticipation of K3 adoption, we note that the parallel-trend assumptions are not strictly satisfied, limiting the causal inferences of this specification. However, the analysis of different types of groups reveals increases in real earnings management among groups with high intangible assets before the K3 adoption as well as firms switching to non-BIG4 auditors around the regulation change (see Section 6.2). These cross-sectional findings are largely aligned with insights from prior literature that real and accrual earnings management can serve as substitute earnings management strategies (Ipino & Parbonetti, Citation2017).
25 Prior studies provide evidence that IFRS adoption enhances listed firms’ financial statement comparability in the form of equity market outcomes, both within one jurisdiction (Brochet et al., Citation2013) and, at least to some extent, across countries (Cascino & Gassen, Citation2015; Wang, Citation2014; Yip & Young, Citation2012). Our results extend these insights by demonstrating the financial-statement-structure-comparability changes in a private-firm setting.
26 Prior studies also suggest that the cost-of-debt reduction may also result from changing banking relationships (Breuer et al., Citation2018) as well as due to banks relying more on tax information (Cassar et al., Citation2015). We cannot directly test whether banking relationships have changed for firms subject to mandatory K3 adoption, since such information is not available in the Swedish setting. However, we note that all Swedish private entities are required by law to prepare financial statements, and that the pre-K3 level of compliance was high and has not changed substantially following the introduction of K3. For this reason, while we acknowledge the possibility that the banking relationships may have changed post-K3 adoption, we do not expect such developments to be driving our results. As regards the use of tax filings in Sweden, the corporate (legal entity level) tax filing information may indeed be requested by the lenders. However, the Swedish reporting system has tight links between the legal-entity accounting and tax filings. Thus, increased focus on the tax filings is unlikely to yield any significant differences in debt-pricing decisions relative to decisions that are based on financial statement information.
27 In Sweden, the biggest provider of the credit score information is UC, who classifies firms into five risk categories based on their 12-month bankruptcy probability. In its reports, UC provides an evaluation of the developments of key financial figures and ratios (such as turnover, net income, equity, liquidity, and solidity) as well as non-financial information (such as audit opinion). The financial-ratio calculations are based directly on the financial statement data.
28 We have obtained some anecdotal evidence from our private conversations with lenders that they generally were not aware of the introduction of the K3 standard and/or were not aware of the financial reporting changes that the new standard introduced. As such, the primary channel through which the K3 could affect the cost of debt is the changes in the financial reporting properties to which the lenders react even if they are not aware that these changes occur due to changes in the reporting standard.
29 We only create this measure for the Swedish (treatment) groups, since we do not have a sufficiently detailed industry classification data for the Norwegian groups to construct a meaningful measure for the control sample. Under the industry classification that is available to us, all control groups are classified as having IFRS-reporting peers.
30 Alternatively, as new regulation may impose additional costs (Bernard et al., Citation2018; Minnis & Shroff, Citation2017), groups may switch to a non-BIG4 auditor as a cost-saving strategy. If that is the case and audit quality remains similar (Boone et al., Citation2010), then K3-adoption effects would not differ between those groups that change auditors and those that do not.
References
- Ahmed, A. S., Neel, M., & Wang, D. (2013). Does mandatory adoption of IFRS improve accounting quality? Preliminary evidence. Contemporary Accounting Research, 30(4), 1344–1372. https://doi.org/10.1111/j.1911-3846.2012.01193.x
- Albu, C. N., Albu, N., Pali-Pista, S. F., Gîrbină, M. M., Selimoglu, S. K., Kovács, D. M., & Strouhal, J. (2013). Implementation of IFRS for SMEs in emerging economies: Stakeholder perceptions in the Czech republic, Hungary, Romania and Turkey. Journal of International Financial Management & Accounting, 24(2), 140–175. https://doi.org/10.1111/jifm.12008
- Allee, K. D., & Yohn, T. L. (2009). The demand for financial statements in an unregulated environment: An examination of the production and Use of financial statements by privately held small businesses. The Accounting Review, 84(1), 1–25. https://doi.org/10.2308/accr.2009.84.1.1
- Andersson, H., & Hellman, N. (2019). Analysis of changing regulatory conditions, new accounting policies and the global financial crisis: The case of Swedish banks. In V. Krivogorsky (Ed.), Institutions and accounting practices after the financial crisis, international perspectives (pp. 154–179). Routledge.
- Armstrong, C. S., Guay, W. R., & Weber, J. P. (2010). The role of information and financial reporting in corporate governance and debt contracting. Journal of Accounting and Economics, 50(2–3), 179–234. https://doi.org/10.1016/j.jacceco.2010.10.001
- Badertscher, B., Shroff, N., & White, H. D. (2013). Externalities of public firm presence: Evidence from private firms’ investment decisions. Journal of Financial Economics, 109(3), 682–706. https://doi.org/10.1016/j.jfineco.2013.03.012
- Baik, B. K., Berfeld, N., & Verdi, R. S. (2021). Do public financial statements influence venture capital and private equity financing? (Unpublished manuscript). https://papers.ssrn.com/sol3/papers.cfm?abstract_id=3867958 SSRN Electronic Journal. doi:10.2139/ssrn.3867958
- Balsmeier, B., & Vanhaverbeke, S. (2018). International financial reporting standards and private firms’ access to bank loans. European Accounting Review, 27(1), 75–104. https://doi.org/10.1080/09638180.2016.1229207
- Bar-Yosef, S., D’Augusta, C., & Prencipe, A. (2019). Accounting research on private firms: State of the art and future directions. The International Journal of Accounting, 54(2), 1950007–75. https://doi.org/10.1142/S1094406019500070
- Barth, M. E., Landsman, W. R., & Lang, M. H. (2008). International accounting standards and accounting quality. Journal of Accounting Research, 46(3), 467–498. https://doi.org/10.1111/j.1475-679X.2008.00287.x
- Bassemir, M. (2018). Why do private firms adopt IFRS? Accounting and Business Research, 48(3), 237–263. . https://doi.org/10.1080/00014788.2017.1357459
- Bassemir, M., & Novotny-Farkas, Z. (2018). Ifrs adoption, reporting incentives, and financial reporting quality in private firms. Journal of Business Finance & Accounting, 45(7–8), 759–796. https://doi.org/10.1111/jbfa.12315
- Bernard, D. (2016). Is the risk of product market predation a cost of disclosure? Journal of Accounting and Economics, 62(2–3), 305–325. https://doi.org/10.1016/j.jacceco.2016.07.001
- Bernard, D., Burgstahler, D., & Kaya, D. (2018). Size management by European private firms to minimize proprietary costs of disclosure. Journal of Accounting and Economics, 66(1), 94–122. https://doi.org/10.1016/j.jacceco.2018.03.001
- Bernard, D., Kaya, D., & Wertz, J. (2021). Entry and capital structure mimicking in concentrated markets: The role of incumbents’ financial disclosures. Journal of Accounting and Economics, 71(2-3), 101379–19. https://doi.org/10.1016/j.jacceco.2020.101379
- Beuselinck, C., Elfers, F., Gassen, J., & Pierk, J. (2021). Accounting by private firms: empirical evidence, data, and research perspectives (Unpublished manuscript). https://papers.ssrn.com/sol3/papers.cfm?abstract_id=3496543 SSRN Electronic Journal. doi:10.2139/ssrn.3496543
- Bigus, J., & Hillebrand, C. (2017). Bank relationships and private firms’ financial reporting quality. European Accounting Review, 26(2), 379–409. https://doi.org/10.1080/09638180.2016.1152906
- Boone, J. P., Khurana, I. K., & Raman, K. K. (2010). Do the Big 4 and the second-tier firms provide audits of similar quality? Journal of Accounting and Public Policy, 29(4), 330–352. https://doi.org/10.1016/j.jaccpubpol.2010.06.007
- Brav, O. (2009). Access to capital, capital structure, and the funding of the firm. The Journal of Finance, 64(1), 263–308. https://doi.org/10.1111/j.1540-6261.2008.01434.x
- Breuer, M., Hombach, K., & Müller, M. A. (2018). How does financial reporting regulation affect firms’ banking? The Review of Financial Studies, 31(4), 1265–1297. https://doi.org/10.1093/rfs/hhx123
- Brochet, F., Jagolinzer, A. D., & Riedl, E. J. (2013). MandatoryIFRSadoption and financial statement comparability. Contemporary Accounting Research, 30(4), 1373–1400. https://doi.org/10.1111/1911-3846.12002
- Brüggemann, U., Hitz, J.-M., & Sellhorn, T. (2013). Intended and unintended consequences of mandatory IFRS adoption: A review of extant evidence and suggestions for future research. European Accounting Review, 22(1), 1–37. https://doi.org/10.1080/09638180.2012.718487
- Burgstahler, D. C., Hail, L., & Leuz, C. (2006). The importance of reporting incentives: Earnings management in European private and public firms. The Accounting Review, 81(5), 983–1016. https://doi.org/10.2308/accr.2006.81.5.983
- Cameran, M., Campa, D., & Pettinicchio, A. (2014). IFRS adoption Among private companies. Journal of Accounting, Auditing & Finance, 29(3), 278–305. https://doi.org/10.1177/0148558X14534260
- Capkun, V., Collins, D., & Jeanjean, T. (2016). The effect of IAS/IFRS adoption on earnings management (smoothing): a closer look at competing explanations. Journal of Accounting and Public Policy, 35(4), 352–394. https://doi.org/10.1016/j.jaccpubpol.2016.04.002
- Cascino, S., & Gassen, J. (2015). What drives the comparability effect of mandatory IFRS adoption? Review of Accounting Studies, 20(1), 242–282. https://doi.org/10.1007/s11142-014-9296-5
- Cassar, G., Ittner, C. D., & Cavalluzzo, K. S. (2015). Alternative information sources and information asymmetry reduction: Evidence from small business debt. Journal of Accounting and Economics, 59(2–3), 242–263. https://doi.org/10.1016/j.jacceco.2014.08.003
- Chaney, P. K., Jeter, D. C., & Shivakumar, L. (2004). Self-selection of auditors and audit pricing in private firms. The Accounting Review, 79(1), 51–72. https://doi.org/10.2308/accr.2004.79.1.51
- Chen, S., Miao, B., & Shevlin, T. (2015). A new measure of disclosure quality: The level of disaggregation of accounting data in annual reports. Journal of Accounting Research, 53(5), 1017–1054. https://doi.org/10.1111/1475-679X.12094
- Chi, W., Dhaliwal, D., Li, O. Z., & Lin, T.-H. (2013). Voluntary reporting incentives and reporting quality: Evidence from a reporting regime change for private firms in Taiwan. Contemporary Accounting Research, 30(4), 1462–1489. https://doi.org/10.1111/1911-3846.12003
- Christensen, H. B., Lee, E., Walker, M., & Zeng, C. (2015). Incentives or standards: What determines accounting quality changes around IFRS adoption? European Accounting Review, 24(1), 31–61. https://doi.org/10.1080/09638180.2015.1009144
- Cohen, D. A., Dey, A., & Lys, T. Z. (2008). Real and accrual-based earnings management in the pre- and post-sarbanes-oxley periods. The Accounting Review, 83(3), 757–787. https://doi.org/10.2308/accr.2008.83.3.757
- Daske, H., Hail, L., Leuz, C., & Verdi, R. (2013). Adopting a label: Heterogeneity in the economic consequences around IAS/IFRS adoptions. Journal of Accounting Research, 51(3), 495–547. https://doi.org/10.1111/1475-679X.12005
- De Franco, G., Kothari, S. P., & Verdi, R. S. (2011). The benefits of financial statement comparability. Journal of Accounting Research, 49(4), 895–931. https://doi.org/10.1111/j.1475-679X.2011.00415.x
- De George, E. T., Li, X., & Shivakumar, L. (2016). A review of the IFRS adoption literature. Review of Accounting Studies, 21(3), 898–1004. https://doi.org/10.1007/s11142-016-9363-1
- De Meyere, M., Vander Bauwhede, H., & Van Cauwenberge, P. (2018). The impact of financial reporting quality on debt maturity: The case of private firms. Accounting and Business Research, 48(7), 759–781. https://doi.org/10.1080/00014788.2018.1431103
- Ding, S., Liu, M., & Wu, Z. (2016). Financial reporting quality and external debt financing constraints: The case of privately held firms. Abacus, 52(3), 351–373. https://doi.org/10.1111/abac.12083
- Downes, J. F., Flagmeier, V., & Godsell, D. (2018). Product market effects of IFRS adoption. Journal of Accounting and Public Policy, 37(5), 376–401. https://doi.org/10.1016/j.jaccpubpol.2018.09.004
- EFRAG. (2010). Advice on the compatibility of the IFRS for SMEs and the EU accounting directives, Letter to the EU commission. https://www.efrag.org/Activities/172/Compatibility-Analysis-IFRS-for-SMEs-and-the-Council-Directives#
- Francis, J. R., Khurana, I. K., Martin, X., & Pereira, R. (2008). The role of firm-specific incentives and country factors in explaining voluntary IAS adoptions: Evidence from private firms. European Accounting Review, 17(2), 331–360. https://doi.org/10.1080/09638180701819899
- García-Teruel, P. J., Martínez-Solano, P., & Sánchez-Ballesta, J. P. (2014a). The role of accruals quality in the access to bank debt. Journal of Banking & Finance, 38, 186–193. https://doi.org/10.1016/j.jbankfin.2013.10.003
- García-Teruel, P. J., Martínez-Solano, P., & Sánchez-Ballesta, J. P. (2014b). Supplier financing and earnings quality. Journal of Business Finance & Accounting, 41(9–10), 1193–1211. https://doi.org/10.1111/jbfa.12090
- Gassen, J. (2017). The effect of IFRS for SMEs on the financial reporting environment of private firms: An exploratory interview study. Accounting and Business Research, 47(5), 540–563. https://doi.org/10.1080/00014788.2017.1314105
- Gassen, J., & Fülbier, R. U. (2015). Do creditors prefer smooth earnings? Evidence from European private firms. Journal of International Accounting Research, 14(2), 151–180. https://doi.org/10.2308/jiar-51130
- Goyal, V. K., Nova, A., & Zanetti, L. (2011). Capital market access and financing of private firms*. International Review of Finance, 11(2), 155–179. https://doi.org/10.1111/j.1468-2443.2011.01131.x
- Hellman, N. (2011). Analysis of changing institutional environments, new accounting policies and corporate governance practices in Sweden. In V. Krivogorsky (Ed.), Law, corporate governance, and accounting: European perspectives (pp. 210–229). Routledge.
- Hope, O.-K., & Vyas, D. (2017). Private company finance and financial reporting. Accounting and Business Research, 47(5), 506–537. https://doi.org/10.1080/00014788.2017.1303963
- Hussain, F. F., Chand, P. V., & Rani, P. (2012). The impact of IFRS for SMEs on the accounting profession: Evidence from Fiji. Accounting and Taxation, 4(2), 107–118.
- IFRS Foundation. (2022). Who uses IFRS standards? https://www.ifrs.org/use-around-the-world/use-of-ifrs-standards-by-jurisdiction/
- Ipino, E., & Parbonetti, A. (2017). Mandatory IFRS adoption: The trade-off between accrual-based and real earnings management. Accounting and Business Research, 47(1), 91–121. https://doi.org/10.1080/00014788.2016.1238293
- Jensen, M. C., & Meckling, W. H. (1976). Theory of the firm: Managerial behavior, agency costs and ownership structure. Journal of Financial Economics, 3(4), 305–360. https://doi.org/10.1016/0304-405X(76)90026-X
- Kaya, D., & Koch, M. (2015). Countries’ adoption of the international financial reporting standard for small and medium-sized entities (IFRS for SMEs) – early empirical evidence. Accounting and Business Research, 45(1), 93–120. https://doi.org/10.1080/00014788.2014.969188
- Khurana, I. K., Pereira, R., & Zhang, E. X. (2018). Is real earnings smoothing harmful? Evidence from firm-specific stock price crash risk. Contemporary Accounting Research, 35(1), 558–587. https://doi.org/10.1111/1911-3846.12353
- Kothari, S. P., Ramanna, K., & Skinner, D. J. (2010). Implications for GAAP from an analysis of positive research in accounting. Journal of Accounting and Economics, 50(2–3), 246–286. https://doi.org/10.1016/j.jacceco.2010.09.003
- Leftwich, R. (1983). Accounting information in private markets: Evidence from private lending agreements. Accounting Review, 58(1), 23–42.
- Leuz, C., & Wüstemann, J. (2004). The role of accounting in the German financial system. In J.-P. Krahnen, & R. H. Schmidt (Eds.), The German financial system (pp. 450–485). Oxford University Press.
- Leuz, C., & Wysocki, P. D. (2008). Economic consequences of financial reporting and disclosure regulation: a review and suggestions for future research (Unpublished manuscript). https://papers.ssrn.com/sol3/papers.cfm?abstract_id=1105398 SSRN Electronic Journal. doi:10.2139/ssrn.1105398
- Leuz, C., & Wysocki, P. D. (2016). The economics of disclosure and financial reporting regulation: Evidence and suggestions for future research. Journal of Accounting Research, 54(2), 525–622. https://doi.org/10.1111/1475-679X.12115
- Litjens, R., Bissessur, S., Langendijk, H., & Vergoossen, R. (2012). How Do preparers perceive costs and benefits of IFRS for SMEs? Empirical evidence from the Netherlands. Accounting in Europe, 9(2), 227–250. https://doi.org/10.1080/17449480.2012.720875
- Mafrolla, E., & D’Amico, E. (2017). Borrowing capacity and earnings management: An analysis of private loans in private firms. Journal of Accounting and Public Policy, 36(4), 284–301. https://doi.org/10.1016/j.jaccpubpol.2017.05.001
- Minnis, M. (2011). The value of financial statement verification in debt financing: Evidence from private U.S. Firms. Journal of Accounting Research, 49(2), 457–506. https://doi.org/10.1111/j.1475-679X.2011.00411.x
- Minnis, M., & Shroff, N. (2017). Why regulate private firm disclosure and auditing? Accounting and Business Research, 47(5), 473–502. https://doi.org/10.1080/00014788.2017.1303962
- Minnis, M., & Sutherland, A. (2017). Financial statements as monitoring mechanisms: Evidence from small commercial loans. Journal of Accounting Research, 55(1), 197–233. https://doi.org/10.1111/1475-679X.12127
- Neel, M. (2017). Accounting comparability and economic outcomes of mandatory IFRS adoption. Contemporary Accounting Research, 34(1), 658–690. https://doi.org/10.1111/1911-3846.12229
- Sigonius, T. (2019). Accounting standard-setting through adaptation: Models and contextual factors in the case of the Swedish standard K3 [Doctoral dissertation]. Stockholm School of Economics.
- Uyar, A., & Güngörmüş, A. H. (2013). Perceptions and knowledge of accounting professionals on IFRS for SMEs: Evidence from Turkey. Research in Accounting Regulation, 25(1), 77–87. https://doi.org/10.1016/j.racreg.2012.11.001
- Van Caneghem, T., & Van Campenhout, G. (2012). Quantity and quality of information and SME financial structure. Small Business Economics, 39(2), 341–358. https://doi.org/10.1007/s11187-010-9306-3
- Vander Bauwhede, H., De Meyere, M., & Van Cauwenberge, P. (2015). Financial reporting quality and the cost of debt of SMEs. Small Business Economics, 45(1), 149–164. https://doi.org/10.1007/s11187-015-9645-1
- Vural, D. (2017). Disclosing the books: Evidence on Swedish publicly listed firms’ accounting disclosure practices [Doctoral dissertation]. Uppsala University.
- Wang, C. (2014). Accounting standards harmonization and financial statement comparability: Evidence from transnational information transfer. Journal of Accounting Research, 52(4), 955–992. https://doi.org/10.1111/1475-679X.12055
- Watts, R. L., & Zimmerman, J. L. (1986). Positive accounting theory. Englewood Cliffs. Prentice Hall.
- Yip, R. W. Y., & Young, D. (2012). Does mandatory IFRS adoption improve information comparability? The Accounting Review, 87(5), 1767–1789. https://doi.org/10.2308/accr-50192
- Zuelch, H., & Burghardt, S. (2010). The granting of loans by German banks to SMEs against the background of international financial reporting. Journal of Applied Accounting Research, 11(1), 43–57. https://doi.org/10.1108/09675421011050027