
 ?Mathematical formulae have been encoded as MathML and are displayed in this HTML version using MathJax in order to improve their display. Uncheck the box to turn MathJax off. This feature requires Javascript. Click on a formula to zoom.
Abstract
We examine the relation between disaster risk and banks’ loan loss provisions (LLP). We propose a disaster risk measure based on the natural disasters declared as major disasters by the Federal Emergency Management Agency over a 15-year span. We theoretically support and empirically validate our measure using three different approaches, including the UN Sendai Framework for disaster risk reduction, which relates disaster risk to natural hazard exposure, vulnerability and capacity, and hazard characteristics. Using more than 445,000 bank-quarter observations, we document that banks located in U.S. counties with higher disaster risk recognize larger LLP after controlling for other bank-level factors related to LLP. We employ several techniques to ensure the robustness of our findings, including difference-in-differences estimation and matched samples. In additional analysis, we explore the characteristics that better enable banks to recognize disaster risk in their LLP, and investigate the consequences of managing disaster risk through LLP. Our results are important, especially because of the increasing concern about disaster risk and because they inform the growing debate on the economic consequences of disaster risk and the ability of the banking system to proactively manage the resulting credit risk through LLP.
1. Introduction
Natural disasters have a tremendous economic and social impact, inflicting severe damage to property and infrastructure, devastating local economies, and potentially harming national economic output (UNDRR, Citation2019; UNISDR, Citation2015). These events are difficult to predict and, as highlighted by Jerome Powell, Chairman of the Board of Governors of the U.S. Federal Reserve System, can be classified as shocks to the financial system (Powell, Citation2019). Therefore, the Federal Reserve Board emphasizes the impact of natural disasters on financial stability, focusing in particular on the ability of financial institutions to identify, measure, and monitor disaster risk. Prior literature concentrates mainly on ex-post consequences of natural disasters (e.g. Cortés & Strahan, Citation2017; Dessaint & Matray, Citation2017). We investigate whether banks proactively manage credit risk ex-ante by reflecting disaster risk in their balance sheets through recognizing higher loan loss provisions (LLP).
The United Nations (UN) Sendai Framework for disaster risk reduction defines disaster risk as the consequence of the interaction between a natural hazard and the characteristics that make places and people exposed and vulnerable (UNISDR, Citation2015).Footnote1 If a natural hazard manifests in an area of no exposure, then there is no risk. Additionally, an exposed area can be more or less prepared for the occurrence of natural hazards.
A natural hazard is a potentially destructive event (e.g. hurricane, tornado, flood, or drought) that may cause loss of life, injury, property damage, and social and economic disruption. Many areas are exposed to multiple hazards that vary in terms of geographical scale (e.g. tornadoes are normally localized, while drought areas can cover thousands of square miles). Exposure refers to the attributes and value of assets that are important to the communities located in hazard-prone areas. People and assets become concentrated in areas exposed to hazards through population growth, migration, and urbanization (UNISDR, Citation2015). Vulnerability refers to the likelihood that assets will be damaged when exposed to hazard events and is related to physical, economic, social, and environmental factors. Given the characteristics of its components, disaster risk varies over time and across geographical areas.
From the financial risk management perspective, two important additional characteristics distinguish disaster risk from other types of risk. First, disaster risk impacts all sectors and asset classes, albeit with different intensities. Second, insurance services and public assistance programs provide insufficient coverage against disaster risk (Botzen & Van Den Bergh, Citation2012; Dessaint & Matray, Citation2017; Noth & Schuwer, Citation2018; OECD, Citation2015). These characteristics imply that disaster risk cannot be avoided entirely but only mitigated (OECD, Citation2015; World Bank GFDRR, Citation2014). This is especially true for banks that are key actors in the financial system and provide significant amounts of capital to firms operating in multiple sectors. Disaster risk could be concentrated on banks’ lending portfolios and, if not properly managed, could create a systemic risk to financial stability (PriceWaterhouseCoopers, Citation2016).
Disaster risk faced by borrowers could be transferred to banks’ lending portfolios through the reduced ability of borrowers to repay loans due to disaster-related financial constraints. This translates into an increase in credit risk for banks, which could also lead to higher liquidity risk because of the reduction of cash inflows. Consequently, banks need to incorporate disaster risk into their risk management strategies to avoid creating a systemic risk to financial stability (e.g. OECD, Citation2015; Powell, Citation2019).
One approach for banks to manage disaster risk is the use of disaster risk financing tools, such as incorporating the risk in their lending decisions on a loan-by-loan basis. Since pricing disaster risk into corporate ratings and interest spreads can be challenging (Standard & Poor’s, Citation2015b), the ability to mitigate disaster risk solely through the use of disaster risk financing tools is unclear. On the one hand, a recent report from Standard & Poor’s (Citation2015a) shows that only 60 negative rating actions (comprising downgrades and outlook revisions) were taken after natural disasters. Standard & Poor’s (Citation2015a) explain that the small number of negative rating actions is due to sufficient insurance protection and post-event recovery measures for their sample firms. However, both academic research and non-academic reports stress that, in general, there is insufficient use of disaster risk financing tools and, especially, insurance protection (Botzen & Van Den Bergh, Citation2012; Dessaint & Matray, Citation2017; Noth & Schuwer, Citation2018; OECD, Citation2015). For example, a report from OECD (Citation2015) highlights that disaster risk is often uninsurable even with public support for disaster insurance. In the U.S., only some state governments have established insurance pools for specific types of hazards (e.g. storms). However, these pools are often limited to residential and commercial customers, have low insurance limits (e.g. around $1.5 million), and include numerous conditions to gain access.
We argue that one of the effective ways that banks can handle an increase in disaster risk is by enhanced credit risk management through LLP, i.e. recognizing higher LLP in the current period to build reserves for possible future write-offs. By utilizing more effective credit risk models and incorporating longer time horizons when assessing potential credit losses influenced by disaster risk, managers can increase current LLP to accelerate the recognition of potential future bad debts that otherwise must be recognized in subsequent periods. This is especially relevant for banks facing higher disaster risk that will increase their lending risk.
Although disaster risk is not easy to predict, its impact on economic outcomes (e.g. Boustan et al., Citation2017; Felbermayr & Groschl, Citation2014; Hsiang et al., Citation2017) and on lending decisions (Berg & Schrader, Citation2012; Cortés & Strahan, Citation2017; Delis et al., Citation2019; Hosono et al., Citation2016; Koetter et al., Citation2020; Nguyen & Wilson, Citation2020) has been established in prior literature. Therefore, understanding the extent to which banks incorporate and absorb forward-looking information on disaster risk in their balance sheets through LLP becomes critical.Footnote2
We predict that disaster risk positively relates to LLP primarily due to credit risk management reasons. Bank managers observe the components of disaster risk that impact their lending portfolios and estimate LLP that are adequate to build reserves to absorb potential future losses. This argument is consistent with the growing body of literature showing the impact of natural disasters on the broader economy and lending decisions. A positive relation between disaster risk and LLP is also consistent with the Federal Reserve’s concerns about the ability of financial institutions to identify, measure, monitor, and control this particular type of risk (Powell, Citation2019). However, there is considerable heterogeneity in disaster risk perception, and disaster risk estimation techniques are in their infancy. These aspects could bias the relation between disaster risk and LLP. Thus, whether disaster risk positively relates to LLP is ultimately an empirical question.
Measuring disaster risk presents numerous challenges, mainly concerned with whether the resulting measure effectively captures the constructs of hazard, exposure, and vulnerability (UNDRR, Citation2019; UNISDR, Citation2015). Additionally, disaster risk measures should reflect both the spatial and temporal attributes of its components. We measure disaster risk by assessing the variation in the number of natural disasters declared as major disaseters by the Federal Emergency Management Agency (FEMA) over a 15-year span for each U.S. county-quarter. The FEMA Disaster Declaration Process gives the authority to the President of the United States to provide federal assistance to the impacted areas. Thus, the FEMA dataset includes only relatively large natural disasters that materially affect local economies.
From a theoretical perspective, the use of past events indicates the extent of hazard, exposure, and vulnerability (OECD, Citation2012). The number of past events reflects the materialization of the hazard component of disaster risk. The FEMA Disaster Declaration Process ensures that our measure incorporates the exposure and vulnerability components of disaster risk because only natural disasters that are contained in the FEMA dataset qualify for federal assistance. This ensures that the natural hazard materialized in an area where assets and people are exposed and sufficiently vulnerable to receive governmental support.
We empirically validate our disaster risk measure using three alternative approaches. First, we ensure that our disaster risk measure captures all the relevant dimensions suggested in the UN Sendai Framework for disaster risk reduction (UNISDR, Citation2015). Second, we ascertain whether our measure also captures the components of risk identified in the German Watch framework (Eckstein et al., Citation2021). Third, we test whether our measure is correlated with the National Risk Index recently released by FEMA. Our measure is also sufficiently granular to incorporate the spatial and temporal attributes of disaster risk and ensure an appropriate identification strategy.
After assigning our county-quarter disaster risk measure to bank headquarters counties, we examine the relation between disaster risk and LLP for a sample of 445,924 bank-quarter observations (9766 unique banks) over the period 2002–2019. We use quarterly data from the Federal Deposit Insurance Corporation (FDIC) Statistics on Depository Institutions database.Footnote3 We restrict our sample to non-interstate banks to ensure that the majority of a bank’s loan portfolio is tied to clients whose operations are largely based in the same geographical area as the bank’s headquarters. We focus on commercial banks because they specialize in lending activities and have larger LLP.
We find that disaster risk positively relates to LLP. In particular, we document that a one standard deviation change in disaster risk is associated with a change in LLP ranging between +5.4% and +7.0%, which results in a reduction in earnings of 1.2% to 1.6%. Our findings hold when we use an alternative model and sample specifications. Our main results are robust to a battery of sensitivity tests. To strengthen identification and facilitate causal interpretation, we conduct an event study using Hurricane Katrina as a shock (Dessaint & Matray, Citation2017) that induced banks to reprice disaster risk in LLP for banks located in counties previously affected by hurricane events but not directly impacted by Hurricane Katrina. Since we omit banks in counties that were directly impacted by Hurricane Katrina, the increase in LLP can be attributed to the repricing of disaster risk rather than to the direct effects of losses arising from hurricane damage.
We provide three types of additional analyses. First, with the aim of proposing alternative and more granular measures of natural disaster risk, we construct three alternative measures of disaster risk that capture multicounty, frequent event, and rare event disaster risk. Using yearly data on bank branches from the Summary of Deposits database, we calculate a multicounty measure of disaster risk at the county-year level. As a starting point, we assign the corresponding disaster risk to each bank branch located in a county. We then compute a weighted average measure of disaster risk using the number of branches in each county as weights. We also decompose disaster risk into frequent event disaster risk and rare event disaster risk. We define frequent (rare) disaster events as events that occur with a frequency equal to or higher (lower) than the median frequency of the events in each county. We find that all three alternative measures of disaster risk are positively and significantly related to LLP.
Second, we investigate whether certain types of banks are better able to incorporate disaster risk in their LLP. We focus on bank size, complexity, and loan concentration because these characteristics can enable banks to better incorporate disaster risk in LLP. The ability to incorporate disaster risk primarily originates from resources available to large banks to invest in disaster risk management. Banks with a complex set of operations may find it more challenging to estimate and incorporate disaster risk into LLP. We find that banks with simple operations and large and concentrated banks are better able to proactively incorporate disaster risk in LLP.
Lastly, we explore the consequences of managing disaster risk through LLP and investigate the relation between current LLP and future loan charge-offs and the ability to take future risks. We reason that if disaster risk is appropriately incorporated in LLP, then current LLP should better anticipate future loan charge-offs when a disaster occurs. Conversely, when disasters do not occur banks have more room to bear future risks. We find that disaster risk positively moderates the relation between current LLP and future charge-offs (future risk) for banks experiencing (not experiencing) a disaster risk in the subsequent quarter.
We make several contributions to the literature. Prior literature shows mostly ex-post economic consequences of natural disasters (e.g. Choi et al., Citation2020; Cortés & Strahan, Citation2017; Dessaint & Matray, Citation2017). We contribute to this line of research by examining whether banks proactively manage credit risk by making adequate LLP to recognize disaster risk that impacts lending portfolios. We also introduce a new measure for disaster risk that can be a useful tool for quantifying this construct in the financial economics literature. Not only do we introduce this new disaster risk measure based on past natural disasters, but we also validate it using three alternative approaches. Additionally, our study informs the debate on the determinants of LLP (e.g. Hribar et al., Citation2017; Nicoletti, Citation2018). We contribute to this line of research by identifying disaster risk as an important environmental determinant of a bank’s largest accrual. Our study also has important implications for the debate related to the supervision of the risk associated with natural disasters in the financial system. Our findings suggest that banks generally incorporate disaster risk in their LLP and that these provisions are more related to future charge-offs.
The rest of this paper is organized as follows. We review the literature on natural disasters and their consequences on the broader economy and lending decisions in Section 2. We develop our hypothesis on the relation between disaster risk and LLP in Section 3, present the research design and sample selection in Section 4, report the main results in Section 5, and present the results of additional tests in Section 6. We discuss the results and conclude in Section 7.
2. Prior Literature
2.1. Prior Literature on Economic Consequences of Natural Disasters
Using international data, Felbermayr and Groschl (Citation2014) document that a massive disaster reduces GDP per capita by roughly 7%, while moderate and small events induce a drop in GDP per capita of 0.33% and 0.01%, respectively. Hsiang et al. (Citation2017) forecast similar consequences for economic damage from global warming in the U.S. For every 1 degree Celsius increase in the U.S. temperature, a loss of roughly 1.25% of GDP is expected annually. While some areas may benefit from such an increase in temperatures, others like Arizona and Texas will face GDP losses higher than 10%. The reduction in economic growth propagates the impact of natural disasters through a domino effect. For example, Boustan et al. (Citation2017) show that severe disasters increase local poverty rates, reduce home prices, and induce migration from one region to another.
Despite the negative economic outcomes of natural disasters, prior literature documents a significant heterogeneity in how they are perceived by the general population (Howe et al., Citation2015). This heterogeneity is reflected in economic transactions and in financial markets. For example, the impact of droughts on food stocks is not fully priced in the market. Food companies located in areas with a long-term trend of severe droughts are associated with relatively poor profit growth and stock returns. This result is consistent with the market underreacting to disaster risks (Hong et al., Citation2019). One reason is that climate believers and deniers behave differently when facing the risk of natural disasters. For example, when informed about the exposure of their homes to future inundation, believers tend to sell at a discount compared to deniers (Baldauf et al., Citation2020).
Contrary to the general population, institutional investors are aware that natural events have financial implications for their portfolios (Clark, Citation2019; Kruger et al., Citation2019). Because of temporarily reduced investor demand, yields of primary municipal bond issues increase after natural disasters. Municipalities react to the higher financing costs by issuing bonds with shorter maturities and less complex structures (Bennett & Wang, Citation2019).
2.2. Prior Literature on Natural Disasters and Lending Decisions
In addition to the negative impact on economic growth, natural disasters also create unpredictable credit shocks to the financial system (Cortés & Strahan, Citation2017; Powell, Citation2019). Consequently, the finance literature mainly focuses on examining changes in credit demand, access to credit, and credit supply following natural disasters.
Berg and Schrader (Citation2012) demonstrate an increase in credit demand and a restriction in access to credit after the Ecuadorian volcanic eruptions. Nguyen and Wilson (Citation2020) confirm that natural disasters resulting from the 2004 Indian Ocean Tsunami, had a negative effect on credit supply. Using data from Japan’s Great Hanshin-Awaji earthquake in 1995, Hosono et al. (Citation2016) find that firms that rely on financial institutions located in the earthquake area show significantly smaller capital investment than clients that rely on financial institutions located outside the earthquake area. This result is consistent with natural disasters inducing a shock to loan supply, which directly affects nonfinancial firms’ capital investments. Brei et al. (Citation2019) explain that the shock to loan supply is associated with banks facing deposit withdrawals and adverse funding shocks.
Cortés and Strahan (Citation2017) find that after natural disasters, multimarket banks reallocate capital because of credit demand increases in affected areas. To reduce the impact of the demand shock on credit supply, banks also increase sales of more liquid loans and increase the interest rate on deposits. Similarly, Koetter et al. (Citation2020) find that banks located in counties unaffected by natural disasters increase lending to firms inside affected counties by 3%. Among banks located in affected areas, fewer multimarket banks exhibit more credit risk and less equity capital. Schuwer et al. (Citation2019) document that these effects are driven by independent banks based in the disaster areas. Thus, economic growth is higher for impacted areas with more independent banks than for areas with fewer independent banks.
However, natural disasters also represent a threat to the existence of a bank. Klomp (Citation2014) suggests that geophysical and meteorological disasters increase financial fragility and reduce distance-to-default. The impact of a natural disaster depends on its intensity, the strength of the financial regulation and supervision, and the level of financial and economic development. Noth and Schuwer (Citation2018) find similar consequences, showing that natural disasters significantly weaken bank stability. This is supported by an increase in nonperforming asset ratios, foreclosure ratios, and the probability of default, along with a decrease in return on assets, bank equity ratios, and z-scores.
3. Hypothesis
Disaster risk materializes in numerous negative consequences for the economic system and for bank customers. Beyond damages to assets and infrastructure, natural disasters could lead to secondary effects such as economic migration, disruption in the supply chain, and temporary scarcity of resources. Disaster risk impacts corporate customers through unexpected business interruptions, unbudgeted reconstruction costs, and asset impairments. Additionally, noncorporate customers, such as households, are exposed to disaster risk to the extent that their houses are not insured against natural disasters.
According to the Chairman of the Board of Governors of the Federal Reserve System, financial institutions should identify, measure, monitor, and control disaster risk (Powell, Citation2019). A potential method for controlling disaster risk is diversification. Because disaster risk will affect all sectors and asset classes, it cannot be avoided or fully diversified, but can be managed (Ernst and Young, Citation2016). This is especially true for banks, because they are exposed to disaster risk in multiple sectors through their customers. Banks can deal with disaster risk on a loan-by-loan basis through disaster risk financing tools (OECD, Citation2012) or by being more careful in their lending decisions. Even if banks implement mitigating mechanisms for dealing with disaster risk, they will still need to adjust and monitor disaster risk at the loan portfolio level because disaster risk varies over time and across different geographical areas.
We argue that an effective way for banks to deal with an increase in disaster risk is by strengthening credit risk management through LLP. Banks can accomplish this by employing more effective credit risk models and incorporating longer time horizons, and can increase current LLP to build reserves for possible future write-offs by accelerating the recognition of potential future bad debts that otherwise would be recognized in subsequent periods. This is especially true for banks facing higher disaster risk that will increase their lending risks.Footnote4
U.S. accounting standards for LLP during our sample period are based on the incurred loss model.Footnote5 This model allows a loss to be accruable only if the loss is probable and can be reasonably estimated. Banks can incorporate disaster risk in LLP in four different ways. First, banks normally refer to historical loss rates and prior loss experiences to support their estimates of LLP (Dugan, Citation2009; Gomaa et al., Citation2019). They can also take advantage of innovative lookback analysis developed to identify corporate updates in which particular words relating to disaster risk factors have been used (Standard & Poor’s, Citation2017).
Second, disaster risk consequences are observable in borrowers’ operations. According to Standard & Poor’s (Citation2015b), when disaster risk manifests in natural disasters, losses can be related to direct property and production losses, supply chain disruption, and market impact. The direct impact is of particular concern for geographically concentrated companies as it refers to a firm’s disruptions in its operations. The increasing integration of the economy makes supply chain disruption a key factor for estimating the impact of disaster risk for geographically dispersed firms. Market conditions can also deteriorate due to natural disasters. An increase in demand or a reduction in supply can induce raw material price movements and volatility. These consequences of disaster risk impose costs on borrowers, which directly affect earnings and cash flows. Prior literature on nonfinancial firms documents that disaster risk is associated with lower and more volatile earnings and cash flows, lower investment-to-assets ratios, and lower book-to-market ratios (Huang et al., Citation2018; Hugon & Law, Citation2019; Lanfear et al., Citation2019).
Third, banks can examine rapidly expanding data on all components of disaster risk. These data are publicly available and rapidly growing in terms of coverage and accuracy (World Bank GFDRR, Citation2014). For example, data on natural disasters and related governmental assistance programs have been available since the early 1950s from FEMA.
Fourth, the incurred loss model allows for some managerial judgment and the use of forward-looking factors (e.g. Dugan, Citation2009; Kanagaretnam et al., Citation2014). Bank managers could include their assessment of disaster risk in addition to provisions for normally expected losses in their LLP.
Given these arguments, we state the following hypothesis:
H1: Disaster risk positively relates to loan loss provisions.
We note that a positive association between disaster risk and LLP is not obvious. First, banks can diversify their loan portfolios and geographic exposures, thereby mitigating the effects of disaster risk and the need for higher LLP. Second, disaster risk perception is heterogeneous and estimation techniques are in their infancy. Therefore, bank managers may be unable to reliably estimate LLP associated with this type of risk. Third, borrowers operating in areas associated with high disaster risk tend to hold more cash to build organizational resilience (Huang et al., Citation2018). This could allow borrowers to repay their loans when disaster risk manifests in natural disasters. The above reasoning suggests that the relation between disaster risk and LLP is unclear and justifies the empirical analysis.
4. Data and Research Design
4.1. Sample
We obtain data on natural disasters from FEMA to compute disaster risk,Footnote6 accounting data from the Federal Deposit Insurance Corporation’s (FDIC) Statistics on Depository Institutions database,Footnote7 and data on branch locations from the FDIC’s Summary of Deposits databaseFootnote8 (see Appendix A for details of data sources and descriptions of the variables). The Statistics on Depository Institutions database contains information on commercial banks and bank holding companies. Data are collected by the FDIC every quarter, since all banks regulated by the Federal Reserve System, FDIC, and Comptroller of the Currency are required to file reports that include a balance sheet, income statement, risk-based capital measures, and off-balance-sheet data.
We begin our sample selection with all non-interstate commercial banks operating in the U.S. that have data available in the Statistics on Depository Institutions database from 2002 to 2019. To reduce sample heterogeneity, we focus on commercial banks because they specialize in lending activities and, consequently, larger amounts of LLP. We restrict the sample to non-interstate banks (i.e. banks with headquarters and offices in a single U.S. state) to ensure that the majority of a bank’s loan portfolio is tied to clients with operations largely based in the same geographical area as the bank’s headquarters.Footnote9 We use quarterly data filed on the Federal Financial Institutions Examination Council (FFIEC) 041 Call Report Form. Our sample starts in 2002 because the FFIEC-41 became effective during the second quarter of 2001, and we require data to calculate the change in nonperforming assets at quarter t-2. Our sample ends in 2019 in order to avoid the potential impact of the COVID19 pandemic on financial institutions and banks.
Following prior research, we define a bank’s location as the location of its headquarters (e.g. Hilary & Hui, Citation2009). We use the county code (Statistics on Depository Institutions code BKMO) data to locate the headquarters of each bank. Although mainly concentrated close to the headquarters, bank operations may transcend county borders. In addition to restricting our sample to non-interstate banks, we also account for bank operations transcending county borders by controlling for branch diversification in our empirical model.
Lastly, we match accounting data from the Statistics on Depository Institutions database, branch locations from the Summary of Deposits database, and our measure of disaster risk using Federal Information Processing Standard (FIPS) county codes.
Our final sample contains 445,924 bank-quarter observations, covering 9766 unique banks over the period from the first quarter of 2002 to the fourth quarter of 2019. We report the sample distribution by state and year in Online Appendix Table OA1.
4.2. Measure of Disaster Risk
According to the UN Sendai Framework for disaster risk reduction (UNDRR, Citation2019; UNISDR, Citation2015), disaster risk has both spatial and temporal attributes. First, disaster risk is dynamic as it can increase or decrease over time according to the ability to reduce the vulnerability component. Second, disaster risk occurs at different geographical levels. Although two contiguous areas may be affected by the same hazards (e.g. a hurricane), the pattern of disaster risk reflects exposure and vulnerability in different counties.
Although identifying, assessing, and understanding disaster risk is challenging (UNDRR, Citation2019; UNISDR, Citation2015), the analysis of past data on natural disasters serves as a common starting point (OECD, Citation2012). Past data are easier to interpret than future data because the latter would require estimating the probability of occurrence of a natural disaster at the county level. Although natural disasters partly depend on climatic conditions that are predictable on a seasonal time scale, the exact time and location of such future events are largely determined by weather patterns and other factors, which are only predictable a few days prior to the materialization of the hazard into a natural event (Dessaint & Matray, Citation2017). Additionally, estimating future natural disasters requires considering that each type of disaster has its own determinants (see Elsner & Jagger, Citation2006 about hurricane strikes and Arya, Citation2000, about earthquake risk prediction). Lastly, estimating future data would provide limited benefits in our case, as prior climatology literature establishes that the distribution of natural disasters tends to be stationary (e.g. Landsea, Citation2005; Landsea et al., Citation2006; Pielke et al., Citation2005; on the stationarity at the country and regional levels of hurricane strikes in the U.S.).
We derive our measure of disaster risk (DRt) from the number of natural events declared as major disasters by FEMA over a 15-year span for each county and quarter. We do not generate our disaster risk measure using all prior years of recorded disasters for which data are available because of a potential salience bias. Since the FEMA dataset starts in the 1950s, using all the recorded disasters could lead to a potential bias in our disaster risk measure. Selecting a 15-year window for measuring disaster risk allows us to select only salient disasters.
The FEMA Disaster Declaration Process is regulated by the Robert T. Stafford Disaster Relief and Emergency Assistance Act, 42 U.S.C. §§ 5121–5207. In order to assist in the recovery of the impacted area, the governor of the affected state has to formally request a disaster declaration by the U.S. president. Under the Stafford Act, disaster declarations are classified into emergency declarations and major disaster declarations. Given the peculiarity of major disasters involving fire management, an internal FEMA regulation has also established a Fire Management Assistance Grant declaration. All three types of declarations empower the president to provide federal disaster assistance. Thus, the FEMA dataset includes only relatively large disasters that materially affect local economies.
From a theoretical perspective, the use of past events contained in the FEMA dataset indicates a level of hazard, exposure, and vulnerability (OECD, Citation2012). A measure based on past events captures the materialization of the hazard component of disaster risk. Additionally, the FEMA Disaster Declaration Process serves as a logical link between DRt and the exposure and vulnerability components of disaster risk. Since they qualify for federal assistance, events contained in the FEMA dataset refer to natural hazards that occur in an area where assets and people are exposed and sufficiently vulnerable to receive governmental support.
For each disaster, the FEMA Disaster Declarations Summary provides information regarding the incident type, beginning date, ending date, and impacted area (identified by state, and county FIPS code). Additionally, for each disaster, FEMA reports the declaration date, closeout date, and the type(s) of assistance program declared.
In Online Appendix Table OA2, we report the distribution of disaster types contained in the FEMA dataset from the first quarter of 1987 to the fourth quarter of 2019. We include disasters from 1987 to 2001 because they are used to compute the disaster risk measure of the first quarter of 2002. For the period from 1987 to 2019, the FEMA dataset contains 1689 major disaster declarations. Severe Storm(s) is the most common type of disaster (887), followed by Flood (303), and Hurricane (172). A single event, on average, simultaneously affected 17 different counties. Hurricane and Severe Ice Storm are the types of disaster that, on average, affected the highest number of counties (25), followed by Snow (24), and Fire (20).
We note that the FEMA Disaster Declarations Summary contains disaster declarations for events not relevant to our study. For example, over the period from 1987 to 2019, the FEMA dataset contains disasters related to Human Cause, Terrorist attacks, and Fishing Losses. Additionally, some events are classified as ‘Other,’ making it difficult to attribute these events to natural disasters. We exclude all these events in computing DRt.
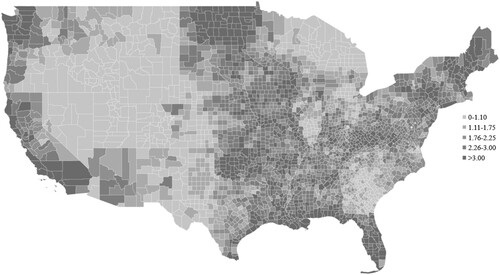
Figure shows the average disaster risk at the county level from 2002 to 2019. Walsh County (ND) has the highest disaster risk with an average of 6.13 natural disasters declared by FEMA over a 15-year span, followed by San Bernardino County (CA) (5.97), Riverside County (CA) (5.97), Los Angeles County (CA) (5.86), and Pike County (KY) (5.81).
Figure 1. Disaster risk (DR) across counties in continental USA.
Note: Figure presents a map chart of average disaster risk (DR) across counties in continental USA.
To explore the characteristics of our disaster risk measure, in Section 6 we also compute three additional measures. DR_MULTICOUNTYt incorporates the ability of banks to mitigate disaster risk across branches outside the headquarters county. DR_FREQUENTt (DR_RAREt) is the component of disaster risk originating from frequent (rare) events defined as events that occurred with a frequency higher (lower) than the median of the frequency of the events in each county.
4.3. Validation of Disaster Risk Measure
We validate DRt using three alternative approaches. First, we ensure that our disaster risk measure captures all the relevant dimensions suggested in the UN Sendai Framework for disaster risk reduction (UNISDR, Citation2015). Second, we check whether DRt also captures the components of risk identified in the German Watch framework (Eckstein et al., Citation2021). Third, we test whether our disaster risk measure is correlated with the risk metrics in the FEMA National Risk Index. We report the validation of DRt using the UN Sendai Framework for disaster risk reduction in this section and include the tests based on the German Watch framework and the FEMA National Risk Index in Online Appendix OA1.
Based on the UN Sendai Framework for disaster risk reduction, disaster risk can be expressed as follows:
(1a)
(1a)
Hazard is the probability of experiencing a particular event (e.g. hurricane, flood) at a specific location. Exposure captures the situation of people and infrastructures located in hazard-prone areas. Vulnerability is determined by social and environmental factors that increase susceptibility to the impact of hazards.
We employ the following model to validate our disaster risk measure using the UN Sendai Framework for disaster risk reduction:
(1b)
(1b)
All variables are defined in Appendix A and Online Appendix OA2, and are measured at the county-level. We estimate Equation (1b) at the county-quarter level, including all counties and quarters with available data from 2002 to 2019. The final sample for which disaster risk and disaster risk determinants are available consists of 218,952 county-quarter observations.
In Equation (1b), we measure the hazard component of disaster risk using the natural hazard index (NHIt) designed by the National Center for Disaster Preparedness (NCDP) at Columbia University. NHIt is a multiple-hazard index that captures historical and projected data for numerous natural hazards at the county level. We proxy the exposure component of disaster risk with population density (POPt) and total employment (EMPL%t). Although exposure to natural disasters is a complex construct, the use of population and labor data is widespread (UNDRR, Citation2019). Lastly, we measure the vulnerability component using the social vulnerability index (SoVIt) developed by the Hazard & Vulnerability Research Institute (HVRI) at University of South Carolina. Synthesizing more than 25 socioeconomic variables, SoVIt specifically measures the social vulnerability of U.S. counties to environmental hazards. Since vulnerability also relates to damage and losses (World Bank GFDRR, Citation2014), we also include property losses per capita (PTY_DAMAGEt) from the Spatial Hazard Events and Losses Database (SHELDUS) measured at the county-quarter level.
Based on the UN Sendai Framework for disaster risk reduction, we expect all control variables to positively correlate with DRt. To absorb potential time and geographical trends in disaster risk, we step-by-step include year-quarter and state fixed effects.
Panel A of Table reports summary statistics for disaster risk and disaster risk determinants. The table shows that the average county is associated with a disaster risk of 4.65, indicating that on average FEMA declared 4.65 major disasters in each county-quarter over a 15-year span. The standard deviation of DRt is 2.84, which indicates substantial variation in our measure.Footnote10
Table 1. Validation of disaster risk measure through the UN Sendai framework for disaster risk reduction.
Panel B of Table presents the estimation results of Equation (1b). We find that all the variables are significantly positively associated with disaster risk. These results validate our measure of disaster risk, as they indicate that it captures the components of hazard, exposure, and vulnerability. Additionally, our measure varies systematically by county-quarter, indicating that it captures the spatial and temporal attributes of disaster risk (UNDRR, Citation2019; UNISDR, Citation2015).
Online Appendix OA1 reports the results of validating our disaster risk measure using the German Watch framework and the FEMA National Risk Index. The analysis shows that DRt captures all the relevant components of disaster risk in both frameworks. Through these validations, we confirm that our measure based on the number of major disasters declared by FEMA over a 15-year span serves as a good proxy for disaster risk.
4.4. Empirical Model
We employ the following model, commonly used in the banking literature (e.g. Hribar et al., Citation2017; Kanagaretnam et al., Citation2014; Nicoletti, Citation2018), to test the association between disaster risk and LLP:
(2)
(2)
All variables are defined in Appendix A. To facilitate interpretation of the regression coefficients, we multiply LLPt by 100. Except for DRt, TIER1t-1, SIZEt-1, and BRANCHDIVt, all variables are scaled by beginning-of-quarter total loans and leases.
Our main variable of interest is DRt. We expect that disaster risk relates positively to LLP. Therefore, we expect the coefficient β1 to be greater than zero. We calculate our measure of disaster risk using data on natural disasters at the county-quarter level to allow sufficient variation in our main variable of interest. This feature is critical as it allows us to measure the association between disaster risk and LLP, while including numerous fixed effects to control for heterogeneity in LLP. Thus, our measure is sufficiently granular to ensure an appropriate identification strategy.
In Equation (2), we control for the quality and size of the underlying loan portfolio, incentives to smooth earnings and manage regulatory capital, and other bank-level factors related to LLP. We include leading and current changes in nonperforming assets (ΔNPAt+1, ΔNPAt) to reflect current and forward-looking information on nonperforming loans (Beatty & Liao, Citation2014). Similarly, we include lagged changes (one quarter and two quarters) in nonperforming assets (ΔNPAt-1, ΔNPAt-2) to control for changes in loan portfolio performance in the estimation of LLP (Tomy, Citation2019). We include the change in loans (ΔLOANSt) to control for the change in the size of the loan portfolio (Nicoletti, Citation2018). We include earnings before taxes and LLP (EBTLLPt) and Tier 1 risk-based capital ratio (TIER1t-1) to control for potential incentives to manage earnings (Beatty & Liao, Citation2014; Kanagaretnam et al., Citation2010) and lagged loan loss allowance (ALLOWANCEt-1) to account for accumulated allowance (Kanagaretnam et al., Citation2010). As LLP, loan loss allowance, and charge-offs are closely related, we follow prior research and include the past four quarters’ rolling average of net charge-offs (COt-1) (Beatty et al., Citation1995; Collins et al., Citation1995). We control for bank size (SIZEt-1) because larger banks are better able to mitigate risk, which may affect their LLP. Additionally, larger banks are potentially subject to differences in regulatory scrutiny. We control for branch diversification at the year level by including the proportion of bank branches outside the county where the bank is headquartered (BRANCHDIVt). Lastly, to account for diversification in the loan portfolio (LoanTypest), we include the ratio of residential, commercial, consumer, and agricultural loans to total loans at the end of each quarter (Costello et al., Citation2019; Liu & Ryan, Citation2006).
We include year-quarter fixed effects in Equation (2) to eliminate common shocks, such as general macroeconomic trends, to LLP. To account for trends in LLP timeliness, we use an alternative specification that augments the regression model by including year-quarter fixed effects interacted with ΔNPAt. Local time-invariant factors are likely to affect LLP of banks located in similar geographic regions. To account for this variation, we estimate Equation (2) by including state-county fixed effects. We also employ a more rigorous specification that includes bank fixed effects, thus controlling for time-invariant bank-level characteristics. By introducing these sets of progressively more detailed fixed effects, we remove differences in the aggregate level of LLP and focus on within state-county or bank-level differences. We winsorize all continuous variables at the 1st and 99th percentiles to mitigate the influence of extreme values and estimate standard errors clustered by bank because of the nature of LLP.
5. Empirical Results
5.1. Main Analysis
Table presents the descriptive statistics for the dependent and independent variables over the sample period. The table shows that the mean disaster risk is 4.97, indicating that on average FEMA declared 4.97 natural disasters in each county-quarter over a 15-year span. The standard deviation of DR is 2.85, which indicates substantial variation in our main independent variable. Like other studies (e.g. Kanagaretnam et al., Citation2010; Nicoletti, Citation2018), we find that LLP are on average 0.1% of lagged total loans (LLPt).
Table 2. Descriptive statistics.
Online Appendix Table OA5 presents Pearson correlation coefficients between the variables used in our analysis. Univariate correlation reveals that disaster risk negatively relates to LLP (−0.001, p > 0.10). As shown by the positive and significant coefficients on ΔNPA, LLP reflect past, current, and forward-looking information on loan quality.
Table presents the estimation results for the three different specifications of Equation (2). Column (1) reports the baseline OLS model, which includes the independent variable of interest, bank-specific control variables, and state-county and year-quarter fixed effects. Column (2) augments the model with year-quarter fixed effects interacted with ΔNPAt to account for trends in LLP timeliness, and column (3) includes bank and year-quarter fixed effects.
Table 3. Relation between disaster risk and loan loss provisions.
We find that disaster risk positively and significantly relates to LLP in all three specifications (coefficients of DR vary from 0.0027 in columns (1) and (2) to 0.0021 in column (3), with p < 0.01) even after controlling for previously identified determinants of LLP. These results are also economically significant. A one standard deviation change in disaster risk is associated with an increase in LLP ranging from 5.43% (=0.0021 × 2.8456 / 0.0011, the coefficient in column (3) multiplied by the standard deviation of DR and divided by the mean of LLP) to 6.98% (=0.0027 × 2.8456 / 0.0011, coefficient in columns (1) and (2) multiplied by the standard deviation of DR and divided by the mean of LLP). The increase in LLP induces a reduction in earnings ranging between −1.22% (=−0.0011 × 5.43% / 0.0049, mean of LLP multiplied by the increase in LLP and divided by the mean of earnings before taxes and LLP) and −1.57% (=−0.0011 × 6.98% / 0.0049, mean of LLP multiplied by the increase in LLP and divided by the mean of earnings before taxes and LLP). The coefficients of the bank-level control variables are similar to those reported in prior literature both in terms of magnitude and sign. The positive association between LLPt and ΔNPA shows that for every dollar change in nonperforming assets, the bank records 3–5 cents of LLP (i.e. we multiply LLPt by 100 to facilitate interpretation of regression coefficients).
These results indicate that disaster risk is strongly positively associated to LLP. Based on these findings, which support H1, we conclude that bank managers incorporate disaster risk considerations in their LLP.
To further address sample heterogeneity arising from a bank’s ability to incorporate disaster risk in LLP, in online Appendix OA3 we examine whether the positive relation between disaster risk and LLP is robust to using matched samples based on coarsened exact matching and entropy matching. Using these techniques, we confirm a positive and significant relation between disaster risk and LLP.
5.2. Difference-in-differences Estimation
Our main regression exploits the time-series and cross-county variations in disaster risk, which are largely exogenous to firm decisions. Moreover, we use bank fixed effects to control for potential unobservable omitted variables. Nonetheless, to strengthen identification and facilitate causal interpretation, we conduct an event study using Hurricane Katrina as a shock that induced banks to reprice disaster risk in their LLP (Dessaint & Matray, Citation2017). The use of hurricanes is supported by prior literature because of the substantial damages they inflict, the likelihood of no insurance or under-insurance coverage, and the variety of indirect losses that may occur (Dessaint & Matray, Citation2017). During the third quarter of 2005, Hurricane Katrina generated the heaviest disaster losses in the United States, including around 170 billion dollars of estimated costs and 1833 deaths (NOAA, Citation2015).
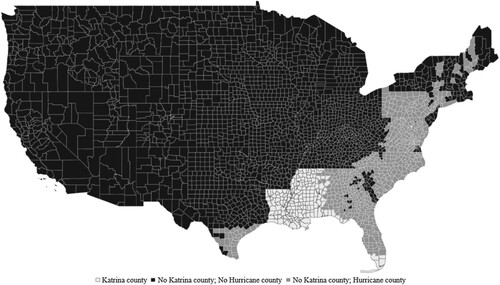
Figure shows a map of counties affected by Hurricane Katrina. Counties colored light gray were directly affected by Hurricane Katrina. We exclude banks headquartered in these counties because of the direct effects of Hurricane Katrina on their operations. In Figure , counties colored dark gray were not affected by Hurricane Katrina. However, these counties experienced at least one hurricane event in the FEMA dataset during the 10 years prior to Hurricane Katrina. Although not directly affected by Hurricane Katrina, disaster risk becomes more salient for banks located in these areas as they were recently subject to hurricane hazard. Thus, we classify these bank-quarter observations in the treated group. Lastly, in Figure , counties colored black were not affected by Hurricane Katrina and never registered hurricane events in the FEMA dataset during the 10 years prior to Hurricane Katrina. We assign banks located in these areas to the control group.
Figure 2 Counties affected by hurricanes and hurricane Katrina during the third quarter of 2005.
Note: Figure presents a map chart of counties affected by hurricane Katrina (colored in light gray, 179 counties, 21,655 bank-quarter observations), counties not affected by hurricane Katrina without hurricane events in the FEMA dataset during the 10 years prior to Hurricane Katrina (colored in black, 2367 counties, 355,414 bank-quarter observations), and counties not affected by hurricane Katrina with at least 1 hurricane event in the FEMA dataset during the 10 years prior to Hurricane Katrina (colored in dark gray, 689 counties, 68,855 bank-quarter observations).
Untabulated descriptive statistics show that during the third quarter of 2005, 179 counties (21,655 bank-quarter observations) were affected by Hurricane Katrina, 689 counties (68,855 bank-quarter observations) were not affected by Hurricane Katrina and registered at least one hurricane event in the FEMA dataset during the 10 years prior to Hurricane Katrina (treated group), and 2367 counties (355,414 bank-quarter observations) were not affected by Hurricane Katrina and never registered a hurricane event in the FEMA dataset during the 10 years prior to Hurricane Katrina (control group).
Although they are not prone to disaster risk from hurricane hazard, banks assigned to the control group are subject to other types of natural hazards. This implies that for both groups DRt varies over time and across different geographical areas.
We employ the following model to test whether Hurricane Katrina induced banks located in hurricane areas to reprice disaster risk in their LLP:
(3)
(3)
All variables are defined in Appendix A. The variable HURRICANEt indicates whether a bank is headquartered in a county that is prone to hurricane hazard. HURRICANE1t equals 1 if a bank registered at least one hurricane event during the 10 years prior to Hurricane Katrina, and 0 otherwise. Similarly, HURRICANE2t equals 1 if a bank registered frequent hurricane events during the 10 years prior to Hurricane Katrina (i.e. top quartile of the distribution), and 0 otherwise. POSTt is an indicator variable that equals 1 if the time period is the third quarter of 2005 or later, and 0 otherwise. To test whether Hurricane Katrina induced banks located in hurricane areas to reprice disaster risk in their LLP, we examine the coefficient β7 of the interaction term DRt x POSTt x HURRICANEt. If Hurricane Katrina induced banks to reprice disaster risk in their LLP, the coefficient β7 in Equation (3) should be positive.
Table presents the estimation results of the difference-in-differences analysis in Equation (3). In Column (1) we use HURRICANE1t to attribute bank-quarter observations to the treated and control groups, and in Column (2) we distinguish bank-quarter observations between the treated and control group based on HURRICANE2t. We find that Hurricane Katrina induced banks located in counties previously affected by hurricane events to reprice disaster risk in their LLP (coefficients β7 in columns (1) and (2) are 0.0033 and 0.0180, respectively, with p < 0.01).Footnote11 Together, these results facilitate a causal interpretation of the relation between disaster risk and LLP.
Table 4. Relation between disaster risk and loan loss provisions: difference-in-differences approach.
5.3. Sensitivity AnalysesFootnote12
We check the robustness of our main findings by performing a battery of sensitivity analyses. First, we provide a subsample analysis to further address sample heterogeneity arising from a bank’s ability to incorporate disaster risk in its LLP. We replicate our main analysis (1) excluding bank-quarter observations from the financial crisis period, (2) excluding observations of banks headquartered in counties with high disaster risk (i.e. more than 20 disasters overall), (3) including only observations without M&A activity, defined as a change in total assets between −10% and +10%, and (4) including only single-county banks with no branches outside the headquarters county. We repeat our analysis on a subsample that excludes the financial crisis period because of the unusually large LLP during this period and the consequent reduced ability to incorporate disaster risk. We exclude observations for banks headquartered in counties with high disaster risk to ensure that extreme levels of DRt are not driving our results. We exclude banks with M&A activity because these banks face higher regulatory scrutiny and may also be more able to mitigate disaster risk. We also replicate our analysis on a subsample of single-county banks because these banks are inherently unable to mitigate disaster risk through branch networks across different counties and states. Untabulated results confirm the positive relation between disaster risk and LLP.
Second, to mitigate the concern that our disaster risk measure reflects the effects of a recent disaster rather than managers explicitly taking disaster risk into account, we exclude disasters that occurred in the five years prior to year of the sample observation and repeat our main analysis using a measure of DRt calculated using the disasters from years t-6 to t-15. Untabulated results show that the coefficient of disaster risk is similar in magnitude to that of our main analysis and is significant.
Third, when estimating Equation (2) in our main analysis, we follow prior literature and cluster standard errors at the bank level because of the nature of LLP (Nicoletti, Citation2018). However, our main variable of interest is a county-quarter measure of disaster risk. We find consistent results when we cluster standard errors at the county-quarter level.
Fourth, despite including multiple levels of fixed effects, we estimate Equation (2) in our main analysis without excluding singleton groups (i.e. groups with only one observation). Prior literature demonstrates that including these observations in linear regressions with multiple levels of fixed effects can inflate statistical significance and lead to incorrect inferences. We repeat our analysis after dropping singleton observations and obtain consistent results.
Fifth, we include numerous fixed effects in Equation (2) in the main analysis to control for local time-invariant effects on the coefficient estimates. We check the robustness of our results based on the inclusion of additional year-variant county characteristics related to the economic environment by augmenting Equation (2) with year-variant county controls for population, total employment, unemployment insurance compensation per capita, and income per capita (retrieved from the Bureau of Economic Analysis).Footnote13 We find consistent results after including these additional controls.
Sixth, we include year-quarter fixed effects in Equation (2) in the main analysis to eliminate common shocks, such as general macroeconomic trends, to the LLP. To account for trends in quarters, we also estimate the model after replacing year-quarter fixed effects with year fixed effects and controlling for trends in quarters by introducing quarter-level changes in macroeconomic data that prior literature demonstrates affect LLP (Hribar et al., Citation2017). Therefore, we augment Equation (2) with the change in the unemployment rate, the change in Gross Domestic Product, and CFO Sentiment.Footnote14 We find consistent results after including these additional controls.
6. Additional Analyses
6.1. Additional Measures of Disaster Risk
We explore potential attributes of disaster risk to create alternative measures of DRt. Thus, we check the sensitivity of our results to multicounty, frequent event, and rare event disaster risk. First, we compute an alternative measure of disaster risk (DR_MULTICOUNTYt) to consider the potential disaster risk mitigation generated through branch diversification outside the headquarters county but within the same state. Using yearly data on bank branches from the Summary of Deposits database, we calculate a multicounty measure of disaster risk at the county-year level. As a starting point, we assign the corresponding disaster risk to each bank branch. Then, we compute a weighted average measure of disaster risk using the number of branches in each county as weights. The weighted average allows consideration of the effective pervasiveness of a bank in each county, which may also vary over our sample period (i.e. a bank may progressively increase or decrease the number of branches in a county). Untabulated descriptive statistics show that the mean of DR_MULTICOUNTYt is similar to that of DRt (4.95) but less volatile than the headquarters disaster risk measure (standard deviation for DR_MULTICOUNTYt is 2.70; standard deviation for DRt is 2.84).
Second, depending on the geographical area, some climate events are more frequent than others. For example, hurricanes are frequent in Florida, fire events in Texas, and floods in Iowa. Our disaster risk measure includes both frequent and rare natural disasters declared by FEMA over a 15-year span in each county and quarter. To explore the attributes of our original DRt measure, we decompose disaster risk into frequent event disaster risk (DR_FREQUENTt) and rare event disaster risk (DR_RAREt). We define a frequent (rare) natural event as an event that occurs with a frequency equal to or higher (lower) than the median of the event’s frequency in each county. Untabulated descriptive statistics show that the mean of DR_FREQUENTt (DR_RAREt) is 3.37 (1.60).
Table presents the estimation results using the three alternative measures of disaster risk described above. In columns (1), (2) and (3), we replace DRt with DR_MULTICOUNTYt, DR_FREQUENTt, and DR_RAREt, respectively, as the main independent variable. Lastly, in column (4) we include both DR_FREQUENTt, and DR_RAREt. We find that all three alternative measures of disaster risk are positively and significantly related to LLP. The coefficients for DR_FREQUENTt, and DR_RAREt are not significantly different.
Table 5. Relation between additional measures of disaster risk and loan loss provisions.
6.2. Which Banks are Better Able to Incorporate Disaster Risk?
In this section, we investigate whether certain types of banks are better able to incorporate disaster risk in their LLP. We focus on bank size, complexity, and loan concentration as the main characteristics that can enable banks to better incorporate disaster risk in LLP.
First, we reason that relatively larger banks have more resources to invest in disaster risk management. For this reason, larger banks may be better able to incorporate disaster risk in LLP. We define small (large) banks as banks with total assets below (above) the 25th (75th) percentile of the distribution. Second, banks with a complex set of activities (i.e. that engage in activities other than traditional lending) may find it more challenging to incorporate disaster risk in LLP. We define simple (complex) banks as banks with non-interest income over total income below (above) the 25th (75th) percentile of the distribution. Third, banks that concentrate their loan portfolios on specific loan categories are probably better able to assess the magnitude and characteristics of the disaster risk in their loan portfolios. We define unconcentrated (concentrated) banks as banks with a standard deviation of loan categories below (above) the 25th (75th) percentile of the distribution. We investigate whether these bank characteristics facilitate better recognition of disaster risk in LLP.
We estimate Equation (2) separately for each subsample based on the aforementioned bank characteristics and compare β1 across the subsamples and present the estimation results in Table . Columns (1) and (2) report the results for small and large banks, respectively, columns (3) and (4) for simple and complex banks, respectively, and columns (5) and (6) for unconcentrated and concentrated banks, respectively. Table also reports the difference in the coefficients of DRt across subsamples.
Table 6. Relation between disaster risk and loan loss provisions: cross-sectional tests based on banks’ characterisctis.
We find that disaster risk is positively and significantly related to LLP only for relatively large banks and not for small banks (coefficient of DRt is −0.0001, p > 0.10 in column (1) and 0.0027, p < 0.01 in column (2)), and that the coefficient for large banks is greater than the coefficient for small banks (the difference between the coefficients of DRt in columns (2) and (1) is 0.0028, p < 0.01). By contrast, disaster risk is significantly positively related to LLP for both simple and complex banks (coefficient of DRt is 0.0056, p < 0.01 in column (3) and 0.0015, p < 0.05 in column (4)), and the coefficient for complex banks is less than the coefficient for simple banks (the difference between the coefficients of DRt in columns (4) and (3) is −0.0041, p < 0.05). The results also show that disaster risk is significantly positively related to LLP for concentrated banks but not for unconcentrated banks (coefficient of DRt is 0.0005, p > 0.10 in column (5) and 0.0053, p < 0.01 in column (6)), and that the coefficient for concentrated banks is greater than the coefficient for unconcentrated banks (the difference between the coefficients of DRt in columns (6) and (5) is 0.0048; p < 0.01). These results indicate that bank characteristics like size, complexity, and loan concentration are related to the ability of banks to proactively recognize disaster risk in their LLP.
6.3. What are the Consequences of Managing Disaster Risk Through LLP?
If disaster risk is appropriately managed and incorporated in LLP, banks should experience positive future outcomes. For instance, when DRt is better incorporated in LLP, current LLP should better anticipate future loan charge-offs when the natural hazard occurs. Conversely, if the natural hazard does not occur in the future, banks should be able to bear more risk due to the fact that LLP already recognizes disaster risk. We employ the following model that is commonly used in the existing literature (Hribar et al., Citation2017) to test whether disaster risk moderates the relation between current LLP, future charge-offs, and future risk:
(4)
(4)
All variables are defined in Appendix A. We calculate future charge-offs (COt+1,t+4) as the average of net charge-offs from quarter t+1 to quarter t+4, divided by net loans and leases in quarter t. Similarly, we compute future risk (RISKt+1,t+4) as the average of z-scores from quarter t+1 to quarter t+4. We multiply the score by −1 so that higher values of z-score imply higher risk-taking.
Table presents the estimation results of Equation (4). The dependent variable is future charge-offs (COt+1,t+4) in columns (1) and (2) and future risk (RISKt+1,t+4) in columns (3) and (4). We estimate Equation (4) for subsamples of bank-quarter observations that experience a disaster in quarter t+1 (columns (2) and (4)) and bank-quarter observations that do not experience a disaster in quarter t+1 (columns (1) and (3)).
Table 7. Relation between disaster risk, current loan loss provisions and risk management.
We find that disaster risk positively moderates the relation between future charge-offs and current LLP only for the subsample of bank-quarter observations that experience a disaster in quarter t+1 (coefficient for the interaction term LLPt x DRt is insignificant in column (1), while it is positive and significant in column (2), with p < 0.05). Conversely, we show that disaster risk positively moderates the relation between future risk and current LLP only for the subsample of bank-quarter observations that do not experience a disaster in quarter t+1 (coefficient of the interaction term LLPt x DRt is positive and significant in column (3), p < 0.01, and is insignificant in column (4)).
We interpret these results as evidence that LLP better anticipates future charge-offs, following the incorporation of disaster risk in LLP, when future risk materializes in natural events. Conversely, when disaster risk does not materialize, the incorporation of disaster risk in LLP allows banks to bear more future risk.
7. Conclusions
Natural disasters have been increasing in frequency and intensity since the early 1950s. These phenomena impose a strain on the financial system. Therefore, there is considerable concern about whether and how financial institutions identify, measure, and monitor disaster risk. In fact, disaster risk could concentrate in lending portfolios and create a systemic risk to financial stability. In this study, we investigate whether disaster risk relates to banks’ LLP.
We propose a measure of disaster risk based on the number of natural disasters declared by FEMA over a 15-year span for each county and quarter. We validate our measure using three approaches, including the UN Sendai Framework for disaster risk reduction, and show that it captures the constructs of natural hazard, exposure, and vulnerability. Using a sample of 445,924 bank-quarter observations, we find evidence that banks operating in high disaster-risk counties report higher LLP. In particular, disaster risk is positively related to LLP even after controlling for previously identified determinants of normal LLP such as loan charge-offs and current, past, and future changes in nonperforming assets. This finding is robust to several tests to alleviate sample heterogeneity and endogeneity concerns. To strengthen a causal interpretation of the relation between disaster risk and LLP, we conduct a difference-in-differences analysis using Hurricane Katrina as a shock that induced banks to reprice disaster risk in LLP. Our results are also robust to other sensitivity tests, including the use of alternative measures of disaster risk that captures multicounty, frequent events, and rare events disaster risk.
Our findings have implications for the debate in the financial system related to supervision of the risk associated with natural disasters. While our findings show that bank managers incorporate disaster risk in their LLP, they also highlight that large banks, which have more resources to invest, are better able to manage credit risk from disasters through LLP. Our study is important for regulators and policy makers. Our results indicate that giving managers discretion to incorporate future disaster risk in current LLP allows them to better account for future long-term loan losses. In this regard, the proposed expected credit loss accounting rules for LLP are timely and will further enable managers to build reserves to mitigate disaster-related risk exposures.
Our study is subject to certain limitations. First, our measure of disaster risk is new in the literature and could be further refined. Future studies could identify firm-level measures of disaster risk and loan portfolio disaster risk. Second, that our measure is based on major disasters declared by FEMA and could be further enriched by including additional data on natural disasters from other sources. Lastly, we restrict our sample to U.S. banks and, as a result, our findings may have implications for these banks only.
Online_Appendix_29082022_final.docx
Download MS Word (98.5 KB)Acknowledgements
We thank Beatriz Garcia Osma (Editor), two anonymous reviewers, Claudia Imperatore (discussant), Thomas Bassetti, Jochen Bigus, Pawel Bilinski, Brian Bushee, Minyue Dong, Peter Fiechter, Elaine Henry, Xiaoran (Jason) Jia, Anya Kleymenova, Arthur Kraft, Christian Leuz, Tim Martens, Araceli Mora, Luc Paugam, Inês Pinto (discussant), Changjiang Wang, Joanna Wu, Lei Zhang, and workshop participants at the 2020 AAA Joint Midyear Meeting of the AIS, SET and International Sections, 2020 Swiss Accounting Research Alpine Camp, 16th European Financial Reporting Network, University of Bamberg, Nanyang Technological University, Yeshiva University, CASS Business School, University of Bologna, and Free University of Bozen.
Disclosure statement
No potential conflict of interest was reported by the author(s).
Data Availability Statement
The data are available from the sources identified in the text.
Supplemental Data and Research Materials
Supplemental data for this article can be accessed on the Taylor & Francis website, https://doi.org/10.1080/09638180.2022.2120513.
Appendix OA1. Validation of disaster risk measure using the German Watch Framework and the National Risk Index from the FEMA
Appendix OA2. Definition of variables used in validating disaster risk
Appendix OA3. Sample heterogeneity: Coarsened Exact Matching and Entropy Matching Analysis
Table OA1. Sample distribution by state and year
Table OA2. Disaster type distribution
Table OA3. Validation of disaster risk measure through the German Watch framework
Table OA4. Validation of disaster risk measure through the National Risk Index
Table OA5. Pearson’s correlation coefficients
Table OA6. Relation between disaster risk and loan loss provisions: Matched sample selection
Additional information
Funding
Notes
1 The UN Sendai Framework for disaster risk reduction was adopted at the Third UN World Conference in Sendai, Japan, on March 18, 2015. The Sendai Framework replaced the Hyogo Framework for Action 2005–2015. Among others, the main objectives of the Sendai Framework are the improved understanding of disaster risk in all its dimensions, the strengthening of disaster risk governance, and the mobilization of risk-sensitive investment to avoid the creation of new risk.
2 We provide a more detailed discussion of the mechanism through which banks incorporate disaster risk in their LLP in Section 3.
4 In sensitivity analysis, we show that managers explicitly incorporate disaster risk into LLP and do not reflect the effects of a recent disaster in their estimations.
5 In 2020 the FASB replaced the incurred loss model with the expected loss model. Although we develop our hypothesis using arguments based on the incurred loss model, we note that a similar line of reasoning is applicable for the expected loss model.
9 Our main analysis is robust to the inclusion of interstate banks in the sample.
10 The full dataset containing disaster risk and disaster risk determinants at the county level is available upon request from the authors.
11 We assess the reliability of the causal interpretation of our results by testing for the parallel trends assumption. We first assume a linear pre-treatment trend and then test this assumption using a local approach. Untabulated results show that treated and untreated firms exhibit the same pre-treatment linear trend and that no time-to-time difference arises between treated and untreated units during the pre-treatment period.
12 Full results are available upon request from the authors.
14 The data in the Duke CFO Magazine Global Business Outlook survey, which is available at https://www.cfosurvey.org, starts in 2004. Therefore, our sample size is reduced to 308,125 bank-quarter observations for this test.
References
- Arya, A. S. (2000). Non-engineered construction in developing countries-an approach toward earthquake risk prediction. Bulletin of the New Zealand Society for Earthquake Engineering, 33(3), 187–208. https://doi.org/10.5459/bnzsee.33.3.187-208
- Baldauf, M., Garlappi, L., & Yannelis, C. (2020). Does climate change affect real estate prices? Only if you believe in it. The Review of Financial Studies, 33(3), 1256–1295. https://doi.org/10.1093/rfs/hhz073
- Beatty, A., Chamberlain, S., & Magliolo, J. (1995). Managing financial reports of commercial banks: The influence of taxes, regulatory capital, and earnings. Journal of Accounting Research, 33(2), 231–261. https://doi.org/10.2307/2491487
- Beatty, A., & Liao, S. (2014). Financial accounting in the banking industry: A review of the empirical literature. Journal of Accounting and Economics, 58(2-3), 339–383. https://doi.org/10.1016/j.jacceco.2014.08.009
- Bennett, B., & Wang, Z. (2019). Costs of natural disasters in public financing. Fisher College of Business (Working Paper 2019-03-009). https://papers.ssrn.com/sol3/papers.cfm?abstract_id=3359694
- Berg, G., & Schrader, J. (2012). Access to credit, natural disasters, and relationship lending. Journal of Financial Intermediation, 21(4), 549–568. https://doi.org/10.1016/j.jfi.2012.05.003
- Botzen, W. J. W., & Van Den Bergh, J. C. J. M. (2012). Monetary valuation of insurance against flood risk under climate change. International Economic Review, 53(3), 1005–1026. https://doi.org/10.1111/j.1468-2354.2012.00709.x
- Boustan, L. P., Kahn, M. E., Rhode, P. W., & Yanguas, M. L. (2017). The effect of natural disasters on economic activity in US counties: A century of data (NBER Working Paper 23410). http://www.nber.org/papers/w23410
- Brei, M., Mohan, P., & Strobl, E. (2019). The impact of natural disasters on the banking sector: Evidence from hurricane strikes in the Caribbean. The Quarterly Review of Economics and Finance, 72, 232–239. https://doi.org/10.1016/j.qref.2018.12.004
- Choi, D., Gao, Z., & Jian, W. (2020). Attention to global warming. The Review of Financial Studies, 33(3), 1112–1145. https://doi.org/10.1093/rfs/hhz086
- Clark, C. (2019). Climate change scenario analysis for public market investors. Journal of Applied Corporate Finance, 31(2), 118–123. https://doi.org/10.1111/jacf.12353
- Collins, J. H., Shackelford, D. A., & Wahlen, J. M. (1995). Bank differences in the coordination of regulatory capital, earnings, and taxes. Journal of Accounting Research, 33(2), 263–291. https://doi.org/10.2307/2491488
- Cortés, K. R., & Strahan, P. E. (2017). Tracing out capital flows: How financially integrated banks respond to natural disasters. Journal of Financial Economics, 125(1), 182–199. https://doi.org/10.1016/j.jfineco.2017.04.011
- Costello, A. M., Granja, J., & Weber, J. (2019). Do strict regulators increase the transparency of banks? Journal of Accounting Research, 57(3), 603–637. https://doi.org/10.1111/1475-679X.12255
- Delis, M., de Greiff, K., & Ongena, S. (2019). Being stranded with fossil fuel reserves? Climate policy risk and the pricing of bank loans (Swiss Finance Institute Research Paper No. 18-10). https://papers.ssrn.com/sol3/papers.cfm?abstract_id=3125017
- Dessaint, O., & Matray, A. (2017). Do managers overreact to salient risks? Evidence from hurricane strikes. Journal of Financial Economics, 126(1), 97–121. https://doi.org/10.1016/j.jfineco.2017.07.002
- Dugan, J. (2009). Loan loss provisioning and pro-cyclicality. Remarks by John C. Dugan, Comptroller of the Currency before the Institute of International Bankers. https://www.occ.treas.gov/news-issuances/speeches/2009/pub-speech-2009-16.pdf
- Eckstein, D., Kunzel, V., & Schafer, L. (2021). Global climate risk index. https://www.germanwatch.org/sites/default/files/GlobalClimateRiskIndex2021_2.pdf
- Elsner, J. B., & Jagger, T. H. (2006). Prediction models for annual U.S. hurricane counts. Journal of Climate, 19(12), 2935–2952. https://doi.org/10.1175/JCLI3729.1
- Ernst & Young. (2016). Climate change. The investment perspective. https://www.ey.com/Publication/vwLUAssets/EY-climate-change-and-investment/%24FILE/EY-climate-change-and-investment.pdf
- Felbermayr, G., & Groschl, J. (2014). Naturally negative: The growth effects of natural disasters. Journal of Development Economics, 111, 92–106. https://doi.org/10.1016/j.jdeveco.2014.07.004
- Gomaa, M., Kanagaretnam, K., Mestelman, S., & Shehata, M. (2019). Testing the efficacy of replacing the incurred credit loss model with the expected credit loss model. European Accounting Review, 28(2), 309–334. https://doi.org/10.1080/09638180.2018.1449660
- Hilary, G., & Hui, K. W. (2009). Does religion matter in corporate decision making in America? Journal of Financial Economics, 93(3), 455–473. https://doi.org/10.1016/j.jfineco.2008.10.001
- Hong, H., Li, F. W., & Xu, J. (2019). Climate risks and market efficiency. Journal of Econometrics, 208(1), 265–281. https://doi.org/10.1016/j.jeconom.2018.09.015
- Hosono, K., Miyakawa, D., Uchino, T., Hazama, M., Ono, A., Uchida, H., & Uesugi, I. (2016). Natural disasters, damage to banks, and firm investment. International Economic Review, 57(4), 1335–1370. https://doi.org/10.1111/iere.12200
- Howe, P., Mildenberger, M., Marlon, J., & Leiserowitz, A. (2015). Geographic variation in opinions on climate change at state and local scales in the USA. Nature Climate Change, 5(6), 596–603. https://doi.org/10.1038/nclimate2583
- Hribar, P., Melessa, S. J., Small, R. C., & Wilde, J. H. (2017). Does managerial sentiment affect accrual estimates? Evidence from the banking industry. Journal of Accounting and Economics, 63(1), 26–50. https://doi.org/10.1016/j.jacceco.2016.10.001
- Hsiang, S., Kopp, R., Jina, A., Rising, J., Delgado, M., Mohan, S., Rasmussen, D. J., Muir-Wood, R., Wilson, P., Oppenheimer, M., Larsen, K., & Houser, T. (2017). Estimating economic damage from climate change in the United States. Science, 356(6345), 1362–1369. https://doi.org/10.1126/science.aal4369
- Huang, H. H., Kerstein, J., & Wang, C. (2018). The impact of climate risk on firm performance and financing choices: An international comparison. Journal of International Business Studies, 49(5), 633–656. https://doi.org/10.1057/s41267-017-0125-5
- Hugon, A., & Law, K. K. F. (2019). Impact of climate change on firm earnings: Evidence from temperature anomalies (Working paper). https://papers.ssrn.com/sol3/papers.cfm?abstract_id=3271386
- Kanagaretnam, K., Krishnan, G. V., & Lobo, G. J. (2010). An empirical analysis of auditor independence in the banking industry. The Accounting Review, 85(6), 2011–2046. https://doi.org/10.2308/accr.2010.85.6.2011
- Kanagaretnam, K., Lim, C. Y., & Lobo, G. J. (2014). Influence of national culture on accounting conservatism and risk-taking in the banking industry. The Accounting Review, 89(3), 1115–1149. https://doi.org/10.2308/accr-50682
- Klomp, J. (2014). Financial fragility and natural disasters: An empirical analysis. Journal of Financial Stability, 13, 180–192. https://doi.org/10.1016/j.jfs.2014.06.001
- Koetter, M., Noth, F., & Rehbein, O. (2020). Borrowers under water! Rare disasters, regional banks, and recovery lending. Journal of Financial Intermediation, 43, 1–14. https://doi.org/10.1016/j.jfi.2019.01.003
- Kruger, P., Sautner, Z., & Starks, L. T. (2019). The importance of climate risks for institutional investors. Swiss Finance Institute Research Paper Serie n. 18-58. https://papers.ssrn.com/sol3/papers.cfm?abstract_id=3235190
- Landsea, C. W. (2005). Hurricanes and global warming. Nature, 438(7071), E11–E13. https://doi.org/10.1038/nature04477
- Landsea, C. W., Harper, B. A., Hoarau, K., & Knaff, J. A. (2006). Can we detect trends in extreme tropical cyclones? Science, 313(5786), 452–454. https://doi.org/10.1126/science.1128448
- Lanfear, M. G., Lioui, A., & Siebert, M. G. (2019). Market anomalies and disaster risk: Evidence from extreme weather events. Journal of Financial Markets, 46(100477), 1–29. https://doi.org/10.1016/j.finmar.2018.10.003
- Liu, C., & Ryan, S. (2006). Income smoothing over the business cycle: Changes in banks’ coordinated management of provisions for loan losses and loan charge-offs form the pre-1990 bust to the 1990s boom. The Accounting Review, 81(2), 421–441. https://doi.org/10.2308/accr.2006.81.2.421
- National Oceanic and Atmospheric Administration (NOAA). (2015). Special Report on Hurricane Katrina. https://www1.ncdc.noaa.gov/pub/data/extremeevents/specialreports/Hurricane-Katrina.pdf
- Nguyen, L., & Wilson, J. O. S. (2020). How does credit supply react to a natural disaster? Evidence from the Indian Ocean Tsunami. The European Journal of Finance, 26(7-8), 802–819. https://doi.org/10.1080/1351847X.2018.1562952
- Nicoletti, A. (2018). The effects of bank regulators and external auditors on loan loss provisions. Journal of Accounting and Economics, 66(1), 244–265. https://doi.org/10.1016/j.jacceco.2018.05.003
- Noth, F., & Schuwer, U. (2018). Natural disaster and bank stability: Evidence from the U.S. financial system (SAFE working paper No. 167). https://papers.ssrn.com/sol3/papers.cfm?abstract_id=2921000
- Organisation for Economic Co-operation and Development (OECD). (2012). Disaster risk assessment and risk financing. A G20-OECD Methodological Framework. https://www.preventionweb.net/publications/view/29524
- Organisation for Economic Co-operation and Development (OECD). (2015). Disaster risk financing. https://www.oecd.org/daf/fin/insurance/OECD-Disaster-Risk-Financing-a-global-survey-of-practices-and-challenges.pdf
- Pielke Jr, R. A., Landsea, C., Mayfield, M., Layer, J., & Pasch, R. (2005). Hurricanes and global warming. Bulletin of the American Meteorological Society, 86(11), 1571–1576. https://doi.org/10.1175/BAMS-86-11-1571
- Powell, J. (2019). Response to Honorable Senator Brian Shatz. https://www.schatz.senate.gov/imo/media/doc/Chair%20Powell%20to%20Sen.%20Schatz%204.18.19.pdf
- PriceWaterhouseCoopers. (2016). Climate policy risk. How does this become a credit risk for banks? https://www.pwchk.com/en/migration/pdf/climate-policy-dec2016.pdf
- Schuwer, U., Lambert, C., & Noth, F. (2019). How do banks react to catastrophic events? Evidence from Hurrican Katrina. Review of Finance, 23(1), 75–116. https://doi.org/10.1093/rof/rfy010
- Standard & Poor’s. (2015a). How environmental and climate risks factor into global corporate ratings. https://www.environmental-finance.com/assets/files/HowEnvironmentalAndClimateRisksFactorIntoGlobalCorporateRatingsOct212015(2).pdf
- Standard & Poor’s. (2015b). Climate change will likely test the resilience of corporates’ creditworthiness to natural catastrophes. http://www.actuarialpost.co.uk/downloads/cat1/SPClimateChangeImpactOnCorporatesApr212014.pdf
- Standard & Poor’s. (2017). How environmental and climate risks and opportunities factor into global corporate ratings – an update. https://www.spglobal.com/_assets/documents/ratings/research/how-environmental-and-climate-risks-and-opportunities-factor-into-global-corporate-ratings-an-update.pdf
- Tomy, R. E. (2019). Threat of entry and the use of discretion in banks’ financial reporting. Journal of Accounting and Economics, 67(1), 1–35. https://doi.org/10.1016/j.jacceco.2018.06.003
- United Nations International Strategy for Disaster Reduction (UNISDR). (2015). Sendai framework for disaster risk reduction 2015–2030. https://www.preventionweb.net/files/43291_sendaiframeworkfordrren.pdf
- United Nations Office for Disaster Risk Reduction (UNDRR). (2019). GAR. Global assessment report on disaster risk reduction 2019. https://gar.undrr.org/sites/default/files/reports/2019-05/full_gar_report.pdf
- World Bank GFDRR (Global Facility for Disaster Reduction and Recovery). (2014). Understanding risk in an evolving world. https://www.gfdrr.org/sites/gfdrr/files/publication/Understanding_Risk-Web_Version-rev_1.8.0.pdf