
 ?Mathematical formulae have been encoded as MathML and are displayed in this HTML version using MathJax in order to improve their display. Uncheck the box to turn MathJax off. This feature requires Javascript. Click on a formula to zoom.
Abstract
For advanced economies, it is a well-established stylized fact that large cities are relatively skill abundant. For emerging markets, like China, this relationship is less well established. We show, using recently developed tests, that also in China higher skills sort into larger locations. This sorting process is consistent with the comparative advantage of cities. We identify two types of spatial units (Core-Cities and Extended-Cities) and analyse sorting for three types of skills (education skills, sector skills, and occupation skills). The sorting process across cities is stronger for Core-Cities than for Extended-Cities, stronger for education skills than for sector- and occupation skills, and stronger for 2010 than for 2000. We interpret these results as an indication that investments in, for example, infrastructure and institutional liberalization (such as the relaxation of the Hukou system), stimulates sorting of higher skills in larger cities.
1. Introduction
The distribution of skills across cities in advanced economies is characterized by larger cities being relatively skill abundant. This sorting of skills across cities is a well-established empirical fact (see Combes and Gobillon Citation2015 for a survey). For developing economies, the positive relationship between skill level and city size is less well established (see Dingel, Miscio, and Davis Citationforthcoming, for recent evidence). We show that for China the positive relationship also holds for two types of spatial units, which we label Core-Cities and Extended-Cities, and three types of incorporated skills, namely for education, sectors, and occupations.
For China this sorting of skills across cities is not immediately obvious. Despite the economic reform process that started in 1978, agglomeration of economic activity in China lags behind compared to advanced economies.Footnote1 Lu and Tao (Citation2009, 167), for instance, note that ‘industrial agglomeration in China … has increased steadily … though it is still much lower than those of selected developed countries such as France, United Kingdom, and the United States’. In similar vein, Fujita et al. (Citation2004, 2955) observe that the Gini-coefficient of the spatial distribution of economic activity for China is 0.43, which is ‘way below the world [average] … Only former Soviet bloc countries have similarly low Gini's, Russia with 0.45 and Ukraine with 0.40’. Institutional restrictions on internal migration, notably but not exclusively the Hukou system, are often mentioned as an explanation for the outcome.Footnote2 The consensus in the literature seems to be that China is under-urbanized, a point forcefully put forward by Au and Henderson (Citation2006a, Citation2006b).
The evidence presented in this paper shows, however, that not only urbanization in China has increased over time, but more importantly that this is accompanied by a sorting process that is similar to that in advanced economies. Also in China larger cities are becoming more-and-more high-skill abundant. One possible explanation for this sorting process is that the Hukou system, which limits migration, is liberalized. This easing of the Hukou system increases labor mobility. In addition, agricultural reforms, investments in infrastructure and education, in combination with higher urban wages, further stimulate rural–urban migration.Footnote3 As a result, most cities grow (see Chen and Partridge Citation2013; Yang and Dunford Citation2018). The contribution of this paper is to describe the characteristics of Chinese city growth in terms of sorting. We use three measures to illustrate the sorting process: skilled workers, sectors that use skilled workers intensively and skilled occupations all tend to concentrate disproportionally in larger cities. In addition, we show that this process becomes stronger over time. Our results show that increasingly the sorting pattern of (larger) Chinese cities is consistent with the comparative advantage of cities.
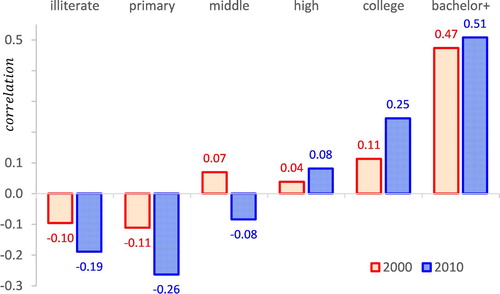
We illustrate our findings for the sorting of education skills in Core-Cities using simple methods in two figures. shows the instantaneous correlation between the population share of an education level (in percent) and the log of population size at two points in time (2000 and 2010). The figure is ordered by rising education level (illiterate, primary school, middle school, high school, college, and bachelor or more). In both years the correlation is negative for low education levels (the lowest two levels in 2000 and the lowest three levels in 2010) and positive for high education levels (the highest four levels in 2000 and the highest three levels in 2010). Moreover, correlation tends to rise with the education level. This indicates that the share tends to fall with city size for low education levels and tends to rise for high education levels, and increasingly so with education level. Moreover, both effects are stronger in 2010 than in 2000, in line with our analytical findings below.
Figure 1. Correlation between share education level and log population in Core-Cities; China 2000, 2010. Source: calculations based on Chinese census of population, 2000 and 2010; see the main text for details.
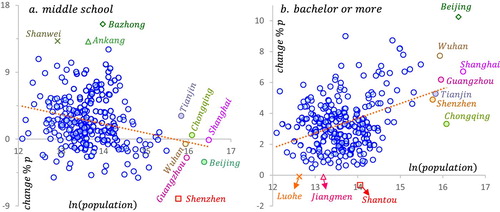
focuses on the relationship between initial population size and the change over time (in percentage points) from 2000 to 2010 for two education levels; middle school (panel a) and bachelor or more (panel b). As indicated by the dotted trendlines, the association between initial population size and the change over time is negative for middle school and positive for bachelor or more. The average change over time is 2.4 percentage points for middle school and 3.4 percentage points for bachelor or more. Large cities, such as Shanghai, Beijing, Qongqing, Guangzhou, Wuhan, Tianjin, and Shenzhen, tend to be below the average for middle school education levels (similar for high school, not shown) and above the average for Bachelor or more levels (similar for college, not shown).Footnote4 Indeed, for middle school the decline is highest for Shenzhen (a large city; –8.0 percentage points), while there is also a decline for Shanghai, Beijing, Guangzhou, and Wuhan. In contrast, the rise for middle school is highest for small- and medium-sized cities, like Bazhong (Sichuan province; +15.5 percentage points), Ankang (Shaanxi province), and Shanwei (Guangdong province). Similarly, for the bachelor or more education level the rise is highest for Beijing (a large city; +10.2 percentage points), while it is also high for Shanghai, Wuhan, and Guangzhou. In contrast, again, the decline is highest in small- and medium-sized cities, like Shantou (Guangdong province; -0.6 percentage points), Jiangmen (Guangdong province), and Luohe (Henan province). Both and illustrate that large cities are relatively skill abundant and that this effect has strengthened in the period 2000 to 2010.
Figure 2. Initial population size and change in education level in Core-Cities; China 2000–2010. Source: Calculations based on Chinese census of population, 2000 and 2010; log population in 2000 on horizontal axis; change in education share from 2000 to 2010 (in percentage points); dotted line is a trendline; 251 Core-Cities included; see main text for details.
As the basis for our empirical results, we use the theoretical framework developed by Davis and Dingel (Citation2020). Their theory explains a sorting pattern of skills across cities that is consistent with comparative advantage. They develop two empirical tests; an elasticity test and a pairwise comparison test. The latter is related to Sattinger (Citation1978). The tests illustrate the sorting pattern across cities; certain skills are relatively more productive in sectors that use these skills intensively. We use data from the Chinese census of population in 2000 and 2010 (more recent data are not available), and employ both tests to identify the interactive relationships between location size on the one hand and incorporated skills on the other hand. We derive four main results: (i) the results of both tests show that larger locations are relatively more skill abundant, while the sorting of skills is (ii) stronger for Core-Cities than for Extended-Cities, (iii) stronger for education skills than for sector- and occupation skills, and (iv) stronger in 2010 than in 2000. One of the consequences is that the degree of ‘under-urbanization’ in China, as noted by Au and Henderson (Citation2006a, Citation2006b), has been declining since 1995. Our results are consistent with Brakman, Garretsen, and van Marrewijk (Citation2016) who show that by now the ‘under-urbanization’ in China has virtually disappeared.
The remainder of this paper is organized as follows. Section 2 reviews related studies. Section 3 sets out the methodology of the elasticity test and the pairwise comparison test. Section 4 discusses data sources. Section 5 presents the results on the relationships between location size for education, sectors, and occupations. Section 6 offers concluding remarks.
2. Related studies
This paper is related to two strands of literature. The first focuses on agglomeration economies (see, e.g. Rosenthal and Strange Citation2004). Agglomeration economies benefit from a division of labor and skills across cities. Glaeser (Citation1999), Mori and Turrini (Citation2005), Glaeser and Resseger (Citation2010), Duranton and Jayet (Citation2011), for instance, find that workers of higher skills are inclined to live in larger cities.
This sorting process of higher skills in larger locations can be explained because the most talented or productive people are able to afford life in bigger and more expensive cities (see Combes et al. Citation2012; or Behrens, Duranton, and Robert-Nicoud Citation2014, for an overview of this literature).Footnote5 In addition, in larger cities specific sectors and people can benefit from agglomeration economies that make them more productive. So, bigger cities are not only more productive than smaller cities because of agglomeration economies, but also because more productive people or firms sort into bigger cities.
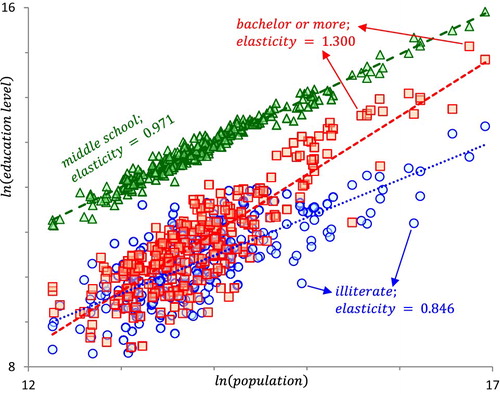
provides a simple illustration of this process for China in 2010. Differentiating between three education levels: illiterate (circles), middle school (triangles), and bachelor-or-more (squares), we observe a positive relationship between city population size and the number of people of a certain education level. The estimated elasticities indicate that a 10% larger population leads to a less-than-proportional increase in the number of illiterates (namely only an 8.5% rise), a proportional increase in the number of middle school graduates (a 10% increase), and a more-than-proportional increase in the number of bachelor-or-more graduates (namely a 13% increase). Consistent with our hypothesis, higher skill levels tend to be more abundantly present in larger cities.
Figure 3. Selected skill sorting as measured by education level in Core-Cities; China, 2010. Source: Chinese census of population, 2010; vertical axis depicts the log of the number of people with a certain education level living in the city; see the main text for details.
A second strand of literature focusses on the distribution of industries across cities. The classic reference is Henderson (Citation1974). He argues that the optimal city size is characterized by the trade-off between industry specific economies of scale and the local cost of living. This trade-off varies with the type of specialized production in the city due to different degrees of economies of scale across sectors. Henderson (Citation1983), using data for the USA in 1970 and a ‘back-of-the-envelope’ method, finds that manufacturing activities appear to concentrate in larger cities, especially the white-collar sectors, business services, finance, insurance and real estate, with the exception of resource-based manufacturing which tends to decline with city size. Henderson (Citation1997) extends his empirical work to other economies, such as Brazil, Japan and Korea, finding similar patterns in all of these countries; larger cities are home to high-tech and diversified manufactures, business services, and R&D activities. Holmes and Stevens (Citation2004) empirically examine the spatial distribution of economic activities in North America. They find that agriculture, mining, manufacturing, and utilities concentrate in smaller cities. In contrast, transportation, wholesale trade, real estate, finance & insurance, management, and professional services trend to concentrate in larger cities (consistent with Henderson Citation1983 and 1997). Other studies find similar patterns of specialization of sectors and industries in bigger or smaller agglomerations (Duranton and Overman Citation2005, Citation2008; Fujita et al. Citation2004).
A theory that combines the two strands of literature is developed by Davis and Dingel (Citation2020), in which they also develop two tests to confirm that the sorting pattern across cities is consistent with comparative advantage (see also Sattinger Citation1978, 1993). The paper closest to ours is Dingel, Miscio, and Davis (Citationforthcoming, henceforth DMD) This paper focusses on nighttime light data and is largely a proof-of-concept paper; nightlight data are consistent with log-linear rank-size curves for three countries: Brazil, China, and India. Especially for China this reality check is important because with the often-used prefecture data a non-linear rank-size curve results. In this respect, nighttime light data perform better than prefecture data. We also apply this reality check to our definitions of spatial units. DMD also show that nighttime data for the US are consistent with commuting-defined metropolitan areas. For China, commuting data are not available and DMD assume by implication that Chinese nighttime data also include commuting areas. A potential disadvantage of nighttime light data is that regional or spatial policies, such as the liberalization of the Hukou system, are directed towards administratively defined spatial units and not directed to areas defined by nightlight data. Specifically, we differ in three main respects. First, we concentrate on administrative units and differentiate between Core-Cities and Extended-Cities. The reality check – stressed by DMD – of a log linear rank-size curve holds well for Core-Cities and reasonably well for Extended-Cities. Second, in addition to the education data that DMD use to measure skills we add the skill intensity of occupations and sectors. Third, we show that the sorting process becomes stronger over time by comparing the performance of the tests in 2000 and 2010, whereas DMD only look at 2000.
3. Empirical strategy
Our empirical strategy is based on the theoretical work of Davis and Dingel (Citation2020) who provide two empirical tests for their model: an elasticity test and a pairwise comparison test. The tests check whether the sorting pattern of skills across cities is consistent with comparative advantage.
3.1 Elasticity test
The theoretical model of Davis and Dingel (Citation2020) explains that higher skilled workers have higher city population elasticities. The intuition behind this implication is illustrated in . The slope of the curve – and thus the elasticity – for population with a bachelor degree is steeper than that for illiterates; a 10% larger population leads to a less-than-proportional increase in the number of illiterates (namely only an 8.5% rise), and a more-than-proportional increase in the number of bachelor-or-more graduates (namely a 13% increase). City size increases are more beneficial for higher skilled people than for lower skilled.
The elasticity test thus indicates – if confirmed – that larger cities are relatively more skill abundant. In other words, the city-population elasticity of a skill type is rising in skill levels. We use the following regression:
(1)
(1)
where
is the number of people in city c with incorporated-skill level
, where
are fixed effects,
is city
's population size, and
is the population elasticity. Compared to DMD, we have three ways of measuring skill levels in cities instead of only one, as we analyse
for incorporated education skills
for the population, sector skills
for workers in a sector, and occupation skills
for workers in an occupation. All skill intensities are measured as years of schooling. The test is now simple, one can compare the values of
, for different skill levels; the higher the skill level, the higher the elasticity:
.
3.2. Pairwise comparison test
A second, non-parametric test of the model developed by Davis and Dingel (Citation2020) is the pairwise comparison test. This test is related to the concept of comparative advantage; certain skills are relatively more productive in sectors that use these skills intensively (see also Sattinger Citation1978, Citation1993). The test is related to that of Sattinger (Citation1978, 261) who observes; ‘if there was systematic comparative advantage, some orderings would be more likely than others’. The ordering is as follows. If high-skilled sectors are more productive in larger cities, larger cities become more skill abundant. This sorting process is tested by the pairwise comparison test. The inequality in equation (2), states this more formally: larger cities c house relatively more high incorporated skills than low incorporated skills
compared to smaller cities
. The test involves making all possible bilateral comparisons, also for city bins, see Section 5.
(2)
(2)
Since China is engaged in a long transformation process from a centrally-planned economy to a more market-oriented economy, we expect the predictive power to improve as labor and firms become more mobile and can benefit from agglomeration economies. To summarize the discussion, we have the following hypotheses:
H1: Larger cities are relatively more incorporated-skill abundant (for education skills, sector skills, and occupation skills).
H2: The validity of H1 improves over time, as the Chinese economy becomes more market-oriented.
We use the ‘elasticity test’ and the ‘pairwise comparisons test’ to evaluate the hypotheses. The focus of both tests is on the interaction between skills and city size. Neither test requires controls, such as correcting for cities specializing in high-tech sector demanding more high-skilled workers, because it is precisely this type of sorting that the model predicts.
4. Data
4.1 The administrative division of locations
Our primary data sources are the population census of 2000 and the population census of 2010. The administrative division of Mainland China consists of five levels, but our dataset only covers the top three levels: the provincial level, the prefecture level, and the county level.Footnote6 Most studies on Chinese cities use prefectures as the unit of analysis, but for our purposes it is important to define cities more precisely.
There are different types of county levels, such as ‘district’ and ‘county’ proper, where ‘district’ is urban-based while county is rural-based. We have three different types of locations, namely two ‘urban’ levels and one ‘regional’ level to analyze the sorting of education, sectors, and occupations over different locations. We label these Prefectures, Extended-Cities, and Core-Cities, see .
Table 1. Summary of administrative division at prefectural, Extended-City and Core-City levels
The prefecture level is the basis of our spatial units: smaller divisions within a prefecture are aggregated to form a specific spatial unit. As a consequence, the number of Core-Cities, Extended-Cities, and Prefectures would in principle be the same in a given year. However, since certain prefecture levels do not contain districts and/or county-level cities, the number of Core-Cities and Extended-Cities is lower. More precisely, for the whole country there are 262 Core-Cities, 312 Extended-Cities, and 338 Prefectures in 2000, while there are 284 Core-Cities, 316 Extended-Cities, and 337 Prefectures in 2010.
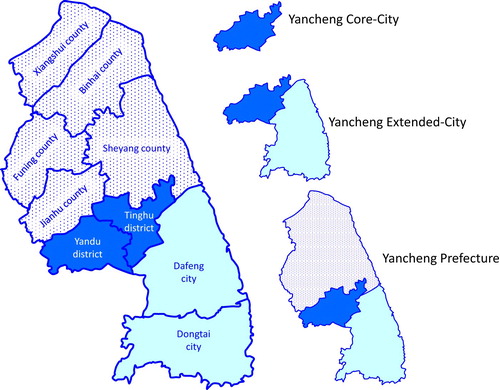
illustrates our procedure for location construction for the Yancheng prefecture in the east-coastal province of Jiangsu (close to Shanghai) in 2010. The area of Yancheng prefecture is almost 17,000 km2, roughly the size of Swaziland or half the size of the Netherlands. Yancheng prefecture consists of 9 county-level sub-regions, namely 2 districts, 2 county-level cities, and 5 (rural) counties. Yancheng Prefecture consists of the population of all 9 counties, or about 7.3 million people in total. Yancheng Extended-City consist of the two districts (Yandu and Tinghu) and the two county-level cities (Dafeng and Dongtai), or about 3.3 million people (46% of the total population). Finally, Yancheng Core-City only consists of the two districts Yandu and Tinghu, or about 1.6 million people (22% of the total population). The definition thus becomes more concentrated and more coherent as we go from Prefecture to Extended-City to Core-City.Footnote7
Figure 4. Yancheng prefecture; Jiangsu province, China, 2010.
shows that Prefectures include all seven types of county-level administrative divisions (listed in the table from District to Adm. committee).Footnote8 In terms of coverage, Prefecture accounts for more than 98% of the total population in both 2000 and 2010.Footnote9
Extended-Cities is a subset of Prefecture excluding all ‘rural’ type counties. In particular, we only include District and County-level city. The share of the total population living in Extended-Cities rose from about 46% in 2000 to 52% in 2010, partially because of direct migration and partially because of administrative changes.Footnote10 By construction, Extended-Cities functions as an urban area and can be used to test the model discussed in Section 2.
Core-Cities is a subset of Extended-Cities consisting only of Districts. This more narrowly defined urban location thus excludes the County-level cities, which could be viewed as more or less independent satellites rather than a true part of the location itself. The share of the total population living in Cities rose from about 26% in 2000 to 38% in 2010, again partially because of direct migration decisions and partially because of changes in administrative division (as a consequence of migration). Since Core-Cities is a more coherent urban location than Extended-Cities, the model discussed in Section 2 should be more directly applicable at the Core-Cities level. The results for other spatial units can be seen as a sensitivity check.
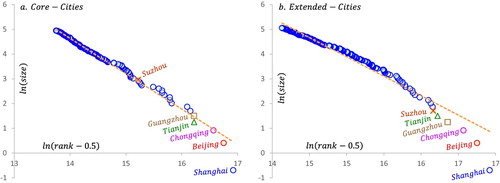
Following DMD we carry out a reality check on the data; as a stylized fact, city-distributions should follow a power-law or linear rank-size curve in the upper limit (see Brakman, Garretsen, and van Marrewijk Citation2020, Ch. 5 for a discussion). Using the Gabaix and Ibragimov (Citation2011) method, shows that a power law holds well for Core-Cities and reasonably well for Extended-Cities (share of variance explained is 98.4% and 95.5%, respectively). The remainder of the paper focuses on these two types of spatial units.
Figure 5. Core-Cities and Extended-Cities; rank-size distribution, 2010. The panels depict the upper (median and above) rank-size distributions for core-cities (panel a) and extended-cities (panel b); see main text for definitions; dashed lines are trendlines; slope is –1.4314 and –1.5684, share of variance explained is 98.4% and 95.5%, with 142 and 158 observations for core-cities and extended-cities, respectively.
4.2 Education skills, sector skills, and occupation skills11
The Chinese census of population (2000 and 2010) categorizes six groups of educational attainments, related to the number of years of schooling. We aggregate the county-level educational data into the Core-Cities and Extended-Cities and calculate the population share of each educational group in the total population of China, see .Footnote12
Table 2. Population shares of skill group by educational attainment in 2000 and 2010 (%).
Two observations are clear upon inspecting this table across time and location type. First, the education level is rising over time: the population share is falling for the two lowest education levels and rising for the three highest education levels for both location types.Footnote13 Second, the education level is higher in Core-Cities than in Extended-Cities: the population share is falling for the three lowest education levels and rising for the three highest education levels as we move from Extended-Cities to Core-Cities in both time periods. In 2010, for example, the population share with Primary school falls from 23.4% at the Extended-Cities level to 20.2% at the Core-Cities level. Similarly, the population share for College rises from 7.6 at the Extended-Cities level to 9.4 at the Core-Cities level.
The distributions of incorporated skills in sectors and occupations varies substantially across Chinese locations. To examine the interaction with population size, we use data on the sector and occupational employment from the Chinese census of population.Footnote14 The sectors were classified into 15 categories in 2000 and expanded into 20 categories in 2010, while the number of occupations consists of 7 categories in both years.Footnote15 To test the model we order sectors and occupations with respect to the corresponding skill intensities, which we collect from the China Labor Statistical Yearbook (2010). This lists sector and occupational employment as proportions of six educational attainments, measured by years of schooling.Footnote16 This is done for urban employment.Footnote17 The skill intensity is calculated as the weighted average years of schooling in each sector and occupation, ordered from low to high (see Tables and , left-hand panels).Footnote18 Urban focuses on the employment in urban areas, which includes all districts in prefectural levels and the center of towns below county levels. In the empirical tests, we use the Urban order in the Extended-Cities and Core-Cities estimations.
Table 3. Average education of employment and population share in each sector.
Table 4. Average education of employment and population share in each occupation.
The right-hand panels of Tables and show the share of each sector and occupation in the total population of China. For sectors (), Farming absorbed the largest share of population (except for Core-Cities in 2010), followed by Manufacturing in both 2000 and 2010. Although it is hard to compare developments over time because of the identification of 4 new sectors, it is clear that Farming employment fell over time, namely from 47% to 26% at the Extended-Cities level, and from 33% to 17% at the Core-Cities level. A comparison across location types is simple for both periods: the working population share in Farming falls as we move from Extended-Cities to Core-Cities, while the working population share for all other sectors either rises or is stable.
For occupations () the changes are straightforward (as there are no occupations added). The largest employment is in the occupation Agriculture (again, as with Farming for sectors, with the exception of Cities in 2010). The employment in Agriculture falls over time, while the employment in all other occupations rises over time for both location types (with the exception of Unit Heads in Core-Cities). When we compare across location types, employment is falling for Agriculture and rising for all other occupations as we move from Extended-Cities to Core-Cities in both periods (except for the ‘Others’ occupation, which is stable).
5. Empirical results
In this section, we use two empirical methods to test our hypotheses on incorporated skills in education, sector, and occupation. We also evaluate if the strength of the hypotheses rises over time. First, we examine the relationship between city size and the distribution of education skills. The results strongly confirm the prediction of Hypothesis 1 for both Core-Cities and Extended-Cities in both 2000 and 2010 (but the 2010 results are stronger than the 2000 results). Second, we examine the relationship between the city size and the distribution of sector skills and occupation skills. We find clear evidence that these distributions across cities changed from 2000 to 2010. More specifically, higher skill-intensive sectors and occupations only sorted in larger cities in 2010, while we do not find support for this type of sorting in 2000 (in line with Hypothesis 2).
A remark on the locations included in the analysis and discussion of Section 5 before we proceed is needed. Most provinces included in the China census are quite similar regarding location type, size, and population density structure, except for the four remote provinces Xinjiang, Tibet, Qinghai, and Inner Mongolia in the western and northern part of the country. As an illustration of this difference: the average county-level area size for these four provinces in 2010 is 15,100 km2 or eight times larger than the 1899 km2 for the other provinces in China. As is customary for empirical research on China we therefore focus the analysis and discussion on the more similar other provinces throughout Section 5, excluding the four remote provinces. The robustness analysis in Appendix B (available upon request) briefly discusses the results if the four remote provinces are included.Footnote19
5.1 Larger cities have relatively higher education skills
A. Elasticity test for education
This section examines the links between city size and the distribution of education skills. reports the population elasticities ( in equation [1]) of educational groups for both location types. In general, the estimated elasticities confirm that larger locations have relatively higher education-skilled inhabitants: the elasticities are higher for more skilled educational groups at the Core-Cities level in both years. Moreover, this trend is stronger in 2010 than in 2000. Similar, but somewhat weaker, results hold at the Extended-Cities level. To summarize, the elasticity test provides support for Hypothesis 1: larger locations are relatively more education-skill abundant. This holds for both 2000 and 2010, but the results are stronger for 2010 than for 2000 (see below).
Table 5. Population elasticities of educational groups.
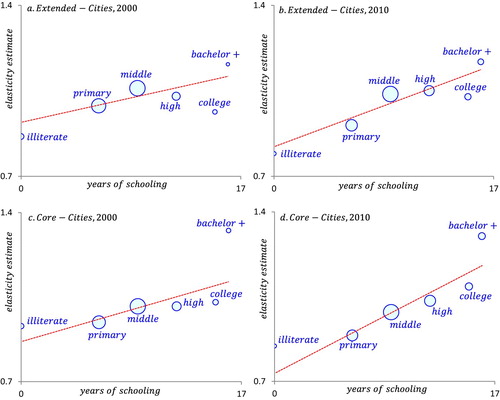
To illustrate our findings we graph the population elasticities of the six educational groups listed in relative to the corresponding educational levels in both years in . The size of the bubble is proportional to the population share of that education level. The diagrams display a regression line (weighted by population shares) for the estimated elasticities relative to the years of schooling. Note, that summarizes the type of information depicted in for all education-skill levels. For example, in the slope for bachelor degree education is steeper than for illiterates. The value of the slope – the elasticity – for a particular skill level in corresponds to a ‘bubble’ in ; the slope for bachelor degree education is the bubble indicated by ‘bachelor’ whereas the slope for illiterates is the bubbles indicated by ‘illiterates.’ thus shows the value of the elasticity on the vertical axis, and the skill level (in years of schooling) on the horizontal axis. shows that higher skill levels are characterized by higher population elasticities, in line with Hypothesis 1. The fit improves over time and the trendlines are steeper in 2010 than in 2000. Note that the elasticities for Bachelor are positive outliers at the Core-Cities level in both years, implying that people with the highest education levels choose to live in larger cities.
Figure 6. Education population elasticities and skill intensity (in years of schooling). The size of the bubble measures the size of each educational level; the fitted lines are weighted by population shares; the vertical axis does not start at zero; see for categories.
provides a summary of the hypothesis that the estimated elasticities rise with higher education levels. We distinguish between two types of tests.
Table 6. Hypothesis 1 elasticity test: large locations are more education-skill intensive.
(a) portrays the results of what we call a weak test, where we conclude that the hypothesis is rejected if the elasticity of a higher skill level is significantly lower than of a lower skill level (at the 5% level). Note that we can compare the elasticities of six education levels in different ways. The table reports both the number of rejections and the percent of rejections. This test performs excellent for Core-Cities (with no rejections at all) and for the year 2010 (with zero rejections for both Core-Cities and Extended-Cities). The test performs reasonably well for Extended-Cities in 2000, with 13% rejections.
(b) portrays the results of what we call a strong test, where we conclude that the hypothesis is confirmed if the elasticity of a higher skill level is significantly higher than of a lower skill level (at the 5% level). The table reports both the number of confirmations and the percent of confirmations. This test performs well for Extended-Cities and Core-Cities in the year 2010, with 80% and 93% confirmations, respectively. It performs reasonably-well in the year 2000, with 60% and 47% confirmations, respectively.
Before we compare our education results to those of Dingel, Miscio, and Davis (Citationforthcoming, DMD), we make two remarks. First, we identify six educational attainments, while DMD identify four categories since they group together our categories ‘illiterate’ and ‘primary school’ into one category ‘primary school or less’ and similarly for our categories ‘college’ and ‘bachelor or more’ into one category ‘college or university’. Second, DMD only analyze the elasticity estimates in 2000, while we have information for both 2000 and 2010, so that we can track developments over time.
Keeping this in mind, when we focus on the estimated elasticities in 2000 only, DMD emphasize that the education elasticity estimates for their preferred township nighttime light data fully meets the sorting criteria (rises for higher levels of education). In line with their finding, for our preferred Core-City data the estimated elasticities fully meet the sorting criteria. Moreover, at the extreme education levels we provide more detail since (i) the estimated elasticity for illiterates is lowest and (ii) DMD's highest elasticity of about 1.3 for ‘college or university’ can be largely attributed to ‘or university’ in view of our estimate of about 1.3 for ‘bachelor or more’. More importantly, from a dynamic perspective we show that the sorting power rises over time as the estimated elasticities for low education levels tends to fall and for high education levels tends to rise, both for Core-Cities and Extended-Cities.
We conclude from that the elasticity tests perform better in 2010 than in 2000 and more strongly for Core-Cities than for Extended-Cities.
B. Pairwise comparison test for education
Next, we focus on the pairwise comparison test regarding location size and education skills.
We use an example to illustrate the non-parametric pairwise comparison test. Suppose we have empirical information on the distribution of 4 education types (ranked according to skills) across 40 cities (ranked according to size). We can then directly compare any two arbitrary cities and the associated two education types to see whether inequality (2) holds. If so, we verify that the larger city in this pairwise comparison has relatively more high-skill education. We call the comparison a ‘success’ if the condition holds (value = 1) and a ‘failure’ if not (value = 0). We can compare 40 cities in different pairs, and each city pair has 4 education types giving
different skill combinations for each pair of cities. This gives a total of
pairwise comparisons. For each comparison we find either a ‘success’ or ‘failure.’ The extent to which the average success rate exceeds the random distribution benchmark of 0.5 (compared to the flip of a coin) can then be taken as an indication regarding the sorting-predictive power of the model.
We expect that the comparison between a very large city (such as Shanghai with 23 million people) and a much smaller city (such as Wuhai in Inner Mongolia with 0.5 million people) is more revealing to test the prediction of the model than a comparison between two similar-sized cities, such as Wuhai (532,902 persons) and Nujiang (534,337 persons). In this case the test outcome might be a random result. We therefore also report ‘weighted’ success rates, where we use the difference in log population for a city pair as weight. We consider the weighted success to be the most relevant.
Moreover, we do not have to restrict ourselves to comparing individual cities. We can also compare groups of cities that are allocated to ‘bins’ of different size. Suppose we have two distinct groups of cities and
with the smallest city in
being bigger than the biggest city in
and two skill types with
. Inequality (2’) then also holds for the bin:
(2′)
(2′)
This inequality implies that if the cities are grouped into a series of bins ordered by city size, then in any pairwise comparison of two bins and two skills the bin containing the larger cities has relatively more of the high-skilled education. When we create 2 bins we have just 1 comparison (the groups containing the largest cities versus the group containing the smallest cities). When we create 4 bins we have 6 comparisons, and so on. In the analysis below we divide the cities into 2, 4, 10, 30, 90, and individual bins.Footnote20 If
is the number of bins and
is the number of skills (education / sectors / occupations) the total number of pairwise comparisons is thus
. We report both the unweighted and weighted success rate of the pairwise comparisons per bin.Footnote21
Since we analyze 2, 4, 10, 30, and 90 bins as well as 296 individual locations for 6 different skill categories, we make 722,280 bilateral comparisons for each location type for each year. The results are summarized in both regarding the unweighted and weighted success rate of the pairwise comparison tests (consisting in total of about 4.3 million bilateral comparisons).
Figure 7. Pairwise comparison of six educational attainment levels. The bins are 2; 4; 10; 30; 90; individual; the associated number of pairs are 15; 90; 675; 6525; 60,075; at least 548,775; the dashed lines indicate the upper and lower limits of a 95% confidence interval of tossing a fair coin; the interval is exact up to 15 pairs and based on the Central Limit Theorem otherwise; each panel is based on more than one million bilateral comparisons, the whole figure on about five million bilateral comparisons. Note if the condition holds; value = 1 and if not; value = 0; if the outcome would be random the average value would be 0.5.
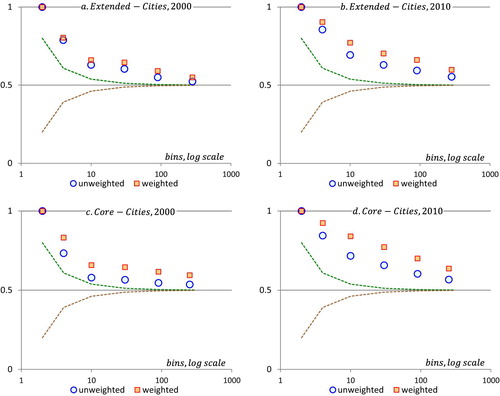
Consistent with the hypotheses, the success rates of these comparisons are significant and higher in 2010 than in 2000 for both types of locations (the dashed lines indicate 95% confidence intervals of tossing a fair coin; the random outcome). As with the elasticities test, the geographic differences are clear. The success rate is highest for Core-Cities. It is also clear that the success rate of the pairwise comparison tests improves if we lump cities together in bigger groups (and thus a lower number of bins). The smallest groups of individual cities have a weighted success rate ranging from a minimum of close to 50% (for Extended-Cities in 2000) to above 60% (for Core-Cities in 2010). In contrast, the success rate when we have only two bins (containing half of the sample per bin) is 100%. The weighted success rates are higher than the unweighted ones, indicating that the comparison test is more likely to hold if the difference in the size of the populations of the compared locations is big. Note that the gap between the weighted and unweighted results is larger for Core-Cities than for Extended-Cities.
Our findings above suggest that the model works quite well regarding the sorting of education skills in bigger cities. The tests perform better as we go from Extended-Cities to Core-Cities level. In addition, the tests perform better in 2010 than in 2000. We take this as an indication of China's move over time to a more market-oriented economy allowing for greater labor mobility and specialization.Footnote22
5.2 Larger cities specialize in high skill-intensive sectors and occupations
In this subsection, we tests whether larger cities are more specialized in high skill-intensive sectors and occupations in 2000 and 2010. First, we estimate the sector- and occupation population elasticities for the elasticity test. Second, we use the pairwise comparisons test to identify the spatial patterns of sector- and occupation employment. We include the agricultural sector in the analysis. Some agricultural workers can be employed in cities, but not necessarily in agricultural employment, but also in jobs such as ‘equipment operator’, ‘business service personnel’, or ‘production and transport related workers.’ According to Chan and Buckingham (Citation2008, 583), in general, in jobs, ‘that are considered dirty, dangerous, or low-paying’, but are part of the urban workforce.
A. Elasticity test for sectors and occupations
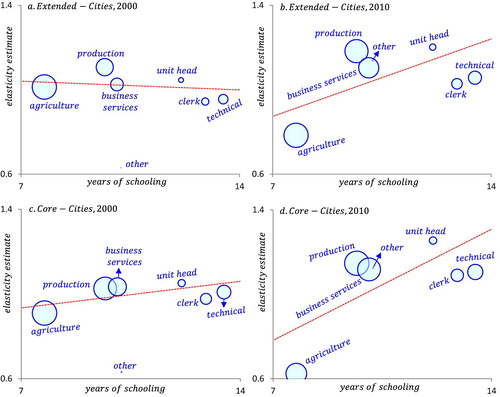
We start with the elasticity test for sectorial employment. plots the 15 and 19 sector population elasticities against their corresponding skill intensities in 2000 and 2010. In general, the sector composition, measured by the size of the bubbles, shows that manufacturing becomes more important for over time.Footnote23 Also note that the sector Business Services, which was absent in the sector categories in 2000, accounts for the largest proportion of total employment in Core-Cities in 2010.
Figure 8. Sector population elasticities and skill intensities. The size of the bubble measures the size of sectors; the fitted lines are weighted by population shares; the vertical axis does not start at zero.
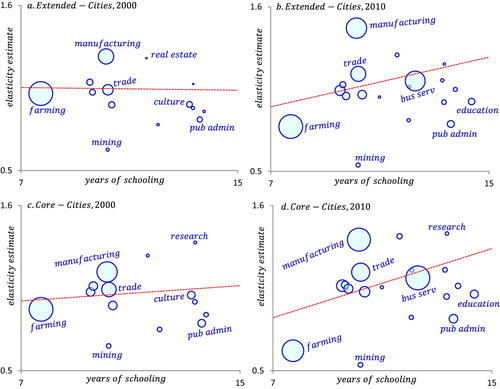
The elasticity test for sectors performs badly in 2000. The fitted line is horizontal (see a). Real Estate and Research have high elasticities, while Mining, Public Utilities, Utilities, Public Health, Public Administration, and Banking have low elasticities relative to the average schooling levels. The elasticity test for sectors improves by 2010. All fitted lines have a positive slope, indicating that in 2010 large locations house relatively more skill-intensive sectors (see b and d). The estimated elasticity for low-skilled Farming falls considerably for all location types, particularly for Core-Cities. Perhaps this reflects the decline of hidden unemployment in rural areas.
A summary of the formal tests of the comparison of the various estimated elasticities is reported in , which again distinguishes between the weak test and the strong test and reports the number of rejections and confirmations, as well as their percentages. Since there are 15 sectors in 2000 and 19 in 2010, we have 105 elasticity comparisons in 2000 and 171 in 2010. The number of rejections of the weak test is considerable in all cases, ranging from 36% to 49% and there is no improvement over time. The number of confirmations of the strong test is modest ranging from 23% to 44%, although there is some improvement as we go from 2000 to 2010 for both location types. Also note that the highest scoring confirmation at the sector level is for Core-Cities in 2010 (44%), which at the same time has a substantial number of rejections as well (36%). Based on this summary, one would be tempted to conclude that the sector composition of skills is too diversified to result in clear sorting of high-skilled sectors in bigger locations.
Table 7. Hypothesis 1 elasticity test: large locations have more skill intensive sectors/occupations.
Our data identifies only seven occupation categories. The estimated population elasticities are plotted in relative to the average number of years of schooling in 2000 and 2010, with the size of the bubbles proportional to the number of people working in a particular occupation. As with the sector analysis, the slope of the fitted lines for the elasticities of occupations is basically horizontal in 2000 for Extended-Cities. As with the sector analysis, the predictions perform better in 2010. Also, the estimated elasticity of Agriculture as an occupation declined substantially in 2010. In contrast to the sector analysis, however, a visual inspection suggests that the overall performance of the elasticity test seems to be quite acceptable by 2010, which is confirmed by the formal analysis discussed next.
Figure 9. Occupation population elasticities and skill intensities. The size of the bubble measures the size of occupations; the fitted lines are weighted by population shares; the vertical axis does not start at zero; technical = technical personnel.
The occupation part of summarizes the weak and strong versions of the formal elasticity tests. Since there are 7 occupations in both years the number of bilateral comparisons is 21. The number of rejections of the weak test ranges from 10% to 52%. The performance improves over time. It is reasonable for Core-Cities and weaker for Extended-Cities. The number of confirmations of the strong test ranges from 14% to 38%. The performance improves over time for both location types and is reasonably high for both Extended-Cities and Core-Cities by 2010 (namely 33% and 38%, respectively). We conclude that the sorting of high-skill occupations in bigger locations is more or less confirmed for Core-Cities (certainly by 2010), but not impressive for Extended-Cities.
B. Pairwise comparison test for sectors and occupations
We next turn to the results of the pairwise comparison test for sectors and occupations, see (see Figure B10 in Appendix B, available upon request, for the results with respect to Prefectures). Since we have 7 different occupations, each figure for occupations is based on about 1 million bilateral comparisons. Since we have 15 sectors in 2000 and 19 sectors in 2010, each figure for sectors is based on about 5 million bilateral comparisons in 2000 and 8.2 million in 2010.
Figure 10. Pairwise comparison of sectors and occupations for Cities. The bins are 2; 4; 10; 30; 90; individual; the associated number of pairs for occupations are 21; 126; 945; 9135; 84,105; at least 658,875; the associated number of pairs for sectors are 171; 1026; 7695; 74,3855; 684,855; at least 3.3 million; the dashed lines indicate the upper and lower limits of a 95% confidence interval of tossing a fair coin; the interval is exact for 21 pairs and based on the Central Limit Theorem otherwise; each panel is based on more than 1.5 million bilateral comparisons, the whole figure on 25.5 million bilateral comparisons; there are 15 sectors in 2000 and 19 sectors in 2010; there are 7 sectors in both years. Note if the condition holds; value = 1 and if not; value = 0; if the outcome would be random the average value would be 0.5.
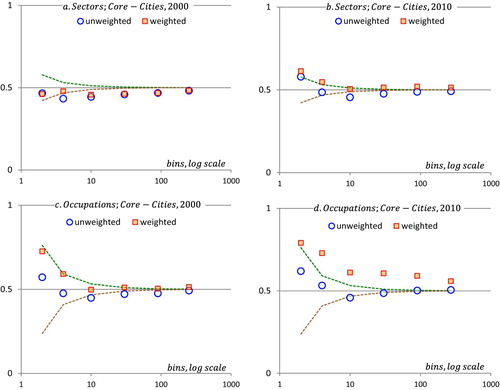
In general, both for sectors and occupations, the results are less pronounced than for education skills. At the sector level, the success rate of the bilateral comparisons improves from 2000 to 2010 for Core-Cities and are significantly different from a random result. The best results are for occupations in Core-Cities, as (d) illustrates. This holds in particular for the weighted values. This confirms our earlier analysis that performance improves over time, is better for more consistently defined locations (Core-Cities), and that the model is more appropriate for occupations than for sectors.
To summarize, we find some evidence that larger Core-Cities in China have become relatively more specialized in skill-intensive sectors and occupations. This change may be indicative of the more market-oriented economic development accompanied by more labor mobility and rapid urbanization from 2000 to 2010. This transition is illustrated by the improvement in predictive power over time of the model as tested in this section. Our conclusions are not affected by sensitivity tests related to definitions of spatial units, sectors, or the inclusion of peripheral units.Footnote24
6. Conclusion
The traditional literature on China indicates that the concentration of economic activities is lower in China than in other industrialized countries. Institutional limits to internal migration, such as the Hukou system, are largely held responsible for this finding. Cities in China are, however, transforming rapidly. Urbanization is rising and millions of new jobs are created in urban areas.
Dense areas and big cities are more productive than smaller cities and the question arises whether also in China, as in advanced economies, more productive workers and firms sort into bigger cities. This is the main question answered in this paper. We empirically test if there is relative sorting of higher skills incorporated in education, sectors, and occupations in larger cities. As institutional restrictions, such as the Hukou system, are becoming less restrictive we expect that this sorting process improves over time.
Our analysis is based on two types of tests, namely a population elasticity test and a pairwise comparison test, developed by Davis and Dingel (Citation2020). We do this for two types of Chinese locations (Extended-Cities and Core-Cities) and for three types of incorporated skills (in education, occupations, and sectors) in 2000 and 2010. The elasticity test holds if the estimated population elasticity is higher for higher skills. The pairwise comparison test holds if the larger location is relatively more skill abundant if we compare two (groups of) locations. In all cases, the results found by the elasticity test are in line with the results found by the pairwise comparison test. Our main findings can be summarized as follows.
The predictive power of the sorting model is higher for Core-Cities than for Extended-Cities.
The predictive power of the sorting model is highest for education skills, followed by occupation skills and sector skills, respectively. Note that – because of data availability – we have no information on possible within industry skill-sorting.
The predictive power of the sorting model improves over time, especially for Core-Cities.
Our results confirm that in China a similar sorting process of skills across cities takes place as in advanced economies, which becomes stronger over time. A possible interpretation is that the liberalization of the Hukou system in combination with agricultural reforms and investments in infrastructure stimulate rural–urban migration. Our results also indicate that care should be given regarding the type of location analyzed as the sorting model works better for more coherently defined locations (Core-Cities) than for more heterogeneous areas (Extended-Cities). Furthermore, the results indicate that the sorting model works best when skill levels are measured as directly as possible, which explains the sorting power of education skills, relative to occupation skills, and sector skills.
Disclosure statement
No potential conflict of interest was reported by the author(s).
Notes
1 For an in-depth survey on China's economic history, see Brandt, Ma, and Rawski (Citation2014).
2 The Hukou system, which is unique for China, is a visa system that regulates rural–urban migration and the sector of employment. For a description what it (still) implies in practice, see Chan and Buckingham (Citation2008), The Economist (Citation2010), or Han and Li (Citation2017) from which it is clear that restrictions are present and restrict migration (see also Bosker et al. Citation2012). The Chinese government is currently taking measures to relax the Hukou system (Su, Tesfazion, and Zhao Citation2018). Other institutional limitations related to economic planning might also interfere with market forces.
3 A large literature exists that illustrate these developments: Zhu and Luo Citation2010; Zhang and Song Citation2003; Du, Park, and Wang Citation2005; Chen, Jin, and Yue Citation2010; Knight and Gunatilaka Citation2010; Bosker et al. Citation2012; Jiang, Lu, and Sato Citation2012; Combes, Démurger, and Li Citation2013; Su, Tesfazion, and Zhao Citation2018.
4 The two lowest education levels (illiterate and primary schooling) have (strongly) declining shares, not related to initial population size.
5 Note, that we do not discuss skill productivity and skill complementarity as in Eeckhout, Pinheiro, and Schmidheiny (Citation2014). This complementarity largely explains the urban wage premia for high-skilled workers. In line with their results, we find evidence of a disproportionally large share of high skills in large cities, but do not find evidence of a disproportionally high share of low(est) skills in large Chinese cities.
6 Levels 4 and 5 are the township level and the village level.
7 Baum-Snow et al. (Citation2017) analyze changes in spatial definitions over the 1990–2010 period in detail and observe changes in the definitions over time (for example, some cities did not exist as a city in 1990, but were defined as such for planning reasons). To deal with this they introduce a ‘constant boundary central city’ for consistency purposes. We, instead, use the official statistical boundaries. The potential bias in our results is limited because (i) changes in spatial definitions between 2000–2010 (our sample) are less pronounced than in the 1990–2010 period (Baum-Snow et al., 2017), (ii) we do not compare changes of individual cities over time on a one-to-one basis (but compare distributions), and (iii) we do not use – in line with Baum-Snow et al. – the entire prefecture as the ‘city’ definition.
8 There are four municipalities in China at the provincial level (Shanghai, Beijing, Tianjin, and Chongqing). These four are also classified as Prefecture.
9 Some county-level divisions are administrated by their provinces directly. In that case, the information of the divisions is excluded from the statistic of the prefectural levels. The population share of these county-level divisions is about 1.7%, which explains why coverage is not 100% of total population.
10 Appendix B (available upon request) provides a sensitivity analysis with respect to administrative spatial changes.
11 Occupations are determined by specific skills, training and qualifications for work. These can be put to use in various sectors. So different sectors can be home to the same occupation, and vice versa.
12 In 2000, there were two additional educational groups, literacy class and technical school. We do not include them in this table since they are excluded in 2010. The data on educational attainment only includes the population of at least six year old persons.
13 The third education level is stable for Extended-Cities, and falling for Core-Cities.
14 The population of a location consists of both registered residents and non-registered residents living there continuously for at least 5 years.
15 We drop the sector International organizations because it has almost zero employment.
16 There is no educational information about sectors and occupations in 2000. Therefore, we order the skill intensity of sectors and occupations only based on the information available in 2010.
17 Labeled ‘Urban’, in the left-hand panel of . We also have a Total category that describes the skill intensity of the total employment. In some of the Region estimates we use this ordering (see Appendix B, available upon request).
18 Years of schooling = , where
is the educational attainment,
denotes the sector or occupation,
denotes the years of schooling of each educational attainment, and
denotes the share of the educational attainment
in the sector or occupation
.
19 Appendix B (available upon request) provides more details (under the heading ‘paper’ for the locations in the provinces analyzed in Section 5 and the heading ‘all’ if all locations in all provinces are included). Our selection largely coincides with locations east of the Hu Line (from Heihe to Tengchong), except for Gansu and Ningxia.
20 Individual bins consist of one city per bin.
21 We use the difference of the log of the average population in a bin as weight.
22 Similar, but somewhat weaker, results hold when we analyze all locations (including the remote provinces Xinjiang, Tibet, Qinghai, and Inner Mongolia), see Appendix B (available upon request).
23 This is consistent with the findings of Brakman, Garretsen, and Zhao (Citation2016), who argue that localization of firms increase over time, suggesting that firms increasingly benefit from agglomeration economies in cities.
24 Appendix B (available upon request) gives information on the sensitivity tests.
References
- Au, C.-C., and J. V. Henderson. 2006a. “Are Chinese Cities Too Small?” Review of Economic Studies 73: 549–576.
- Au, C.-C., and J. V. Henderson. 2006b. “How Migration Restrictions Limit Agglomeration and Productivity in China.” Journal of Development Economics 80: 350–388.
- Baum-Snow, N., L. Brandt, J. V. Henderson, M. A. Turner, and Q. Zhang. 2017. “Roads, Railroads and Decentralization of Chinese Cities.” Review of Economics and Statistics 99: 435–458.
- Behrens, K., G. Duranton, and F. Robert-Nicoud. 2014. “Productive Cities, Sorting, Selection, and Agglomeration.” Journal of Political Economy 122: 507–553.
- Bosker, M., S. Brakman, H. Garretsen, and M. Schramm. 2012. “Relaxing Hukou: Increased Labor Mobility and China's Economic Geography.” Journal of Urban Economics 72: 252–266.
- Brakman, S., H. Garretsen, and Z. Zhao. 2016. “Spatial Concentration of Manufacturing Firms in China.” Papers in Regional Science 96: 179–205.
- Brakman, S., H. Garretsen, and C. van Marrewijk. 2016. “Urban Development in China.” Cambridge Journal of Regions, Economy, and Society 9: 467–477.
- Brakman, S., H. Garretsen, and C. van Marrewijk. 2020. An Introduction to Geographical and Urban Economics: A Spiky World. Cambridge: Cambridge University Press.
- Brandt, L., D. Ma, and T. G. Rawski. 2014. “From Divergence to Convergence: Reevaluating the History Behind China’s Economic Boom.” Journal of Economic Literature 52: 45–123.
- Chan, K.-W., and W. Buckingham. 2008. “Is China Abolishing the Hukou System?” The China Quarterly 195: 582–606.
- Chen, Y., G. Z. Jin, and Y. Yue. 2010. Peer Migration in China. NBER Working Paper Series, 15671, Cambridge, MA.
- Chen, A., and M. D. Partridge. 2013. “When are Cities Engines of Growth in China? Spread and Backwash Effects Across Urban Hierarchy.” Regional Studies 47: 1313–1331.
- Combes, P.-P., G. Duranton, L. Gobillon, D. Puga, and S. Roux. 2012. “The Productivity Advantages of Large Cities: Distinguishing Agglomeration from Firm Selection.” Econometrica 80: 2543–2593.
- Combes, P.-P., S. Démurger, and S. Li. 2013. Urbanisation and Migration Externalities in China, CEPR discussion Paper, No. 9352, London.
- Combes, P.-P., and D. Gobillon. 2015. “The Empirics of Agglomeration Economies.” In Handbook Regional and Urban Economics, Vol. 5A, edited by G. Duranton, J. V. Henderson, and W. Strange, 247–348. North-Holland: Elsevier.
- Davis, D. R. and Dingel, J. I. (2020). The Comparative Advantage of Cities, Journal of International Economics, Vol.123, pp. 1-27.
- Dingel, J. I., A. Miscio, and D. R. Davis. forthcoming. “Cities, Lights, and Skills in Developing Economies.” Journal of Urban Economics, https://doi.org/10.1016/j.jue.2019.05.005.
- Duranton, G., and H. G. Overman. 2005. “Testing for Localization Using Micro-Geographic Data.” The Review of Economic Studies 72: 1077–1106.
- Duranton, G., and H. G. Overman. 2008. “Exploring the Detailed Location Patterns of U.K. Manufacturing Industries Using Microgeographic Data.” Journal of Regional Science 48: 213–243.
- Duranton, G., and H. Jayet. 2011. “Is the Division of Labor Limited by the Extent of the Market? Evidence from French Cities.” Journal of Urban Economics 69: 56–71.
- Du, Y., A. Park, and S. Wang. 2005. “Migration and Rural Poverty in China.” Journal of Comparative Economics 33: 688–709.
- Eeckhout, J., R. Pinheiro, and K. Schmidheiny. 2014. “Spatial Sorting.” Journal of Political Economy 122: 554–620.
- Fujita, M., T. Mori, J. V. Henderson, and Y. Kanemoto. 2004. “The Spatial Distribution of Economic Activities in Japan and China.” In Handbook of Regional and Urban Economics, Vol.4, edited by J. V. Henderson, and J.-F. Thisse, 2911–2977. Amsterdam: Elsevier North Holland.
- Gabaix, X., and R. Ibragimov. 2011. “Rank-1/2: A Simple Way to Improve the OLS Estimation of Tail Exponents.” Journal of Business & Economic Statistics 29: 24–39.
- Glaeser, E. L. 1999. “Learning in Cities.” Journal of Urban Economics 46: 254–277.
- Glaeser, E. L., and M. G. Resseger. 2010. “The Complementarity Between Cities and Skills.” Journal of Regional Science 50: 221–244.
- Han, J., and S. Li. 2017. “Internal Migration and External Benefit: the Impact of Labor Migration on the Wage Structure in Urban China.” China Economic Review 46: 67–86.
- Henderson, J. V. 1974. “The Sizes and Types of Cities.” The American Economic Review 64: 640–656.
- Henderson, J. V. 1983. “Industrial Bases and City Sizes.” American Economic Review 73: 164–168.
- Henderson, J. V. 1997. “Medium Size Cities.” Regional Science and Urban Economics 27: 583–612.
- Holmes, T. J., and J. J. Stevens. 2004. “Spatial Distribution of Economic Activities in North America.” In Handbook of Regional and Urban Economics, Vol.4, edited by J. V. Henderson, and J.-F. Thisse, 2797–2843. Amsterdam: Elsevier North Holland.
- Jiang, S., M. Lu, and H. Sato. 2012. “Identity, Inequality, and Happiness: Evidence from Urban China.” World Development 40: 1190–1200.
- Knight, J., and R. Gunatilaka. 2010. “Great Expectations? The Subjective Well-Being of Rural–Urban Migrants in China.” World Development 38: 113–124.
- Lu, J., and Z. Tao. 2009. “Trends and Determinants of China’s Industrial Agglomeration.” Journal of Urban Economics 65: 167–180.
- Mori, T., and A. Turrini. 2005. “Skills, Agglomeration and Segmentation.” European Economic Review 49: 201–225.
- Rosenthal, S. S., and W. Strange. 2004. “Evidence on the Nature and Sources of Agglomeration Economies.” In Handbook of Regional and Urban Economics, Vol.4, edited by J. V. Henderson, and J.-F. Thisse, 2119–2171. Amsterdam: Elsevier North Holland.
- Sattinger, M. 1978. “Comparative Advantage in Individuals.” Review of Economics and Statististics 60: 259–267.
- Sattinger, M. 1993. “Assignment Models of the Distribution of Earnings.” Journal of Economic Literature 31: 831–880.
- Su, Y., P. Tesfazion, and Z. Zhao. 2018. “Where Are the Migrants from? Inter- vs Intra-Provincial Rural-Urban Migration in China.” China Economic Review 47: 142–155.
- The Economist. 2010. Migration in China: Invisible and Heavy Shackles. May 6, 2010.
- Yang, Z., and M. Dunford. 2018. “City Shrinkage in China: Scalar Processes of Urban and Hulou Population Losses.” Regional Studies 52: 1111–1121.
- Zhang, K. H., and S. Song. 2003. “Rural–Urban Migration and Urbanization in China: Evidence from Time-Series and Cross-Section Analyses.” China Economic Review 14: 386–400.
- Zhu, N., and X. Luo. 2010. “The Impact of Migration on Rural Poverty and Inequality: a Case Study in China.” Agricultural Economics 41: 191–204.
Appendix A. Description of sectors and occupations.
Table A1. Full name and short name of sector and occupation.