?Mathematical formulae have been encoded as MathML and are displayed in this HTML version using MathJax in order to improve their display. Uncheck the box to turn MathJax off. This feature requires Javascript. Click on a formula to zoom.
Abstract
This paper examines the asymmetric responses of renewable energy (RE) technology to globalization and economic growth shocks across the G7 countries using the Nonlinear Cointegrating Auto-Regressive Distributed Lag (NARDL) model. Our results indicate asymmetries across these countries and that positive shocks on globalization increase RE in Canada, Germany, the United Kingdom (UK), and the United States (US) while negative shocks decrease RE. However, both positive and negative globalization shocks promote RE consumption in Italy and Japan but decrease it in France. In contrast, both income shocks increase RE in France whilst positive income shocks increase RE in Canada, Germany, and Italy while negative shocks decrease RE. Positive income shock facilitates RE in the UK and the US while negative income shocks are detrimental to RE in Japan. Further analysis using panel cointegration, Fully Modified Ordinary Least Squares, and Panel Dynamic Ordinary Least Squares suggests that RE deployment in the G7 countries is mainly driven by positive shocks on income, globalization, and capital. We discuss the implications of the findings.
1. Introduction
In this paper, we examine the asymmetric effects of economic growth and economic, social and political globalization on renewable energy (RE) adoption among the G7 countries. Increases in temperature, changes in rainfall patterns, more humid winters and increased frequency and duration of extreme weather events associated with climate change are increasingly affecting societies around the world. The impacts of climate-related risks are becoming noticeable in many sectors including energy, agriculture, and healthcare. The rate and timing of climate change impacts, and actions to reduce them, vary across countries. However, reports from several countries are in agreement that risks caused by the changing climate are already becoming apparent today, as well as the countermeasures that address them successfully. Eckstein, Künzel, and Schäfer (Citation2021) present a straightforward and comparable set of climate change impact analyses across countries using the Global Climate Risk Index (CRI). This index which results from the interaction of vulnerability, exposure, and hazard, measures the differences in the magnitude of climate change risks across countries by quantifying the extent of fatalities and economic losses caused by extreme weather events.
With a global CRI rank of 18 for the period 2000–2019, Germany possesses the eighteenth highest climate risk in the world and the highest among the G7 economies. This implies that Germany was the most exposed and vulnerable to climate-related risks among the G7 economies over the past 20 years. This is closely followed by Italy and France with CRI of 22 and 27, respectively while Japan and the UK possess CRI of 57 and 58, respectively. Canada has a CRI rank of 93 while for the CRI for the US is not available at present. Taken together, these rankings suggest that the climate risks for the G7 economies appear not to have varied widely in the last 20 years, and that implementing improved mitigation strategies towards limiting global temperature increase is an absolute priority, especially in light of the reality that damages from climate risks are projected to increase over time. Therefore, climate risks possess the potential for extremely negative consequences in the coming decades if a new model of sustainable development through the transition to cleaner energy use, that emphasizes reduction in fossil energy consumption that increases greenhouse gas emissions, is not pursued.
One of the fundamental strategies introduced to reduce the adverse impact of emissions from fossil energy generation is the promotion of renewable energy (RE) technology. While the Kyoto Protocol to the United Nations Framework Convention on Climate Change, dealing with greenhouse-gas emissions mitigation was the first step towards the promotion of RE consumption at an international scale, it gave impetus to several other targets aimed at promoting RE technologies. For instance, the European Commission’s integrated proposal for climate action in 2008 sets a target of 20% RE and at least 10% share of biofuels in overall gasoline and diesel use in the transportation sector by 2020 in the European Union (Chang, Huang, and Lee Citation2009). In addition to its potential to mitigate
emissions, Menegaki (Citation2011) argues that RE use is free from depletion, secure, safe, and are suitable for rural underdeveloped areas where it may not be economically viable to build electricity distribution grids. Although RE use is potentially a cost-effective approach to mitigate climate change, the development of RE technologies faces some challenges. For instance, they require initial high costs, unfavourable pricing rules, adequate access to credit, transaction costs, skills, and environmental externalities (Beck and Martinot Citation2004). As far as these barriers are concerned, the development of massive RE technologies has the potential to lower economic activities through an increase in consumer prices because of higher energy costs.
However, the increasing levels of globalization have the potential to increase economic activities and promote the transition to RE technologies, especially in highly industrialized countries for several reasons. First, widespread adoption of RE use requires technological innovations which enables an increase in production and reduction in the unit cost of main RE energy forms including solar and wind (see e.g. Cheon and Urpelainen Citation2012; Bayer, Dolan, and Urpelainen Citation2013). Given the level of innovation required in RE production, highly industrialized countries have historically been the key sources of technological innovations in RE. Also, the growing cost of the adverse effect of steep increases in fossil-based energy prices provides sources of widespread deployment of RE through incentive policies which can be more easily handled by high-growth countries (Awerbuch and Sauter Citation2006; Chang, Huang, and Lee Citation2009). Even more, the high concentration of foreign direct investment (FDI) in high-growth countries which fundamentally entails the transfer of capital, knowledge, technology, sound management practices, and systems can also serve as a source of innovation that promotes efficiency in the deployment of RE technology. Following the New Trade Theory, such efficiency may be achieved through competition or direct transfer of knowledge (Doytch and Narayan Citation2016).
Furthermore, the link between globalization and RE deployment has also been established on the premise that RE is consumed domestically and serves the purpose of import substitution for fossil-based energy demand. Empirical evidence based on this premise demonstrates that RE use may hurt globalization (see e.g. Rahman and Miah Citation2017). On the contrary, there are flourishing recent empirical studies that document the positive impact of globalization on RE consumption using different measures of globalization. For instance, using different measures of economic globalization and estimation techniques, Gozgor et al. (Citation2020) examine the determinants of RE demand and found that economic growth and a higher level of economic globalization have positive effects on RE demand in a panel of 30 OECD countries. This finding is validated by the empirical studies which demonstrate that an increase in trade openness leads to a reduction in energy consumption by facilitating the availability of imported technology (see e.g. Ozturk and Acaravci Citation2013; Shahbaz et al. Citation2013).Footnote1
While extant studies have provided important insights on the nature of relationship between globalization and RE, these studies mostly use trade openness or FDI as empirical measures of globalization. While these indicators are informative, they only provide a limited view on globalization. Also, extant studies have to date assume linearity in the relationship between economic growth, globalization and RE adoption. Against this backdrop, utilizing a sample comprising G7 countries over the period from 1970 to 2015, we make two notable contributions to the literature. First, we examine the effects of globalization and economic growth shocks on RE use while accounting for the existing level of capital. To do so, we rely on a composite globalization index proposed by Dreher (Citation2006) which captures three sub-indices including economic globalization, social globalization, and political globalization. Unlike the conventional approach of using either trade openness or FDI as proxies of globalization, the composite index of globalization enables us to account for how the three main dimensions of globalization collectively impact the decision to switch from dirty to clean energy use. Particularly, economic globalization captures both trade linkages and financial flows between a country and its trading partners. An increase in the flow of goods across borders is expected to lead to an increase in energy consumption while foreign capital comes with expertise and innovation that may promote the transition to cleaner and safer energy sources.
Social globalization also entails an increase in the exchange of information and cultural proximity. The flow of information across borders has the potential to enlighten and facilitate the desire by a home country for improved practices existing in different sectors of other countries’ economy including the energy sector. This may lead to important steps towards restructuring the home country's energy policy, aiming at an extensive use of RE to reduce emissions. Lastly, political globalization represents a country's level of membership in international agreements and the presence of embassies. Given the growing concern about the impact of climate change and the various intergovernmental panels and agreements, it is expected that a more politically globalized country enlists in global agreements and groups to reduce climate change. Shahbaz, Nasir, and Roubaud (Citation2018) argue that given recent concern about environmental sustainability, the flow of information, regulatory frameworks, sanctions, and confidence built through membership of international organizations, countries that enlist in these organizations are more likely to join treaties aiming to address mutual interests such as climate change,
emissions. Even more, given that RE innovation is subject to environmental externalities, environmental agreements will contribute to productive investments in RE innovation by protecting property rights than a single country would do.
As a second contribution to the literature, we deviate from previous studies that assume a symmetric effect of globalization and economic growth on RE. Particularly, we argue that variations in the level of globalization and growth do not necessarily have a similar impact on the use of RE or vice-versa. To this end, we employ the nonlinear autoregressive distributed lag (NARDL) approach proposed by Shin, Yu, and Greenwood-Nimmo (Citation2014) to explore the short-run and long-run asymmetries in the dynamic relationship between globalization, economic growth shocks, and RE. Along this line, our study is related to Shahbaz, Nasir, and Roubaud (Citation2018) in terms of empirical methodology but differs in two aspects. While Shahbaz et al. (Citation2018) focus on total energy consumption in the BRICS, our paper takes a closer look at the effect of globalization and economic growth on the share of RE in total energy consumption in highly industrialized (G7) countries. To our best knowledge, this is the first paper that uses both a composite index of globalization and an asymmetric framework in the analysis of the effect of globalization on the transition to RE technologies in the G7 countries. Lastly, unlike Shahbaz, Nasir, and Roubaud (Citation2018) we offer a further analysis in which we use panel cointegration to offer a summary of the above country-specific estimations of the response of RE to shocks on globalization and economic growth. To do this, we rely on both the Fisher–Johansen and Pedroni panel cointegration tests, FMOLS, and PDOLS that enable us to account for cointegration, endogeneity, heterogeneity, and cross-sectional dependencies. We follow previous studies such as Nusair (Citation2016) to extract the decomposed partials sums of globalization, economic growth, and capital formation which corresponds to positive and negative shocks for all the countries. This particular objective is premised on the fact that these countries share common features including a similar level of globalization, economic growth, and are heavy energy consumers. Hence, it is expected that changes in these features exert significantly similar effects on the deployment of RE technologies and that a panel test has the potential to reveal generalized insightful results about the RE deployment across the G7 countries.
Our results may be previewed as follows. We show evidence of asymmetric cointegration among RE consumption, globalization, output growth, and capital across the G7 countries. Estimates from the NARDL models show that the impact of globalization on RE is heterogeneous across the G7 countries. Specifically, shocks on globalization increase (decrease) RE in Canada, Germany, the United Kingdom, and the United States. However, they promote RE in Italy and Japan but decrease it in France. In contrast, both income shocks increase RE in France but increase (decrease) it in Canada, Germany, and Italy. Positive income shock facilitates RE in the United Kingdom and the United States while negative income shock is detrimental to RE in Japan. The positive shock on capital is favourable to RE in all the countries except in the United States. Negative capital shock is detrimental to RE in France, Italy, and the United States but favourable in Canada and Japan. Our further analysis reveals a panel cointegration relationship among RE and nonlinear definitions of the regressors across the G7 countries. Results from both the FMOLS and PDOLS show that RE deployment in the G7 countries is mainly driven by positive shocks on income, globalization, and then, the capital.
The remainder of this paper unfolds as follows. The next section presents the methodological framework. Results are presented and discussed in Section 3 while Section 4 contains our conclusion and policy implications.
2. Methodological framework
2.1. The empirical model and data
To examine the association between globalization and RE technology by accounting for the roles of economic growth and investment as potential drivers of the transition to RE in high-income countries, this study follows Shahbaz, Nasir, and Roubaud (Citation2018) to specify the following RE demand function:
(1)
(1) We transform all the variables by taking natural logarithms to reduce the risk of heteroskedasticity.
The resulting empirical model of our RE demand function may be represented as follows:
(2)
(2) where ln and t denote natural log and time respectively and β1–β3 are the parameters to be estimated. Ct is RE consumption as a percentage of total energy use;
represents globalization index taken from Dreher (Citation2006);
denotes economic growth as defined by real GDP per capita in US$;
is capital taken as the real gross fixed capital formation in US$ while
represents the disturbance term which is assumed to follow a normal distribution with zero mean and unit variance.
Our analysis consists of G7 countries including Canada, France, Germany, Italy, Japan, the UK, and the USA, and our study period is from 1970 to 2015. The data on RE as well as real GDP per capita and gross fixed capital formation (in constant 2010 US$) were sourced from the World Development Indicators (WDI) of the World Bank. We use the composite globalization index of Dreher (Citation2006). Following previous studies, we use data on RE as a percentage of aggregate energy which is directly available in the WDI database (see. e.g. Paramati, Apergis, and Ummalla Citation2017; Yao et al. Citation2019). Specifically, RE is described as ‘non-carbohydrate energy that does not produce carbon dioxide when generated’. This comprises hydropower and nuclear, geothermal, and solar power, among others. Figure shows the percentage shares of dirty and RE as total energy use for each of the countries while Figure (A–C) presents the globalization index, real GDP per capita, and capital stock over the study period.
Figure 1. Trend of dirty and clean energy consumption as percentage of total energy use.
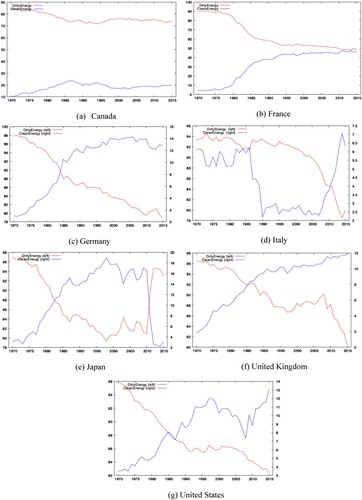
Figure 2. Plots of globalization index, growth per capita and capital stock for the G7 countries.
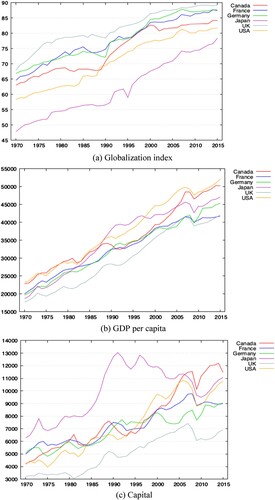
The plots show that whereas dirty energy maintains a large share of the total energy used, RE use has increased steadily over the sample period in Canada, Germany, the UK, and the USA. The share of both energy types was equal in 2010 but from 2014, RE in France appears to have become greater. There is an upward trend in globalization, growth, and capital stock over the study period. In particular, the globalization index is highest in the UK but least in Japan. Real GDP is highest in the USA but least in Italy whereas capital stock is highest in Canada but least in Italy.
2.2. The NARDL bounds testing approach to cointegration
Following previous studies such as Shahbaz et al. (Citation2018), Tariq et al. (Citation2019), and Dhaoui, Chevallier, and Ma (Citation2020), we examine the asymmetry in the long and short-run adjustments in RE to positive and negative shocks in globalization, growth, and capital by applying the NARDL model proposed by Shin, Yu, and Greenwood-Nimmo (Citation2014). This model extends the popularly known ARDL model of Pesaran and Shin (Citation1998) and Pesaran, Shin, and Smith (Citation2001) by developing a flexible dynamic parametric approach to model economic relationships that exhibit combined-long run and short-run asymmetries. The choice of this approach is motivated by previous studies that have found evidence that the assumption of linearity limits the opportunity to unravel potential dynamic asymmetries that exist among variables whereby positive and negative shock exhibit differential effects on a dependent variable (see e.g. Lee Citation2000; Viren Citation2001; Bachmeier and Griffin Citation2003). To this end, the functional form of asymmetric long-run relationship may be stated as follows:
(3)
(3) where
and
denote the long-run parameters while the series
is a
vector of decomposed regressors as follows:
(4)
(4) where the positive
and
negative partial sum processes which distinguish between positive and negative change in
may be defined as
(5)
(5)
Following Shin et al. (Citation2014), the nonlinear ARDL model based on the cumulative positive and negative sums in the traditional ARDL() model of Pesaran, Shin, and Smith (Citation2001) may be stated as follows:
(6)
(6) where
represents the autoregressive parameter,
and
are the asymmetrically distributed lag parameters while
is the normally distributed error term with zero mean and constant variance. Following Shin, Yu, and Greenwood-Nimmo (Citation2014), equation (6) may be rewritten as an asymmetric error correction form as
(7)
(7) where
for
.
and
are the associated asymmetric long-run parameters. Shahbaz, Nasir, and Roubaud (Citation2018) note that the estimation procedure of NARDL is similar to the linear ARDL model. It proceeds with the estimation of the conditional nonlinear Error Correction Model (ECM) as stated in equation (7) using the conventional ordinary least square (OLS) regression before examining the presence of long-run relationships between the variables using the modified F-test with the bounds testing procedure proposed by Pesaran, Shin, and Smith (Citation2001) (i.e. the joint null hypothesis:
). The bounds testing for this study is carried out in line with Shin, Yu, and Greenwood-Nimmo (Citation2014) by using both the F-statistics (
), and
-statistics (
) proposed by Banerjee, Dolado, and Mestre (Citation1998). Further, we utilize the Wald test to examine the existence of long-run (
) and short-run asymmetries denoted by (i)
or (ii)
The Wald test F-statistics is compared to the upper bound value propose by Pesaran, Shin, and Smith (Citation2001).
In the last step, we follow previous studies to examine the short-run and long-run asymmetry paths using the cumulative dynamic multiplier (see, e.g. Fousekis, Katrakilidis, and Trachanas Citation2016; Shahbaz et al. Citation2018; Dhaoui, Chevallier, and Ma Citation2020). Specifically, Fousekis, Katrakilidis, and Trachanas (Citation2016) note that the asymmetric adjustment paths, as well as the duration of disequilibrium arising from a positive or negative shock, may offer valuable information concerning the pattern of asymmetries. The short-run and long-run asymmetry paths denoted by the cumulative dynamic multiplier effect on of a unit positive change (
) and negative change (
) may be represented as
(8)
(8) whereas
, the
and
, while
and
are as defined earlier. Following Shahbaz et al. (Citation2018), the NARDL specification of the model for this study may be written as
(9)
(9) where
,
,
,
and
,
are the partial sums of positive and negative changes in the explanatory variables respectively as defined earlier in equation (2).
3. Results and discussion
3.1. Preliminary analysis
Results from Table suggest that the mean of RE share is highest in France followed by Canada with about 3.21 and 2.88 respectively but least in the UK with 2.03. Regarding the level of globalization, the mean is highest for the UK but least in Japan whereas the variance is highest in Japan. The mean real GDP per capita is highest in the USA with about 10.51 but least in the UK with 10.27 whereas the variance is least in France with about 0.22. Regarding the mean capital, Japan has the highest value but it is least in the UK while the variance is highest in the USA but least in Germany. Lastly, the skewness and high kurtosis values in most cases suggest non-normality and fat-tails which are early indications of non-linearity.
Table 1. Descriptive statistics.
Results in Table show the non-linearity test using the BDS test for each country. The main intuition from the result permits the rejection of the null hypothesis of linearity for almost all the cases, suggesting the presence of non-linearity. Specifically, we reject the null hypothesis of linearity in the relationship between RE share and globalization, economic growth, and capital formation except in Germany where linearity in the relationship between RE and capital formation cannot be rejected. The presence of non-linearity in most of the series validates the use of a non-linear approach such as the NARDL model of Shin, Yu, and Greenwood-Nimmo (Citation2014) for further analysis.
Table 2. BDS non-linearity test.
The NARDL model of Shin, Yu, and Greenwood-Nimmo (Citation2014) used to examine the existence of long-run relationships among economic variables requires that the series be integrated of order or a combination of
and
To investigate this requirement, we utilize the Augmented Dickey–Fuller (ADF) unit root test with structural breaks. Unlike the traditional unit root tests that do not account for structural changes in the time series, the application of unit root tests with structural breaks offers further evidence of non-linearity by accounting for breakpoints in time series. Also, Shahbaz, Nasir, and Roubaud (Citation2018) note that ignoring structural breaks in unit root tests may lead to the rejection of the null while it is actually true. To overcome this, we utilize the modified ADF unit root test that allows for unknown breakpoints proposed by Kim and Perron (Citation2009). The unit root tests and respective breakpoints on each time series both in levels and after the first difference as well as the time-critical values at 1%, 5%, and 10% are presented in Table .
Table 3. ADF unit root analysis with structural breaks.
The results show that at levels, no variable is stationary in Canada whereas in Japan and the UK only RE and globalization are stationary respectively. Both RE and globalization are stationary in Germany and the United States. RE and growth per capita are stationary in France. Breakpoints occurred in RE in 1976, 1973, 2010, and 1978 in France, Germany, Japan, and the United States. The breakpoints suggest the dates during which significant impacts from energy policy changes regarding the switch to RE in each country. This implies that in all the countries, all variables exhibit a unique order of integration after the first difference (i.e. (1)) in the presence of structural breaks. With regards to RE share after the first difference, results suggest that structural breaks occurred in 1986, 1986, 1990, 2010, 1993, and 2013 in Canada, France, Germany, Japan, the UK, and the USA. Similarly, structural breaks in the level of globalization occurred in 1989, 1986, 1991, 1995, 1977, and 1985 in the same ordering of countries.
3.2. NARDL estimates
In Table , we present estimation results from the NARDL model for each country as defined in equation (9). Given the importance of appropriate lags for NARDL (,
) in avoiding endogeneity and autocorrelation problems and model stability, we follow Rehman et al. (Citation2019) in the appropriate lag selection for each country. Panel A presents the main estimation coefficients and diagnostic model checks; the long-run coefficients for positive and negative shocks in Panel B; and Wald and Bounds test for non-linearity of long-run and short-run estimates as well as the PSS and BDM test statistics in Panel C. The diagnostic results further confirm the stability of the NARDL model across all the countries as the Durbin-Watson statistic tests for autocorrelation lie within the appropriate bounds. Also, the test statistics (
) and (
) fail to reject the null hypothesis of no serial correlation and heteroskedasticity respectively. The long-run coefficients as presented in Panel B shed light on the sensitivity of RE adoption to positive and negative shocks on globalization, income, and capital. The Wald and Bounds tests in Panel C confirm the nonlinearity of the long-run coefficients.
Table 4. NARDL cointegration analysis.
3.2.1. Short-run and long-run analyses
Evidence from Table Panel A shows that in the short run, a positive globalization shock promotes the deployment of RE in Canada, France, Italy, and the US. However, it reduces it in the UK. Furthermore, lagged positive globalization shocks promote RE only in Germany and the UK. On the other hand, a negative globalization shock promotes RE in Japan and the USA but reduces it in Canada, France, and the UK. The estimated long-run coefficients in Panel B show that in the long run, a positive globalization shock facilitates the adoption of RE in Canada, Italy, Japan, and the UK but decreases it in France, Germany, and the USA. On the contrary, a negative globalization shock promotes RE in Germany, Italy, Japan, and the USA while it is detrimental in Canada, France, and the UK. In sum, both positive and negative globalization shocks appear to facilitate the adoption of RE in Italy and Japan but decrease it in France.
These results are related to previous studies that document both positive and negative effects of globalization on emissions through changes in a country's dominant energy source (see, e.g. Shahbaz, Nasir, and Roubaud Citation2018; Shahbaz et al. Citation2013, Citation2018; Zafar et al. Citation2019; Liu et al. Citation2020). Particularly, Liu et al. (Citation2020) demonstrate that increase in the level of globalization leads to
emissions in the G7 countries through the effects of the three components including economic, social, and political globalization on sustainable environmental practices. However, this study does not consider the possibilities of asymmetries in which positive and negative shocks to globalization may have dissimilar effects on RE deployment.
In this regard, a negative shock in globalization may be situated in the context of an increase in trade barriers and cross-border capital flows as well as a restriction in the flow of information which reduces the different components of the composite globalization index. In this context, negative globalization shock may be detrimental to the widespread deployment of RE by limiting the level of economic activities as well as the inflows of foreign capital and technological innovation that promote RE efficiency through an increase in competition. Furthermore, the detrimental effect of a negative globalization shock may also be premised on the fact that RE is still at the development stage even across the G7 countries and that its share in total energy consumption is still small. Therefore, domestic RE consumption still largely serves the purpose of fossil fuel energy demand import substitution, leading to an inverse relationship between globalization and RE use (see, e.g. Rahman and Miah Citation2017).
In contrast, a possible explanation for the detrimental effect of a positive globalization shock on RE use is a bit puzzling. With particular reference to the economic perspective of globalization, the Pollution Haven Hypothesis relates to the ability of developed countries such as the G7 to relocate their pollution-intensive industrial activities abroad via globalization (Liu et al. Citation2020). This may lead to a positive shock to globalization. Also, successful migration of pollution-intensive industries may lead to further positive shock in the level of globalization as goods and services are imported back into the developed countries from where the industries relocated. As value-added in imported goods and services created by relocated industries lead to reductions in emissions in the home countries, attention to environmental issues may decline and widespread RE consumption may be discouraged.
More so, from the political globalization perspective, Cadoret and Padovano (Citation2016) argue that investments in RE are, first and foremost, a political decision and that governments’ investing decisions on RE are largely driven by several political factors. A positive globalization shock entails an increase in membership of global agencies, commissions, and treaties. Among these agencies are environmentalists and green energy promoters with a series of targets to protect the quality of the environment. Given that political factors must always play a role, membership to these agencies has the potential of undermining the pressure from lobbies that demand a greater deployment of RE technologies and may lead to a decrease in the ratio of RE use especially in the long run.
Concerning the impacts of economic growth on RE consumption in the short run, a positive shock to growth promotes RE us in Canada, France, Germany, the UK, and the USA but reduces it in Italy. Lagged positive shock to growth increase RE use in Japan and the US but reduces it in France and Italy. A negative growth shock increases RE use in Italy and the US but reduces it in Canada, Japan, and the UK. Also, a lagged negative shock in growth increases the use of RE in Canada, France, Japan, and the UK. However, in the long run, a positive shock on growth facilitates RE deployment across all the G7 countries except in Japan where its impact appears to be statistically insignificant. In contrast, negative growth shock is hampering the adoption of clean energy use across these countries except in France where it remains beneficial, and in the UK and the USA where the impacts are non-significant.
These results are consistent with previous findings on the positive effects of growth on RE (see, e.g. Cadoret and Padovano Citation2016; Churchill et al. Citation2019; Zafar et al. Citation2019). These studies document that economic activities could lead to more carbon emissions and that a growing economy promotes the consumption of RE consumption as concerns about the environment increase. A possible explanation for the positive effect of a positive shock on economic growth may be premised on the potential of growth to encourage domestic research and development (R&D) activities in RE technological innovation. As noted earlier, a growing economy with increasing economic production may promote the transition to RE use because widespread adoption of RE requires technological innovations that enable mass production and reduction in the unit cost of main RE forms such as winds and solar. Even more, economic growth promotes the development of other sectors such as the financial system which facilitates the inflows of foreign capital and innovation that are necessary for RE technology.
Furthermore, concerning Italy, Cadoret and Padovano (Citation2016) demonstrate that a positive shock to economic growth may be detrimental to RE use when as economic activity increases, greater energy consumption that is demanded due to increased production is above the available RE stock. This may increase the use of more elastic energy sources that can be more easily available energy types such as fossil-based energy sources. Thus, the ratio of RE use on total energy demand decreases. On the other hand, a negative shock on economic growth may also promote the transition to RE consumption due to the growth cost of fossil-based energy price hikes. With particular reference to France, Ang (Citation2007) argues that the transition to the massive deployment of alternative energy sources may be attributed to the huge negative growth impact of crude oil shocks in the 1970s.
A short-run positive shock on capital stock impacts positively on RE use in Canada, Germany, Italy, Japan, and the UK. There is an inverse relationship between positive shock and its lag on RE in the US. Also, the impact of positive capital shock when lagged is positive in France but negative in Japan. On the other hand, a negative capital shock is detrimental to RE adoption in Germany and the USA but positive in both Canada and Japan. Lagged negative capital shock only promotes RE use in Canada but has a detrimental or insignificant effect on the remaining countries. In sum, in the short run, Canada and the USA present two opposing scenarios with both positive and negative shocks as well as its lags facilitating RE use in Canada while being detrimental in the USA. However, in the long run, both positive and negative shocks facilitate the adoption of RE in both Canada and Japan but decrease it in the USA. A positive shock to capital stock promotes RE efficiency in France, Germany, Italy, and the UK but a negative shock is detrimental in France and Italy but non-significant in Germany and the UK.
There are obvious reasons while available capital stock should promote the transition to RE sources. For instance, both domestic and foreign capital stock are sources of investment and innovation that promote RE efficiency. This evidence is supported by previous studies including
Doytch and Narayan (Citation2016), Nie et al. (Citation2016), Paramati, Mo, and Gupta (Citation2017), and Yang et al. (Citation2019). It is therefore expected that negative capital shock acts as an impediment to RE technology. In contrast, a possible explanation of the detrimental effect of a positive capital shock may be premised on the fact that the cost of solar power is still much higher than that of fossil-based energy sources. In a bid to promote both private and public investment in the use of RE, the government mostly adopts a mix of policies or measures. However, as noted in Hsu (Citation2012), finding a mix of appropriate policy measures that is both effective and feasible in promoting RE adoption has become a critical issue for most governments. Given that most policy measures would include capital subsidies will require a huge budget for the government to adopt them. The potential heavy policy cost will not only burden the government financially but may also cause a decrease in public faith in the implementation of such policies. Hence, these policies have the potential to adversely affect the promotion of RE use.
As shown in Panel C, the Wald test for long and short-run symmetries of the explanatory variables in the RE demand functions are presented for all the countries. Results show that we can reject the null hypothesis of symmetry in both long-run () and short-run (
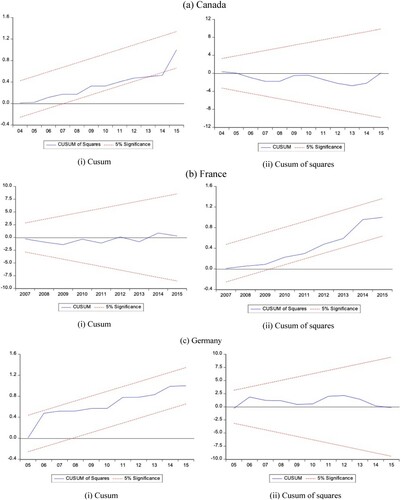
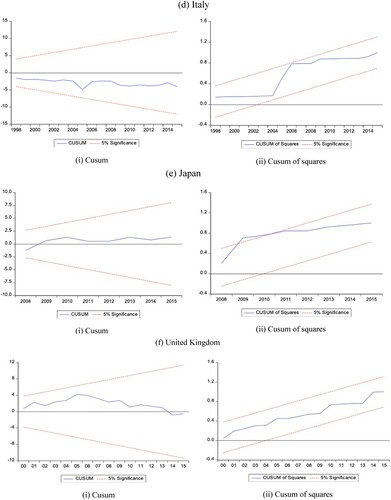
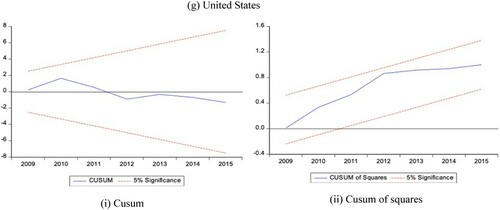
) positive and negative partial sum decomposition of the explanatory variables for each country. Hence, this validates the appropriateness of an asymmetric empirical estimation strategy. Finally, following Brown, Durbin, and Evans (Citation1975) and Ploberger, Krämer, and Kontrus (Citation1989), the stability of the nonlinear ARDL models for all the countries are tested using the CUSUM and CUSUM of squares. The results for this exercise are reported in Figure in the appendix.
3.2.2. Dynamic multipliers
As shown in Figure Panel A (i)–(iii), the cumulative effect of a standard deviation positive and negative shocks to globalization, economic growth, and capital stock on RE is presented for Canada. As shown in (i), RE consumption responds negatively to both positive and negative globalization shocks up to the fifth year. Afterward, RE responds rapidly and positively to a positive shock on globalization while the detrimental effect of negative globalization shock diminishes continuously. Also, RE appears to be mainly responsive to a positive growth shock. The positive effect of a positive growth shock on RE is significantly rapid in the first two years but moderates after the fourth year. In contrast, RE responds negatively to both positive and negative shocks on the capital stock in the early years but responds positively to positive capital shock after the fourth period. However, the detrimental effect of negative capital shock largely dominates the positive effect of a positive shock.
Figure 3. Dynamic multipliers with ![]()
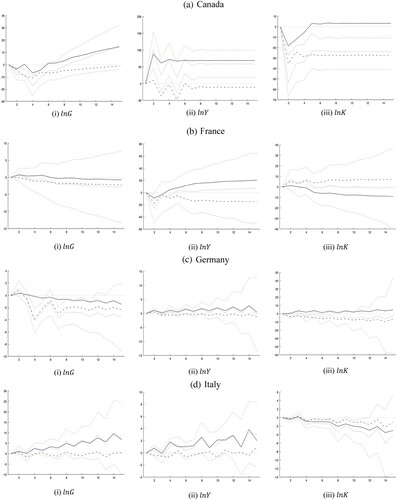
Figure 3. Continued.
In France, RE adjusts positively to a positive globalization shock up till the sixth year but both shocks become detrimental afterward. Also, RE reacts positively to a positive income shock after the second year but negatively to a negative shock to income over the entire period. Surprisingly, RE responds positively to a negative capital shock but inversely to a positive income shock after the fourth year. In Germany, RE responds negatively to a positive globalization shock after the second period but the adverse response to a negative globalization shock dominates over the entire period. However, RE responds positively to positive shocks on both income level and capital stock in Germany. Regarding Italy, evidence suggests that RE responds positively to positive shocks on globalization and income growth but negatively to both positive and negative shocks on capital.
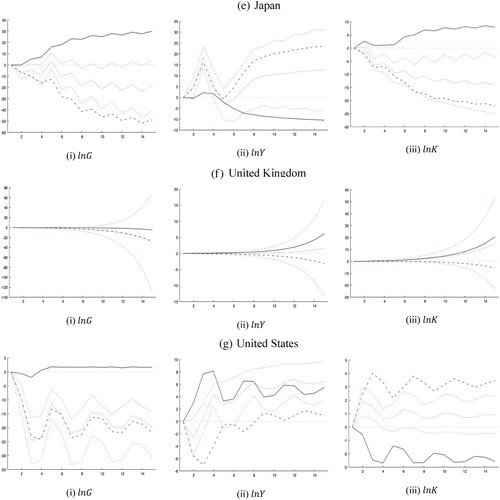
Lastly, RE is driven positively by positive shocks on both globalization and capital stock but negatively by negative shock on income after the fourth period. Overall, there is clear evidence that RE responds more rapidly to negative shocks than positive shocks in Japan. That is, the absolute effects are stronger following a negative shock across all the explanatory variables. In contrast, for the UK, RE consumption adjusts asymmetrically in all cases after the fourth period. In particular, whereas both positive shocks on income and capital exert a favourable influence on RE, adjustment is delayed and mainly driven by negative shock to globalization. The asymmetric effect of positive globalization shock is more gradual. Lastly, in the USA, RE responds positively to positive changes in both globalization and income but negatively to positive changes in capital. In all these cases, the absolute effect due to negative shocks appears to prevail except in growth.
3.3. Panel analysis
Given that the countries considered in this study share common features including their level of globalization, economic growth, and are heavy energy consumers, it is expected that changes in these features have a significantly similar effect on RE deployment across them. Indeed, this subsection attempts to offer a summary of the previous country-specific estimations. To do this, we follow previous studies such as Nusair (Citation2016) to extract the decomposed positive and negative shocks to globalization, economic growth, and capital for all the countries. We start by exploring the stationarity of the panel variables using the Im-Pesaran-Shin panel unit root test (Im, Pesaran, and Shin Citation2003) as presented in Table . The IPS panel unit root analysis shows that except for the RE and positive shock on capital, all other variables are non-stationary at levels but after the first difference, under both specifications (Trend and Intercept, and Intercept) all variables become stationary.
Table 5. IPS panel unit root test.
We proceed to test for cointegration using both the Fisher-Johansen and Pedroni panel cointegration tests. The Fisher test uses two ratio tests such as a trace and maximum eigenvalue test and accommodates as much heterogeneity as is possible, while the Pedroni is a residual-based test that extends the Engle-Granger two-step cointegration framework that assumes cross-sectional dependence. As shown in Table , under the Fisher panel cointegration test, whereas the trace test suggests the existence of at most 4 cointegration relationships, the maximum Eigenvalue test suggests at most 3. On the other hand, the Pedroni reports both the within and between dimension test statistics. All the models suggest the existence of a cointegration relationship except the Panel
Table 6. Panel cointegration tests.
-statistics both within a panel and between-group dimensions. Therefore, the dependent variable and the independent variables are expected to have a long-run association.
Having established that RE and the partial sum decomposition of globalization, growth, and capital series are cointegrated, we proceed to explore the long-run relationship between these variables. Indeed, we use both the Fully Modified Ordinary Least Squares (FMOLS) and Panel Dynamic Ordinary Least Squares (PDOLS) models to estimate the long-run effects of negative and positive shocks on globalization, growth, and capital on RE. These models enable us to account for cointegration, endogeneity, heterogeneity, and cross-sectional dependencies. As presented in Table with RE as a dependent variable, results show that the nonlinear definitions of our chosen regressors explain about 83% and 0.88% of long-run adjustments in RE in the G7 countries under the FMOLS and PDOLS respectively. Also, the stability of these models is confirmed using the Jacque-Bera normality test for the errors.
Table 7. Panel cointegration estimation results.
Evidence from both models shows that a positive shock on globalization promotes the use of RE in the G7 countries whereas a negative shock decreases it. In particular, a 1% positive shock on globalization leads to about 0.20% and 0.24% increase in RE according to the FMOLS and PDOLS respectively. In contrast, a 1% negative shock on globalization could lead to a decrease in RE by about 0.18% and 0.14%. Taken together, these findings suggest that in the long run, positive changes in the level of globalization are beneficial to RE in the G7 countries and that a positive globalization shock has a considerably larger absolute impact on RE than negative changes.
Also, both models show a considerably larger impact of the positive shock on growth than the negative shock on RE. Specifically, positive income shock impacts positively on RE while negative shock decreases the use of RE. However, the detrimental impact of negative income shock appears to be non-significant under the PDOLS model. A percent change in positive growth shock leads to about 0.71% and 0.78% increase in RE respectively. In contrast, a percent change in negative shock on income decreases RE by about 0.11%. These findings suggest that RE is mainly driven by positive output growth in the G7 countries.
Regarding the effects of capital, both models show that negative shock on capital has detrimental effects on RE. Particularly, a 1% increase in negative capital shock leads to about 0.36% and 0.48% decrease in RE respectively. This suggests that although the detrimental impact of the negative capital shock is less than that of income growth, it is considerably larger than the detrimental effects of a negative globalization shock. Lastly, whereas the FMOLS model reports a non-significant impact for positive capital stock, the PDOLS suggests that a positive capital shock increases RE.
4. Conclusion and policy implications
This paper examines the effects of globalization and economic growth on RE while accounting for the existing level of capital in the G7 countries from the period 1970 to 2015. Unlike previous studies, this paper uses the composite globalization index proposed by Dreher (Citation2006) which enables us to capture the three dimensions of globalization including economic, social, and political globalization. Furthermore, our empirical approach enables us to explore both the impact of positive and negative shocks of the explanatory variables on RE under a nonlinear framework using the NARDL model. We further enrich the NARDL analysis by exploring the dynamic adjustments of RE given a standard deviation change on the nonlinear definitions of the explanatory variables. In our further analysis, we examine the joint effects of the nonlinear definitions of globalization, growth, and capital on RE using panel cointegration analysis, FMOLS, and PDOLS.
The results show evidence of asymmetric cointegration among RE, globalization, growth, and capital across the G7 countries. Results show evidence of asymmetries across all the countries. Shocks on globalization increase (decrease) RE in Canada, Germany, the UK, and the USA. However, they promote RE in Italy and Japan but decrease it in France. In contrast, both income shocks increase RE in France but increase (decrease) it in Canada, Germany, and Italy. Positive income shock facilitates RE in the UK and the USA while negative income shock is detrimental to RE in Japan. Our further analysis using panel cointegration, the Fully Modified OLS (FMOLS), and Panel Dynamic OLS (PDOLS) suggest that RE deployment in the G7 countries is mainly driven by positive shocks on income, globalization, and then, the capital.
The empirical findings from this study hold profound policy implications and recommendations. For instance, the finding that long-run positive shock on globalization impacts favourably on the transition to RE in Canada, Italy, Japan, and the UK suggests that increase in the exchange of goods and services, capital flows, exchange of social values as well as membership of international agencies and missions improves awareness of environmental sustainability and more energy-efficient systems. Along this line, policies promoting more global integration are encouraged. Along this line, restrictions on technology transfer should be lowered in countries where globalization is unfavourable to RE as this would enable a rapid transfer of innovation and decrease the downside of globalization such as the Pollution Haven Hypothesis. This policy recommendation aligns with the findings of Liu et al. (Citation2020) which argues that although globalization may lead to an increase in carbon emissions due to an increase in energy consumption when it rises above a certain extent, a positive globalization shock in the form of lower barriers to RE technology transfer has the potential of decreasing carbon emission through rapid deployment of RE.
Furthermore, regarding the favourable effects of positive economic growth shocks on RE adoption, a mix of appropriate policy mix should be implemented to promote further consumption of RE without disrupting the production process or discouraging investment. As noted in previous studies such as Chen et al. (Citation2019) and Liu et al. (Citation2020), energy acts as the backbone of economic growth, and to ensure continuous growth, more energy is required. Given that most of the G7 economies have grown steadily in recent times with a notable increase in the level of energy demand, there is a need to facilitate widespread deployment of RE technologies to decrease the environmental cost of fossil-based energy consumption as well as the growth-cost of fuel price hikes. The steady increase in the economic growth of G7 countries has been severally linked to the increase in emissions due to fossil-based energy consumption. Therefore, as energy consumption is a prerequisite for a growing economy, there is a need to promote the adoption of RE and increase its share in total energy consumption through favourable policy measures without hurting the existing production system. Hence, the government should promote a balance between economic growth and environmental sustainability by altering the structure of energy consumption through the concept of a green economy. Along this line, green bonds, carbon tax, and tax holidays for green energy adopting firms are potential pathways to achieve such transition and/or balance.
Going further, there are three potential areas of further inquiry that stand out. First, our study focuses only on G7 countries which are all developed countries. In contrast to most developing countries, these G7 countries have higher levels of RE adoption and globalization, making it difficult to ascertain the extent our findings here are applicable to most developing countries. Hence, future research could focus on understanding the nature of relationship our study sets out to study in the contest of developing countries. Recent studies are beginning to examine how export quality affects energy consumption and CO2 emission (e.g. Can and Gozgor Citation2018; Fang et al. Citation2019; Gozgor and Can Citation2017). Such analysis could also consider how export quality interacts with a country’s level of globalization and income in determining transition to cleaner energy adoption. Finally, our empirical analysis focuses only on RE consumption as an empirical measure of RE deployment or adoption. Future studies could consider other potential indicators RE along the lines discussed in Bourcet (Citation2020).
Disclosure statement
No potential conflict of interest was reported by the author(s).
Notes
1 Also see Gökmenoğlu and Taspinar (Citation2016) and Lv and Xu (Citation2019).
References
- Ang, B. 2007. “CO2 Emissions, Energy Consumption, and Output in France.” Energy Policy 35 (10): 4772–4778.
- Awerbuch, S., and R. Sauter. 2006. “Exploiting the oil–GDP Effect to Support Renewables Deployment.” Energy Policy 34 (17): 2805–2819.
- Bachmeier, J., and M. Griffin. 2003. “New Evidence on Asymmetric Gasoline Price Responses.” Review of Economics and Statistics 85: 772–776.
- Banerjee, A., J. Dolado, and R. Mestre. 1998. “Error‐Correction Mechanism Tests for Cointegration in a Single‐Equation Framework.” Journal of Time Series Analysis 19 (3): 267–283.
- Bayer, P., L. Dolan, and J. Urpelainen. 2013. “Global Patterns of Renewable Energy Innovation, 1990–2009.” Energy for Sustainable Development 17 (3): 288–295.
- Beck, F., and E. Martinot. 2004. “Renewable Energy Policies and Barriers.” Encycl. Energy 34 (3): 365–383.
- Bourcet, C. 2020. “Empirical Determinants of Renewable Energy Deployment: A Systematic Literature Review.” Energy Economics 85: 104563.
- Brown, L., J. Durbin, and M. Evans. 1975. “Techniques for Testing the Constancy of Regression Relationships Over Time.” Journal of the Royal Statistical Society: Series B (Methodological 37 (2): 149–163.
- Cadoret, I., and F. Padovano. 2016. “The Political Drivers of Renewable Energies Policies.” Energy Economics 56: 261–269.
- Can, M., and G. Gozgor. 2018. “Effects of Export Product Diversification on Quality Upgrading: an Empirical Study.” The Journal of International Trade & Economic Development 27 (3): 293–313.
- Chang, H., M. Huang, and C. Lee. 2009. “Threshold Effect of the Economic Growth Rate on Renewable Energy Development from a Change in Energy Price: Evidence from OECD Countries.” Energy Policy 37 (12): 5796–5802.
- Chen, S., S. Saud, S. Bano, and A. Haseeb. 2019. “The Nexus Between Financial Development, Globalization, and Environmental Degradation: Fresh Evidence from Central and Eastern European Countries.” Environmental Science and Pollution Research 26 (24): 24733–24747.
- Cheon, A., and J. Urpelainen. 2012. “Oil Prices and Energy Technology Innovation: An Empirical Analysis.” Global Environmental Change 22 (2): 407–417.
- Churchill, A., J. Inekwe, R. Smyth, and X. Zhang. 2019. “R&D Intensity and Carbon Emissions in the G7: 1870–2014.” Energy Economics 80: 30–37.
- Dhaoui, A., J. Chevallier, and F. Ma. 2020. “Identifying Asymmetric Responses of Sectoral Equities to oil Price Shocks in a NARDL Model.” Studies in Nonlinear Dynamics & Econometrics, 20190066.
- Doytch, N., and S. Narayan. 2016. “Does FDI Influence Renewable Energy Consumption? An Analysis of Sectoral FDI Impact on Renewable and non-Renewable Industrial Energy Consumption.” Energy Economics 54: 291–301.
- Dreher, A. 2006. “Does Globalization Affect Growth? Evidence from a new Index of Globalization.” Applied Economics 38 (10): 1091–1110.
- Eckstein, D., V. Künzel, and L. Schäfer. 2021. Global Climate Risk Index 2021. Who Suffers Most from Extreme Weather Events, 2000-2019. Bonn: Germanwatch.
- Fang, J., G. Gozgor, Z. Lu, and W. Wu. 2019. “Effects of the Export Product Quality on Carbon Dioxide Emissions: Evidence from Developing Economies.” Environmental Science & Pollution Research 26 (12): 12181–12193.
- Fousekis, P., C. Katrakilidis, and E. Trachanas. 2016. “Vertical Price Transmission in the US Beef Sector: Evidence from the Nonlinear ARDL Model.” Economic Modelling 52: 499–506.
- Gökmenoğlu, K., and N. Taspinar. 2016. “The Relationship Between CO2 Emissions, Energy Consumption, Economic Growth and FDI: the Case of Turkey.” The Journal of International Trade & Economic Development 25 (5): 706–723.
- Gozgor, G., and M. Can. 2017. “Does Export Product Quality Matter for CO2 Emissions? Evidence from China.” Environmental Science & Pollution Research 24 (3): 2866–2875.
- Gozgor, G., K. Mahalik, E. Demir, and H. Padhan. 2020. “The Impact of Economic Globalization on Renewable Energy in OECD Countries.” Energy Policy 139: 111365.
- Hsu, W. 2012. “Using a System Dynamics Model to Assess the Effects of Capital Subsidies and Feed-in Tariffs on Solar PV Installations.” Applied Energy 100: 205–217.
- Im, S., H. Pesaran, and Y. Shin. 2003. “Testing for Unit Roots in Heterogeneous Panels.” Journal of Econometrics 115 (1): 53–74.
- Kim, D., and P. Perron. 2009. “Unit Root Tests Allowing for a Break in the Trend Function at an Unknown Time Under Both the Null and Alternative Hypotheses.” Journal of Econometrics 148 (1): 1–13.
- Lee, J. 2000. “The Robustness of Okun’s Law: Evidence from OECD Countries.” Journal of Macroeconomics 22: 331–356.
- Liu, M., X. Ren, C. Cheng, and Z. Wang. 2020. “The Role of Globalization in CO2 Emissions: a Semi-Parametric Panel Data Analysis for G7.” Science of the Total Environment 718: 137379.
- Lv, Z., and T. Xu. 2019. “Trade Openness, Urbanization and CO2 Emissions: Dynamic Panel Data Analysis of Middle-Income Countries.” The Journal of International Trade & Economic Development 28 (3): 317–330.
- Menegaki, N. 2011. “Growth and Renewable Energy in Europe: A Random Effect Model with Evidence for Neutrality Hypothesis.” Energy Economics 33 (2): 257–263.
- Nie, Y., H. Chen, C. Yang, and H. Wang. 2016. “Subsidies in Carbon Finance for Promoting Renewable Energy Development.” Journal of Cleaner Production 139: 677–684.
- Nusair, A. 2016. “The Effects of oil Price Shocks on the Economies of the Gulf Co-Operation Council Countries: Nonlinear Analysis.” Energy Policy 91: 256–267.
- Ozturk, I., and A. Acaravci. 2013. “The Long-run and Causal Analysis of Energy, Growth, Openness and Financial Development on Carbon Emissions in Turkey.” Energy Economics 36: 262–267.
- Paramati, R., N. Apergis, and M. Ummalla. 2017. “Financing Clean Energy Projects Through Domestic and Foreign Capital: The Role of Political Cooperation among the EU, the G20, and OECD Countries.” Energy Economics 61: 62–71.
- Paramati, R., D. Mo, and R. Gupta. 2017. “The Effects of Stock Market Growth and Renewable Energy use on CO2 Emissions: Evidence from G20 Countries.” Energy Economics 66: 360–371.
- Pesaran, H., and Y. Shin. 1998. “An Autoregressive Distributed-lag Modelling Approach to Cointegration Analysis.” Econometric Society Monographs 31: 371–413.
- Pesaran, H., Y. Shin, and R. J. Smith. 2001. “Bounds Testing Approaches to the Analysis of Level Relationships.” Journal of Applied Econometrics 16 (3): 289–326.
- Ploberger, W., W. Krämer, and K. Kontrus. 1989. “A New Test for Structural Stability in the Linear Regression Model.” Journal of Econometrics 40 (2): 307–318.
- Rahman, M., and D. Miah. 2017. “The Impact of Sources of Energy Production on Globalization: Evidence from Panel Data Analysis.” Renewable and Sustainable Energy Reviews 74: 110–115.
- Rehman, U., E. Bouri, V. Eraslan, and S. Kumar. 2019. “Energy and non-Energy Commodities: An Asymmetric Approach Towards Portfolio Diversification in the Commodity Market.” Resources Policy 63: 101456.
- Shahbaz, M., A. Hye, K. Tiwari, and C. Leitão. 2013. “Economic Growth, Energy Consumption, Financial Development, International Trade and CO2 Emissions in Indonesia.” Renewable and Sustainable Energy Reviews 25: 109–121.
- Shahbaz, M., A. Nasir, and D. Roubaud. 2018. “Environmental Degradation in France: The Effects of FDI, Financial Development, and Energy Innovations.” Energy Economics 74: 843–857.
- Shahbaz, M., H. Shahzad, S. Alam, and N. Apergis. 2018. “Globalization, Economic Growth, and Energy Consumption in the BRICS Region: The Importance of Asymmetries.” Journal of International Trade & Economic Development 27 (8): 985–1009.
- Shin, Y., B. Yu, and M. Greenwood-Nimmo. 2014. “Modeling Asymmetric Cointegration and Dynamic Multipliers in a Nonlinear ARDL Framework.” In Festschrift in Honor of Peter Schmidt, 281–314. New York, NY: Springer.
- Tariq, M., Y. Xu, F. Muhammad, and K. M. Alam. 2019. “The Dirty Energy Dilemma via Financial Development and Economic Globalization in Pakistan: New Evidence from Asymmetric Dynamic Effects.” Environmental Science and Pollution Research 26 (25): 25500–25512.
- Viren, M. 2001. “The Okun Curve is non-Linear.” Economics Letters 70: 253–257.
- Yang, X., L. He, Y. Xia, and Y. Chen. 2019. “Effect of Government Subsidies on Renewable Energy Investments: The Threshold Effect.” Energy Policy 132: 156–166.
- Yao, Y., K. Ivanovski, J. Inekwe, and R. Smyth. 2019. “Human Capital and Energy Consumption: Evidence from OECD Countries.” Energy Economics 84: 104534.
- Zafar, W., H. Zaidi, A. Sinha, A. Gedikli, and F. Hou. 2019. “The Role of the Stock Market and Banking Sector Development, and Renewable Energy Consumption in Carbon Emissions: Insights from G-7 and N-11 Countries.” Resources Policy 62: 427–436.
Appendix
Figure A1. Plots of cumulative sum and cumulative sum of squares.