
Abstract
Background
There is increasing interest in measuring wellbeing and mental health in a range of settings and services outside conventional mental health care settings. However, ensuring that measurement does not intrude on the primary service activity whilst promoting inclusion through minimizing literacy demands, requires ultra-brief and easy to use tools.
Aims
To develop and test a brief emoji-based tool to assess mental health, wellbeing, resilience and community connection.
Method
In study 1, 672 adults completed an online questionnaire study comprising a new emoji measure and established questionnaires assessing mental health, resilience, community connection and wellbeing. In study 2, 415 participants completed a paper-and-pencil version of the emoji measure, mental health and community connection, with 212 individuals providing data at a second time point.
Results
Multidimensional scaling revealed a meaningful structure to the emoji measure with validity demonstrated through relationships to existing scales. Stability over time and sensitivity to change were also demonstrated.
Conclusions
The emoji-based measure presented here provides an ultra-brief measure of mood and current experience, with minimal literacy demands on participants. Further research is now needed to test the properties and utility of the scale with other participant groups.
Over recent years there has been growing interest in and use of self-report mental health and wellbeing measures outside traditional clinical contexts. This may reflect an increasing awareness of the high prevalence of mental health difficulties (e.g. reported rates of 1 in 6 people in the UK experiencing common mental disorders; McManus et al., Citation2016) and a widening interest in examining the impact of non-clinical interventions on individual wellbeing (e.g. Davies et al, Citation2020).
A large number of assessment tools already exist which may be used alone or in combination, in order to assess individual psychosocial wellbeing. However, the length of these scales and their reliance on the written word can make them impractical for use where time is short or when assessing those with difficulties in literacy, concentration or cognitive capacity. Consequently, a number of shortened or abbreviated tools have been developed by researchers and clinicians with the aim of making scales shorter and more accessible, while maintaining their validity. For example, the PHQ-4 is a short measure of both anxiety and depression developed from a 9 item measure of depression (PHQ-9) and a 7 item measure of anxiety (GAD-7) (Kroenke et al., Citation2009). Similarly, the Short Warwick-Edinburgh Mental Well-being Scale provides a shortened (7 item) form of the longer Warwick-Edinburgh Mental Well-being Scale. This abbreviated scale has been shown to be free from gender and age bias and to conform to Rasch model expectations, providing a score which significantly correlates with scores on the full scale (Stewart-Brown et al., Citation2009). However, limitations with such scales remain such as the need to use several measures in order to assess a range of domains, the reliance on written questions that require a degree of literacy to properly comprehend the items, and the lack of validated translations to enable use with participants with a variety of first languages.
Illiteracy poses a particular challenge when using existing psychometric scales with participants. Illiteracy is a significant problem worldwide (UNESCO, Citation2015) with 16.4% of adults in England reported to have ‘very poor’ literacy skills (Organisation for Economic Co-Operation and Development, Citation2016). Poor literacy levels are common in vulnerable groups who are often the target of psychosocial interventions such as immigrants (Sen et al., Citation2018), those from lower socioeconomic contexts (Letourneau et al., Citation2013) and prisoners (Snowling et al., Citation2000). Illiteracy can result in items on scales being misunderstood, however, research indicates that despite a lack of understanding participants may still provide a response (Arrieta et al., Citation2017). Furthermore, an inability to read or understand items may itself cause anxiety that is then reflected in the answers given (Maughan & Carroll, Citation2006).
In order to be inclusive and accurately capture individual self-report it may be useful to present visual stimuli in place of, or in association with text. Such an idea is not new with several tools in existence which include elements of, or are exclusively constructed to, gather information using pictorial methods or that combine pictures with limited text. Some of these seek to adapt existing tools to make them suitable for use with specific groups such as those with learning disabilities (e.g. Breen, Citation2017) whilst others incorporate visual representations into their design. For example, the McGill Pain Questionnaire (Melzack, Citation1975) contains a manikin representation to enable respondent to indicate the internal/external location of pain sensations in a text free way, whilst the Self-Assessment Manikin (SAM; Bradley & Lang, Citation1994) enables respondents to rate three emotional reactions to an event (pleasure, arousal, dominance) by selecting one of the five pictorial representations of each reaction. Within the field of mental health, the Akena Visual Depression Inventory (AviDI-18; Akena et al., Citation2018) utilises drawings of people-in-action to represent diagnostic criteria for depression. The authors of this tool have shown it to be an effective screening method for major depression regardless of literacy ability, reporting a sensitivity of 87% and specificity of 84.9% (using a cut off score of 16) when compared with a diagnostic interview (Mini-International Neuropsychiatric Inventory).
Facial expression images may be particularly useful for assessing emotions and experiences as facial expressions are arguably innate and universal, with at least six basic facial expressions recognised across cultures (Ekman, Citation1994). However, previous research, using a single visual analogue scale depicting seven faces (happy – unhappy), was found to perform more poorly than short questionnaire measures (Puertas et al., Citation2004).
The widespread use of emojis (small icons or digital images) to provide visual representations of a vast array of emotional states may provide an alternative approach. Whilst the way emojis are used may be influenced by a range of factors including culture, existing research has tended to focus upon the ways in which individuals spontaneously use emojis (Bai et al., Citation2019). There are currently 2666 recognized emojis with 84 of these being representations of facial expressions (Unicode Consortium, Citation2019). This large number allows not only a wide range of emotions to be expressed, but also for nuances within emotions to be conveyed. This diversity has helped the emoji become omnipresent in mobile communications and social media, with approximately 5 billion uses per year on Twitter alone (Kralj Novak et al., Citation2015). Emojis have the potential to provide an accessible and engaging alternative to conventional self-report scales for use where time is limited or for those with reading or comprehension difficulties including those for whom the measure is only available in their second or third language.
The aim of the present research was to develop and test a new, multi-item, visual tool combining emojis representing a range of emotions and experiences with anchor words. Specifically, the psychometric properties of the tool including structure and concurrent validity were assessed across two separate studies.
Study 1
Aims
This study sought to test an emoji-based tool using an online general population sample. In addition to assessing scale structure using multidimensional scaling, concurrent validity was examined. It was hypothesised that there would be positive correlations between
the ‘anxious’ emoji and a psychometric measure of anxiety
the ‘sad’ emoji and a psychometric measure of depression
the ‘connected to others’ emoji and scores on a measure of community connection
the ‘good about myself’ emoji and a measure of general wellbeing
the ‘failure’ emoji and a measure of resilience
Method
Research design
This was a cross-sectional online study with all participants completing the measures in the same order.
Participants
Participants (N = 672) were over 18 years of age and spoke English as their first language. The sample was predominantly white (85.9%), broadly gender balanced (52.4% female), with a median age of 30 years (mean 33.3, s.d. 13.66, range 18-71). The majority were single (63.5%) with 58.2% in part or full time employment. Details of the sample demographics can be found in the supplemental table.
Measures
Current mood and experience (emoji measure)
The Emoji Current Mood and Experience Scale (ECMES) is a ten-item measure developed to assess aspects (domains) of psychosocial wellbeing relevant to a wide range of contexts. The items included within the scale were created using a multi-step process. A long list of 42 domains (ranging from common mental health concerns, e.g. anxiety, to community connection) were derived from a review of the literature and the authors’ experience of this area. Next, a convenience sample of people who regularly worked with vulnerable or marginalised individuals with poor literacy skills (n = 5) were engaged, as a group, in a series of tasks to refine the domains. This group comprised 2 women (3 men) of white British origin, aged 25-50. All had extensive knowledge of working with vulnerable groups and facilitating self-report monitoring and two were English for Speakers of Other Languages (ESOL) teachers. First, they were asked to agree on the placement of each of the domains (presented on index cards) into one of three groups according to a) how easy they were to understand (1 = very easy), and b) their perceived relevance to the measurement of psychological and social/community wellbeing (1 = very relevant). Those domains placed in group three for either rating were removed (n = 16). Second, the focus group were asked to identify repetition/overlap between the domains by clustering domains they considered to address the same or similar constructs. From each cluster they were asked to select the most representative or easy to understand domain. This led to a shortlist of 14 domains. Next, the authors matched each domain to at least one potential emoji representation by reviewing hundreds of widely available emojis. In the one instance where an emoji representation could not be found a graphic artist designed a bespoke emoji (‘connected to others’). In the final step the focus group was reconvened and asked to select 10 emojis to represent distinct domains for inclusion in the scale. This number was selected to provide sufficient range whilst maintaining scale brevity. There was clear consensus in the group for the 10 selected; these represented the domains of happiness, sadness, failure, anxiety, loneliness, boredom, relaxation, valued (by others), connected (to others), and feeling good (about oneself). In the scale used for study 1 and study 2, emojis were presented accompanied by definitional word(s) (in the respondent’s first language) directly above them. Participants were asked to rate their experience “On an average day” using a 5-point Likert type visual analogue scale from 0 to 4 (anchored using the words ‘Very Little’ to ‘Very Much’). The final format of the scale and the brief user manual are available to download from www.downtoearthproject.org.uk/health/#research.
Anxiety & depression
The PHQ-4 (Patient Health Questionnaire-4 item; Kroenke et al., Citation2009) is an ultra-brief screening tool designed to assess levels of self-reported anxiety (2 items) and depression (2 items). Participants are asked to indicate how often they have been bothered by specific problems in the last two weeks on a four-point Likert scale (ranging from ‘Not at all’ (0) to ‘Nearly every day’ (3)). Scores are calculated as the sum of answers for each component (range 0-6), with a score = >3 considered the cut-point for clinically significant anxiety or depression (Kroenke et al., Citation2009). The authors report good internal consistency of each of the scales (α > 0.8), and good construct validity when assessed against other measures.
Well-being
The SWEMWBS (Short Warwick-Edinburgh Mental Well Being Scale; Stewart-Brown et al., Citation2009) is a seven item measure of psychological, eudemonic and hedonic wellbeing. Participants are asked to rate statements on a five-point Likert scale in relation to their experiences in the preceding two weeks, ranging from ‘None of the time’ to ‘All the time’. A total score is obtained and requires transformation using a conversion table. Transformed scores can range from 7-35. The authors report satisfactory fit to a Rasch model indicating scale unidimensionality and a high degree of correlation with the widely used longer form of the scale (Spearman's correlation = 0.95). Good criterion validity has also been shown in other studies (e.g. Haver et al., Citation2015).
Resilience
The Brief Resilience Scale (Smith et al., Citation2008) contains six items designed to measure a person’s ability to recover from stress. Participants are asked to rate three positively and three negatively worded statements on a five-point Likert scale ranging from ‘Strongly Disagree’ (1) to ‘Strongly Agree’ (5). Negatively worded items are reverse scored and a total score is obtained from the mean of all six items, ranging from 1-5. The authors report good internal consistency for the scale with different samples (α > 0.8), and convergent and divergent validity in the direction and scale expected.
Community connectedness
The ICS (Inclusion of Community in the Self Scale; Mashek et al., Citation2007) assesses a feeling of identifying with, and being a part of, one’s community (Fitzpatrick & LaGory, Citation2011). The ICS is a single-item scale comprised of six Venn diagrams overlapping to varying degrees. Participants are asked to indicate which diagram best depicts their relationship with the community at large. The scale is scored from 0 (no connectedness) to 5 (total connectedness). Community connectedness was selected to represent a connection with place as well as with other people (rather than social connection specifically). Measure selection was also influenced by the scale being a single item and in a non-verbal format making it highly suited to the overall intent of the study. The authors report good test-retest reliability (two week interval - r = .74) and convergent validity with a number of sense of community and community helping and hurting measures.
Procedure
Ethical approval was obtained from a university departmental ethics committee (2018-0188-137). Participants were recruited from the department subject pool (where students received 1 credit for participation) and internationally via social media and several online discussion forums. The study advert contained a hyperlink that took potential participants to an online questionnaire hosted by Qualtrics. Participants were free to complete the study using any form of device, and in their own time and place.
The first page of the study provided a participant information sheet outlining the purpose of this study. This included information on data management, confidentiality and data protection, the voluntary nature of the study and the right to withdraw. Participants were required to be aged 18 or over, and to provide informed consent in order to progress to the study.
Section one of the study asked for demographic information including age, gender, highest level of qualification, relationship status, ethnic group and employment status. Section two contained the ECMES, and section three the BRS, ICS, SWEMWBS and PHQ-4. There was no time limit, though pilot testing of the questionnaire indicated it took no longer than 10 minutes to complete. Participants were able to go back through answers prior to submitting their final responses.
The final page contained debriefing information and details of support services for anyone distressed by their participation.
Results
Participants in this study were compared with available published data for the established scales. Scores for resilience (BRS), community connection (ICS) and wellbeing (SWEBWBS) in this sample were very similar to normative data (see : study 1), however the sample showed higher overall scores for anxiety and depression (PHQ-4) although still below the cutpoint for clinically significant anxiety or depression (Kroenke et al., Citation2009; Lowe et al., Citation2010).
Table 1. Mean (SD) scores for study samples and published comparisons for BRS, ICS, SWEBWBS and PHQ-4 scales.
Gender
Differences in scores by gender on existing scales showed that men reported higher resilience as measured by the BRS (M = 3.33) than women (M = 3.06; p = <.001, d = 0.32) and women reported significantly higher anxiety (M = 2.47) than males (M = 1.94; p = .002, d = 0.28). No significant differences were found for wellbeing (SWEMWBS); PHQ-4 depression or ICS.
Examination of the ECMES
Mean scores and standard deviations for the ECMES are found in , study 1. As can be seen, all the items have means around the centre-point of 3.
Table 2. Mean scores and standard deviations by study for each item in the new Emoji Scale of Mood, arranged by positive and negative orientation.
To visualise the ECMES scale structure (i.e. the overall pattern of relationships between individual emoji items) property fitting analysis using a multi-dimensional scaling model was conducted based on the PROXSCAL procedure in SPSS. Proximities were calculated from the data based on Euclidian distance with data treated as interval level measurement. The underlying constructs themselves were assumed to be normally distributed (Norman, 2010); plots revealed that ‘happy’, ‘good about self’, ‘connected’, ‘relaxed’, ‘valued’ were normally distributed; ‘failure’, ‘lonely’, ‘sad’ were positively skewed and ‘anxious’, ‘bored’, were uniformly distributed.
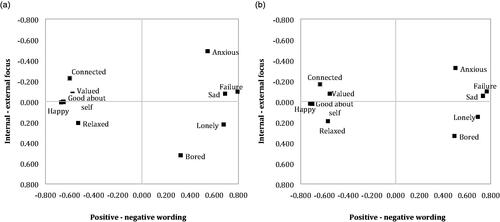
To determine the number of dimensions to include within the solution, a multistep process was used. First, the scree plot was reviewed. This showed two possible elbow positions at two and three dimensions with a reduction in Normalised Raw Stress (NRS) from 0.012 for the two-dimensional solution to 0.002 for the three-dimensional solution. This suggested that a two- or three-dimensional solution might be acceptable. Second, in line with the principle of maximising simplicity by using the fewest dimensions (Hair et al., Citation2014), it was decided to test a two-dimensional model and to only add a third dimension if other fit indices fell below the thresholds associated with ‘good fit’, or the solution could not be interpreted satisfactorily. The resultant two-dimensional model was found to have a good level of fit using a range of indices (S-Stress value = 0.063; Dispersion Accounted For = 0.995; Tucker’s Coefficient of Congruence = 0.998; Dugard et al., Citation2010). The two-dimensional visual representation () appears to show positively (‘Good about self’) versus negatively (‘Failure’) worded items on dimension 1, with dimension 2 representing an external (interpersonal) focus (‘Connected to others’) versus an internal (intrapersonal) focus (e.g. ‘Bored’). The positively worded items show a restricted dispersion across dimension 2 compared to the negatively worded items. This may represent a clearer distinction being made by participants between negatively worded concepts with positively worded items being more anchored to the centrally placed concept of ‘good about self’. Finally, the item configuration appears to show some construct poles (e.g. ‘Connected to others’ vs ‘Lonely’) and some item clustering (e.g. ‘Sad’, ‘Failure’; ‘Happy’, ‘Good about self’).
Figure 1. Smallest space common space plot (PROXSCAL) showing relationships between the ECMES items in study 1 (a) and in study 2 (b).
The convergent validity of the ECMES items was examined through the relationships between emoji items and the existing psychometric measures. As can be seen in , all emoji items correlated significantly with each of the existing measures. The strongest relationships with existing measures were as predicted for four of the five areas (‘Connected to Others’ – ICS (community connection), r = .436; ‘Failure’ – BRS (resilience), r = −.527; ‘Good about self’ – SWEMWBS (wellbeing), r = .688; and ‘Anxiety’ – PHQ-A (anxiety), r = .743. With respect to the PHQ-D (depression) the relationship with ‘Sad’, whilst very strong (r = .625) was lower than the relationship between PHQ-D and ‘Happy’ (r = −.639) and PHQ-D and ‘Failure’ (−.644). ‘Bored’, which showed the weakest relationships with each of the measures, also held a somewhat separate position within the PROXSCAL analysis. Based on the findings reported here it may be possible to adopt a smaller number of emojis to index a range of psychosocial facets connected with mental health and wellbeing.
Table 3. Relationship between individual emojis and existing psychometric measures.
Study 2
Aim
This study aimed to further examine the structure of the scale, and assess its stability over time and sensitivity to change.
Method
Research design
Data were collected at two time points (three to five weeks apart) to assess the stability and sensitivity to change of the new emoji measure.
Participants
Individuals attending a structured six or eight week (one day per week) sustainable construction project (Down to Earth; Davies et al., Citation2020) for ‘disadvantaged’ and ‘hard to reach’ people during the period January 2018 to December 2019, were invited to participate (n = 415). The number of sessions offered were dictated by funding source; analysis showed no significant baseline differences between the 6 and 8 week group participants. In total, 389 provided some data with 212 providing complete data at the start of their involvement (Time 1) and again at the end (Time 2). Participants included young adults not in education, employment or training, and adults from a number of marginalized and hard to reach groups including asylum seekers and the long-term unemployed. All participants were over 16 with a mean age of 24.3 years. The sample were predominantly male (n = 277; 71%), none were currently in employment, and 68 (18%) spoke English as a second language (English language competence varied although this was not formally assessed). Of those providing full data at all time points, 21 (10%) spoke English as a second language; this group included individuals from Syria, El Salvador, Eritrea, Sudan, Iran, Iraq, Yemen and Vietnam.
Measures
To minimise the demand on participants, the ICS, PHQ-4, and ECMES were administered (see study 1 for details). Combined these measures required less than 5 minutes to complete. The ICS was included as part of a wider study whilst the PHQ-4 was used to enable sub-groups to be created (based on depression and anxiety screening) to further test the properties of the ECMES.
Procedure
Ethical approval was received from a university departmental ethics committee (Ref: 23916.1406). Participants were provided with written and verbal information about the study during an introduction briefing on day one. On day 2, those who provided informed consent were given a booklet containing each of the measures. Data were collected in the training room on-site at the start of day 2 (baseline) and on day 5 or 7 (post-intervention). These data collection points were selected from the 6 or 8 week programme respectively to a) allow for a gap between research information being given (session 1) and consent being obtained (session 2), and to reduce the impact of factors such as the anxiety of starting something new on the scores at baseline and b) reduce the impact of celebrations of achievements at the end of the course and possible sadness at the programme ending on the measures. All participants were informed that they could request support in the form of items being read to them although no formal record of who did/did not receive this support was recorded. Participants generated their own anonymous code to enable data to be linked across the two time points.
Results
At baseline participants in this study reported higher levels of anxiety and depression on the screening measure than those in previous published data although these were broadly consistent with the levels reported in study 1 (see , study 2).
Gender
At baseline there were no differences in scores by gender for the ICS, however, women (M = 2.56) reported significantly higher anxiety than men (M = 1.84) (t[1,285] = −2.63; p = .009) and depression (t[1,286] = −2.594; p = .010; women, M = 2.28; men, M = 1.63).
Examination of the ECMES
Again, mean scores on the ECMES were around the centre-point of 3, with a slight skew toward positive feelings with none of the items displaying extreme values (see , study 2).
The data from time 1 was again subject to property fitting analysis using a multidimensional scaling model (the PROXSCAL procedure in SPSS) based on the same assumptions and processes described in study 1. Again, the resultant two-dimensional model was found to have good level fit using a range of indices (S-Stress value = 0.003; Dispersion Accounted For = 0.997; Tucker’s Coefficient of Congruence = 0.998; Dugard, Todman & Staines, Citation2010). The two-dimensional visual representation () is broadly consistent with that from study 1 (i.e. separation according to dimension 1; relative position on dimension 2; similar orientation of emerging ‘construct poles’).
Sensitivity to change over time and test-retest stability
In order to further investigate the properties of the ECMES, sensitivity to change over time and test-retest stability were investigated.
The sample as a whole showed significant reductions in anxiety (t [1, 211] = 4.066; p < .001) and depression (t[1, 211] = 2.185; p = .03) between baseline and time 2. Significant changes were also noted on a number of emojis over time (see , upper section).
Table 4. Sensitivity to change and stability over time.
In order to examine test-retest reliability (stability of measurement over time) data from only those with a PHQ-4 total score in the ‘normal – mild’ range (0-5; Kroenke et al., Citation2009) was analysed. Given their baseline scores, little change in emoji ratings was expected in this group over time (those with higher levels of anxiety or depression at baseline might be expected to change over time – see above finding). As can be seen in the lower section of , this was indeed the case with the exception of ‘Bored’ where a significant reduction was observed. This may be accounted for by all participants having been actively engaged in a programme of sustainable construction over the proceeding weeks.
Discussion
The studies reported here provide robust initial evidence for the use of a short emoji-based tool with minimal literacy requirements for the measurement of a range of psychosocial domains including aspects of mental health, well-being, community connection and resilience. The brevity and ease of use of this tool is likely to make it of particular interest for use in non-clinical settings, especially where measuring the service impact on participants/attendees is an ancillary focus (e.g. Davies et al., Citation2020).
Across the two studies the structure of the ECMES was broadly consistent suggesting stability of the concepts in different groups and using different delivery methods (pen & paper and online). In addition, the measure showed sensitivity to detecting change over time (in keeping with overall changes in participants’ anxiety and/or depression symptoms), with test-retest stability demonstrated amongst those with normal or mild mental health symptoms at baseline. The stability of the measure across two different delivery methods is consistent with previous literature examining such equivalence (e.g. Weigold et al., Citation2013) and provides reassurance that the way respondents complete the measure can be configured to fit within the setting. For example, in order to minimise the burden on participants and those collecting data a version for use on a tablet or smartphone is currently in development and will be available from the authors upon request.
The validity of the emoji measure was determined by a) exploring the theoretical coherence of the relationships between individual emojis and b) examining the relationships between individual emojis and a series of concurrent psychometric measures. The analysis of the relationships between the emoji items revealed two distinct clusters on dimension 1, broadly characterised as ‘positive or pleasant’ to ‘negative or unpleasant’ concepts (left to right) with ‘happy’ and ‘failure’ representing the extremes of this dimension. The sequencing of the concepts on dimension 2 is consistent across the two studies with a possible underlying construct of interpersonal to intrapersonal across this dimension. Possible concept clusters (e.g. sad, failure; happy, good about self) suggests these emojis and their underlying concepts are closely related, with some construct poles (Kelly, Citation1963) such as Anxious – Relaxed and Connected – Lonely evident within the common space plots. However, whilst the emojis generally showed some differentiation, the high degree of overlap between ‘Happy’ and ‘Good about self’ may reflect the similarity between the emoji representations (differences only in the ‘eyes’ of the emoji) and their consecutive placement on the response form. It may therefore be possible to remove one of these emoji items without loss to the ability of the scale to represent psychosocial wellbeing.
Whilst all the correlations between emojis and existing measures were statistically significant, many of these relationships were weak (i.e. <0.4). However, when we take only the strongest relationships, key associations are revealed i.e. ‘Connected to others’ and ICS; ‘A failure’ and BRS; ‘A failure’ and PHQ-D; ‘Anxious’ and PHQ-A. Further, given the multifaceted nature of well-being (e.g. Forgeard et al., Citation2011) it is unsurprising that all of the emoji items show strong relationships to the well being measure.
Although the full ten emoji items are worthy of further research, where further brevity is required it appears from the findings here that the number of emojis could be halved whilst retaining a breadth of measurement areas. Of these, four are suggested because of their relationship to measures of specific domains (i.e. Good about myself – wellbeing; Connected to others – community connection; Anxious – anxiety; A failure – resilience (reversed) and depression) and the fifth - Bored, because of it’s potential to measure a facet not represented by the other emojis.
Whilst study 2 included individuals with literacy difficulties and English as a second language, these groups were not analysed separately. Future work should develop this area more explicitly as well as extending to other groups/populations (e.g. children and young people). Additionally, future research could include other concurrently delivered tools and indices of functioning to further investigate the reliability and validity of the ECMES. Finally, extending the scale (from 5 points to 7 or 10 points) could be useful to increase item variance and potential sensitivity to change.
Conclusion
The emoji measure introduced here provides a potential tool for use in settings where brevity of measurement needs to be combined with ease of use. This may be in situations where time is limited, the context does not facilitate traditional assessment or where engagement with measurement or literacy may be a problem for participants. The promise of this tool now needs to be explored further to establish the properties and utility of the scale with other participant groups.
Acknowledgements
The authors thank all the participants who took part and the National Lottery Community Fund, Natural Resources Wales and the BUPA UK Foundation for funding the programmes delivered within Study 2.
Disclosure statement
MM is the co-founder and director of Down to Earth and JB and KD are employed by Down to Earth.
References
- Akena, D., Joska, J., & Stein, D. (2018). Sensitivity and specificity of the Akena Visual Depression Inventory (AViDI-18) in Kampala (Uganda) and Cape Town (South Africa). The British Journal of Psychiatry, 212(5), 301–307. https://doi.org/10.1192/bjp.2018.9
- Arrieta, J., Aguerrebere, M., Raviola, G., Flores, H., Elliott, P., Espinosa, A., Reyes, A., Ortiz-Panozo, E., Rodriguez-Gutierrez, E. G., Mukherjee, J., Palazuelos, D., & Franke, M. F. (2017). Validity and utility of the Patient Health Questionnaire (PHQ)-2 and PHQ-9 for screening and diagnosis of depression in Rural Chiapas, Mexico: a cross-sectional study. Journal of Clinical Psychology, 73(9), 1076–1090. https://doi.org/10.1002/jclp.22390
- Bai, Q., Dan, Q., Mu, Z., & Yang, M. (2019). A systematic review of emoji: Current research and future perspectives. Frontiers in Psychology, 10, 2221. https://doi.org/10.3389/fpsyg.2019.02221
- Bradley, M. M., & Lang, P. J. (1994). Measuring emotion: the self-assessment manikin and the semantic differential. Journal of Behavior Therapy and Experimental Psychiatry, 25(1), 49–59.
- Breen, J. (2017). Adapting the GAD-7 and PHQ-9 clinical measures for people with learning disabilities. [Unpublished Doctoral Thesis]. Royal Holloway, University of London.
- Chmitorz A., Wenzel M., Stieglitz R.D., Kunzler A., Bagusat C., et al. (2018) Population-based validation of a German version of the Brief Resilience Scale. PLoS One 13(2), e0192761. https://doi.org/10.1371/journal.pone.0192761
- Davies, J., McKenna, M., Bayley, J., Denner, K., & Young, H. (2020). Using engagement in sustainable construction to improve mental health and social connection in disadvantaged and hard to reach groups: a new green care approach. Journal of Mental Health (Abingdon, England), 29(3), 350–357.
- Dugard, P., Todman, J., & Staines, H. (2010). Approaching multivariate analysis. A practical introduction (2nd ed.). Routledge.
- Ekman, P. (1994). All emotions are basic. In P. Ekman & R.J. Davidson (eds). The nature of emotion: fundamental questions. Oxford University Press.
- Fitzpatrick, K. M., & LaGory, M. (2011). Unhealthy cities: Poverty, race, and place in America. Routledge.
- Forgeard, M. J. C., Jayawickreme, E., Kern, M. & Seligman, M. E. P. (2011). Doing the right thing: Measuring wellbeing for public policy. International Journal of Wellbeing, 1(1), 79–106. https://doi.org/10.5502/ijw.v1i1.15
- Hair, J. F., Black, W. C., Babin, B. J., Anderson, R. E., & Tatham, R. L. (2014). Pearson new international edition. Multivariate data analysis (7th ed.). Pearson Education Limited Harlow.
- Haver, A., Akerjordet, K., Caputi, P., Furunes, T., & Magee, C. (2015). Measuring mental well-being: A validation of the Short Warwick-Edinburgh Mental Well-Being Scale in Norwegian and Swedish. Scandinavian Journal of Public Health, 43(7), 721–727. https://doi.org/10.1177/1403494815588862
- Kelly, G. A. (1963). A theory of personality: The psychology of personal constructs. WW Norton & Company.
- Kralj Novak, P., Smailović, J., Sluban, B., & Mozetič, I. (2015). Sentiment of Emojis. PloS One, 10(12), e0144296. https://doi.org/10.1371/journal.pone.0144296
- Kroenke, K., Spitzer, R. L., Williams, J. B. W., & Löwe, B. (2009). An ultra-brief screening scale for anxiety and depression: The PHQ-4. Psychosomatics, 50(6), 613–621. https://doi.org/10.1016/S0033-3182(09)70864-3
- Letourneau, N. L., Duffett-Leger, L., Levac, L., Watson, B., & Young-Morris, C. (2013). Socioeconomic status and child development: A meta-analysis. Journal of Emotional and Behavioral Disorders, 21(3), 211–224. https://doi.org/10.1177/1063426611421007
- Mashek, D., Cannaday, L. W., & Tangney, J. P. (2007). Inclusion of community in self scale: A single-item pictorial measure of community connectedness. Journal of Community Psychology, 35(2), 257–275. https://doi.org/10.1002/jcop.20146
- Maughan, B., & Carroll, J. (2006). Literacy and mental disorders. Current Opinion in Psychiatry, 19(4), 350–354. https://doi.org/10.1097/01.yco.0000228752.79990.41
- McManus S., Bebbington P., Jenkins R., Brugha T. (eds.) (2016). Mental health and wellbeing in England: Adult Psychiatric Morbidity Survey 2014. NHS Digital.
- Melzack, R. (1975). The McGill pain questionnaire: major properties and scoring methods. Pain, 1(3), 277–299. https://doi.org/10.1016/0304-3959(75)90044-5
- Ng Fat, L., Scholes, S., Boniface, S., Mindell, J., & Stewart-Brown, S. (2017). Evaluating and establishing national norms for mental wellbeing using the short Warwick–Edinburgh Mental Well-being Scale (SWEMWBS): Findings from the Health Survey for England. Quality of Life Research: An International Journal of Quality of Life Aspects of Treatment, Care & Rehabilitation, 26(5), 1129–1144. https://doi.org/10.1007/s11136-016-1454-8
- Organisation for Economic Co-Operation and Development (2016). Building Skills for All: A Review of England. http://www.oecd.org/education/skills-beyond-school/building-skills-for-all-review-of-england.pdf
- Puertas, G., Patel, V., & Marshall, T. (2004). Are visual measures of mood superior to questionnaire measures in non-Western settings? Social Psychiatry and Psychiatric Epidemiology, 39(8), 662–666. https://doi.org/10.1007/s00127-004-0800-2
- Sen, P., Arugnanaseelan, J., Connell, E., Katona, C., Khan, A. A., Moran, P., Robjant, K., Slade, K., Tan, J., Widyaratna, K., Youd, J., & Forrester, A. (2018). Mental health morbidity among people subject to immigration detention in the UK: a feasibility study. Epidemiology and Psychiatric Sciences, 27(6), 628–637. https://doi.org/10.1017/S2045796017000269
- Smith, B. W., Dalen, J., Wiggins, K., Tooley, E., Christopher, P., & Bernard, J. (2008). The Brief Resilience Scale: Assessing the ability to bounce back. International Journal of Behavioral Medicine, 15(3), 194–200. https://doi.org/10.1080/10705500802222972
- Snowling, M. J., Adams, J. W., Bowyer-Crane, C., & Tobin, V. (2000). Levels ofliteracy among juvenile offenders: The incidence of specific reading difficulties. Criminal Behaviour and Mental Health, 10(4), 229–241. https://doi.org/10.1002/cbm.362
- Stewart-Brown, S., Tennant, A., Tennant, R., Platt, S., Parkinson, J., & Weich, S. (2009). Internal construct validity of the Warwick-Edinburgh Mental Well-beingScale (WEMWBS): a Rasch analysis using data from the Scottish Health Education Population Survey. Health and Quality of Life Outcomes, 7, 15. https://doi.org/10.1186/1477-7525-7-15
- UNESCO (2015). Adult and Youth Literacy. http://uis.unesco.org/sites/default/files/documents/fs45-literacy-rates-continue-rise-generation-to-next-en-2017_0.pdf
- Unicode Consortium (2019). UCD: Emoji Data for UTR #51. https://unicode.org/Public/emoji/12.0/emoji-data.txt
- Weigold, A., Weigold, I. K., & Russell, E. J. (2013). Examination of the equivalence of self-report survey-based paper-and-pencil and internet data collection methods. Psychological Methods, 18(1), 53–70.