
Abstract
Purpose: To investigate how well visually impaired individuals can learn to use mobility scooters and which parts of the driving task deserve special attention.
Materials and methods: A mobility scooter driving skill test was developed to compare driving skills (e.g. reverse driving, turning) between 48 visually impaired (very low visual acuity = 14, low visual acuity = 10, peripheral field defects = 11, multiple visual impairments = 13) and 37 normal-sighted controls without any prior experience with mobility scooters. Performance on this test was rated on a three-point scale. Furthermore, the number of extra repetitions on the different elements were noted.
Results: Results showed that visually impaired participants were able to gain sufficient driving skills to be able to use mobility scooters. Participants with visual field defects combined with low visual acuity showed most problems learning different skills and needed more training. Reverse driving and stopping seemed to be most difficult.
Conclusions: The present findings suggest that visually impaired individuals are able to learn to drive mobility scooters. Mobility scooter allocators should be aware that these individuals might need more training on certain elements of the driving task.
Visual impairments do not necessarily lead to an inability to acquire mobility scooter driving skills.
Individuals with peripheral field defects (especially in combination with reduced visual acuity) need more driving ability training compared to normal-sighted people – especially to accomplish reversing.
Individual assessment of visually impaired people is recommended, since participants in this study showed a wide variation in ability to learn driving a mobility scooter.
Implications for rehabilitation
Introduction
Mobility scooters are powered mobility devices that can enhance independent mobility in individuals with motor problems [Citation1]. In Europe, Great Britain and the Netherlands are the leading countries with approximately 200,000–300,000 mobility scooter users. Mobility scooters have been shown to increase activities, community participation and independent living of users, thereby preventing negative consequences of restricted mobility [Citation2,Citation3]. They are especially important for medium distances (1.0–7.5 km) in daily life, for example to visit family and friends, to keep a doctor’s appointment, or to go shopping [Citation1].
Since mobility scooters are mainly used by elderly people, most users are likely to have more than just one health issue. Comorbid disorders other than motor impairment can influence the safe use of mobility scooters, and, depending on the seriousness of the comorbidity, they can even prevent individuals from driving them. Since the occurrence of visual impairment increases with age, visual impairment is a common comorbidity among elderly mobility scooter users. Visual impairment has been shown to influence the safe use of motor vehicles in fast traffic (i.e., cars). Therefore, legal standards of vision for driving have been introduced for the use of cars (visual acuity >0.5, visual field >120°), but in contrast, there are no such regulations for the use of mobility scooters in most countries. A driving licence is neither required. The absence of legal standards of vision for driving for mobility scooters has advantages, since these vehicles are meant to support and optimize independent mobility [Citation4]. Not being able to use their mobility scooter might be detrimental for affected individuals [Citation5], since restricted mobility is related to a lower quality of life [Citation6–8]. A disadvantage of the absence of standards of vision for driving a mobility scooter is that individuals with a visual impairment or professionals advising them may be uncertain about the question whether it is safe to participate in traffic. This uncertainty may lead to a dilemma for professionals: Advising or perhaps training the use of a mobility scooter for a visually impaired individual at the risk of decreasing traffic safety, or advising against the use of a mobility scooter at the risk of unnecessarily limiting a visually impaired individual’s independent mobility. For this reason, it is important to study mobility scooter driving safety in visually impaired individuals.
When investigating driving safety, it is important to distinguish three concepts: fitness to drive, driving ability and driving behavior. Fitness to drive is defined as the medical requirements to learn and execute the driving task (e.g. visual, cognitive or motor abilities). Low visual acuity, for example, can hinder drivers to read traffic signs; a paresis in one arm has consequences for steering a vehicle. Driving ability refers to the declarative and procedural knowledge of driving (i.e., operation of vehicle); in other words, a typical driving test for novice drivers focuses particularly on these elements to determine how well the driving task has been learned [Citation9]. Driving behavior describes how a driver chooses to behave in a certain traffic situation (i.e. keeping or exceeding maximum speed, driving slower in busy traffic). Especially in mobility scooters, driving ability needs to be assessed in inexperienced drivers before deciding on the role of fitness-to-drive on driving safety. For people with impairments, failing to assess driving ability increases the risk of attributing difficulties to the impairment rather than to an underdeveloped driving ability and puts these people at disadvantage. Particularly, the counterintuitive operation in mobility scooters (releasing the forward lever instead of actively pressing a lever to brake) makes training and assessment of driving ability necessary. This line of thought is illustrated by Schepers [Citation1], who reported that the main reasons for accidents in the Netherlands are precariously high speeds when driving around corners or mistakes in operation of the mobility scooters. These examples describe failures in driving ability or driving behavior rather than inadequate fitness to drive. Accordingly, Nitz [Citation10] showed that more than half of the healthy novice mobility scooter drivers participating in her study had difficulties with at least one of the driving task, but improved after a number of training sessions.
In the public literature, no study has yet investigated driving ability in visually impaired individuals in mobility scooters. Due to their impairment, visually impaired individuals might need more training or specifically directed training; yet, there is no widely accepted approach in how to test and train mobility scooter driving ability in these individuals. Therefore, we performed an extensive experiment looking at different factors that are related to the driving safety of visually impaired individuals in mobility scooters. The present study specifically focused on the driving ability by assessing how well visually impaired individuals were able to learn to use mobility scooters compared to a group of normal-sighted controls. To measure driving ability, a driving skill test that included a short instruction and training of several driving skills was used. Furthermore, it was investigated which elements of the driving task deserved special attention in further training.
A number of studies have shown that anxiety can impact performance in mobility tasks [Citation11–13]. Especially visually impaired people are often reported to experience more anxiety than normal sighted people in corresponding age groups [Citation14] which includes responding with distress and fear in (unknown) mobility situations [Citation11,Citation15]. Previous driving experience in motor vehicles and experienced anxiety were therefore taken into account to explore the potential influence of these factors on driving performance.
Materials and methods
The experiment was conducted at the University Medical Centre Groningen, the Netherlands (UMCG), and was part of a larger project, Mobility4all, which investigates different factors that might influence driving safety of visually impaired individuals participating in slow motorized traffic. The content of the present study focuses on testing the mobility scooter driving ability.
Participants
Forty-eight visually impaired participants and 37 healthy controls took part in the experiment. Visually impaired participants were divided into four different groups: low visual acuity, very low visual acuity, peripheral field defects, and a group with multiple visual impairments, consisting of participants with central visual field defects or a combination of peripheral field defects and low visual acuity (). Categorization of participants was based on the measured visual acuity and the visual field. An independent orthoptist calculated the visual field score (VFS), a quantity that focuses on the consequences of visual field loss rather than its causes [Citation16,Citation17]. It expresses the severity of a visual field loss in terms of mobility limitations by assigning a score to the different quadrants of the visual field. Fifty percent more weight is given to the lower quadrants, since these parts are more important for mobility. The VFS is based on the III-4e isopter of the Goldmann perimeter, using a standardized overlay grid by Langelaan et al. [Citation18]. In total, 100 points can be achieved covering a field with an average radius of 60°. In this experiment, maximum 60 points are given to the central visual field (20°), the peripheral visual field has a maximum of 40 points. Inclusion criteria were a score of less than 50 points for the central visual field (out of 60 possible points), and less than 30 points (out of 40 possible points) for the peripheral visual field. Visually impaired participants did not significantly differ from normal-sighted controls with regard to age, level of education [Citation19] and general cognitive functioning (). Normal-sighted controls had more driving experience with motorized vehicles than visually impaired participants.
Table 1. Visual characteristics per group.
Table 2. Participants’ characteristics.
Participants were recruited via newsletters of rehabilitation clinics, patient organizations, and local newspapers. Suitable participants needed to be between 50 and 75 years of age and fell into the categories as described in . All 85 participants had never driven a mobility scooter before. Exclusion criteria were the existence of neurological disorders (e.g., acquired brain damage, dementia), psychiatric disorders that influence traffic safety (e.g., psychosis), severe motor problems that hinder the operation of a mobility scooter (i.e., tremor), severe hearing problems or deafness, alcohol and drug addiction, or disturbed eye movements. The experiment was approved by the Ethical Committee Psychology of the University of Groningen, the Netherlands, according to the Declaration of Helsinki (2013). All participants provided written informed consent.
Visual function assessment
Visual function was assessed before the mobility scooter driving instruction. These measurements were executed binocularly at 500 lux. Visual acuity was assessed using the Early Treatment Diabetic Retinopathy Study (ETDRS) 2000 letter chart [Citation20]. Contrast sensitivity was measured by the Gecko contrast sensitivity test [Citation21]. The III-4e-isopter of the Goldmann perimeter was used to determine the size of the visual field.
Mobility scooter
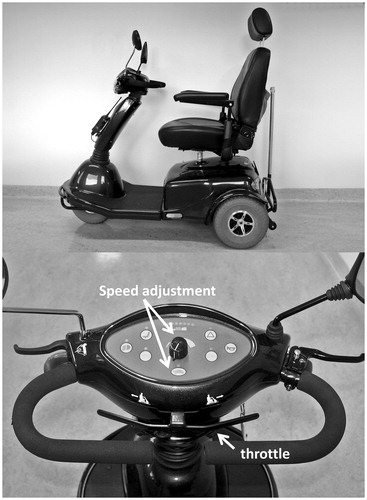
For the mobility scooter driving skill test, the most commonly used mobility scooter in the Netherlands, a 3-wheeled mobility scooter with a maximum speed of 15 km/h, was used (Excel Excite 3 Galaxy). Both accelerating and decelerating are regulated by a finger-controlled lever () similar to a bicycle brake. The lever works on a see-saw principle: Pulling the right lever has the same effect than pushing the left lever and vice versa. Pulling/pushing the lever harder will increase the speed of the mobility scooter. To drive forwards, the right lever is pulled (or left is pushed), to drive backwards, the left lever is pulled (or right is pushed). The mobility scooter has an electro-mechanical dynamic, regenerative braking system (pulling/pushing the lever disables the brakes). When the lever is released, the mobility scooter slows down and stops. Braking is therefore not an active process as people are used to on bicycles, for example. Furthermore, maximum speed can be regulated by pressing the “turtle-button” (for low maximum speeds up to 6 km/h suitable for driving on the sidewalk) and/or turning a knob on the dashboard.
Figure 1. Mobility Scooter (above) and finger-operated throttle (below).
Mobility scooter driving skill test
The driving skill test took place in a relatively quiet part of the UMCG and lasted maximum 15 minutes. It consisted of 15 elements that were based on the official national mobility scooter course developed by “Blijf Veilig Mobiel [Staying Mobile Safely]” [Citation22], a governmental supported national community of interest aiming for safe mobility in the Netherlands. It included elements such as driving straight ahead, reversing, accelerating or stopping on time (Table S1). The elements “stopping”, “reversing around a corner” and “driving through a narrow opening” were practiced more than once since these elements were described as challenging by mobility scooter experts. The internal consistency of the test as we created it was acceptable (α = 0.77). All participants received a detailed explanation on the operation of the mobility scooter before they started the driving skill test. The participants were accompanied by an instructor and a trained research assistant who acted as an observer. For safety purposes, the instructor was equipped with a remote control to be able to stop the mobility scooter at any time.
Evaluation
The observer rated performance on each element of the driving skill test on a three-point scale [Citation22], representing good (1), satisfactory (2) and insufficient (3) performance (Table S1). For each individual, ratings of the first attempt were added up to sum-scores representing overall performance. Sum-scores could range from 15 (best) to 45 (worst). During the training, the instructor was blind to the assistant’s evaluation. Extra practice of an element was given if the instructor was not convinced that performance was sufficient to continue with an on-road driving test at a later stage of this experiment or if the participant indicated to feel insecure about that particular element/skill. The number of repetitions on each element were registered by the observer.
STAI
Participants were asked to fill in the State Trait Anxiety Inventory (STAI) [Citation23] to determine their level of anxiety during the mobility scooter drive. This inventory consists of two parts: the Trait-Anxiety scale, to assess how people generally feel, and the State-Anxiety scale, to measure how people feel at a particular moment. Both parts of the STAI consist of 20 items that are scored on a 4-point scale. Scores can range from 20 to 40, with higher scores representing more anxiety. Participants of the present study completed the Trait-Anxiety Scale at home, whereas the State-Anxiety Scale was filled in after the mobility scooter drive.
Statistical analysis
The Statistical Package for the Social Sciences (SPSS, Inc., Chicago, IL, version 22) was used for data analysis. Driving ability was operationalized as the sum-scores of the first attempt (overall performance) and the number of repetitions. The correlation between these two variables was moderate (r = 0.459, p < 0.001), showing only partial overlap. Therefore, the variables were analyzed independently. The overall performance was calculated by summing up the score of the different elements and was then compared between the different groups. Post hoc comparisons were only executed between normal-sighted controls and the four groups of visually impaired individuals. Since the assumptions for parametric tests were not met, nonparametric tests (Kruskal–Wallis, Mann–Whitney U-test) were executed to investigate differences between groups. The significance level was preset at α = 0.05. To keep a conservative approach toward driving safety, we decided not to correct for type-I error for multiple comparisons. In addition to the overall performance, the need of additional repetitions was compared between the five groups using a chi-square statistic and the number of repetitions per element were explored.
Additional analysis
The maximum number of years of driving experience in a motor vehicles (car, motorcycle, moped, etc.) was noted and correlated with the overall performance. In addition to that, years of driving experience was compared between participants who needed extra repetitions and participants who did not need extra repetition using the Mann–Whitney U-test. Concerning the measurement of anxiety, both the score on the Trait and the State Anxiety Scale were compared between visually impaired participants and normal-sighted controls using t-tests. The State-Anxiety Scale was further correlated with the overall performance on the driving skill test, and the level of anxiety was compared between participants who needed extra repetitions and participants who did not need extra repetition. For this purpose, a Mann–Whitney U-test was used.
Results
Overall performance on mobility scooter practice
Comparison of all five groups did not yield a statistically significant difference between the groups (H(4) = 8.01, p = 0.091). Post hoc tests showed that individuals with multiple visual impairments performed worse than normal-sighted controls. Participants with peripheral field defects performed slightly, but not significantly, worse than normal sighted controls. Individuals with (very) low visual acuity did not differ significantly from normal-sighted controls. Effect sizes were small to medium ().
Table 3. Descriptive statistics and comparisons between controls and visually impaired on overall performance on the driving skill test.
Repetitions
An explorative analysis showed that individuals with multiple visual impairments needed most repetitions on the elements of the driving skill test, followed by individuals with peripheral field defects and individuals with a low visual acuity (). Comparison of the five groups revealed a significant difference (χ2 (4) = 10.79, p = 0.029). Post hoc analysis showed that more participants with multiple visual impairments and less normal-sighted participants have to repeat certain elements of the practice drive than expected ().
Figure 2. Percentages of participants per group who needed repetitions.
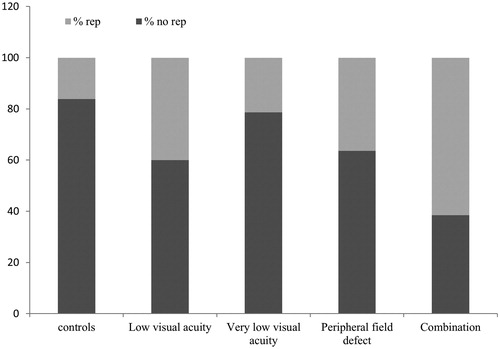
Table 4. Comparison per group how often repetition was needed or not.
Explorative analysis of the different elements of the driving skill test appeared to show that driving backwards, driving backwards around the corner and stopping seemed to be the most difficult elements (). Participants with multiple visual impairments needed most repetitions on these elements.
Table 5. Number of repetitions per element of the mobility scooter driving skill test.
Additional analyses
Driving experience
Driving experience was not associated with the overall performance on the driving skill test within the group of visually impaired participants (r= −0.045, p = 0.760). There is no statistically significant difference in the years of driving experience between visually impaired participants who do (Median = 25.0) or do not (Median = 25.0) need extra repetitions on the driving instruction (U = 215.5, p = 0.205). The effect size was small (r= −0.18).
STAI
Visually impaired participants (M = 35.53, SD = 8.14) experienced significantly more general anxiety compared to normal-sighted controls (M = 31.05, SD = 5.74; U = 585.5, p = 0.010, r= −0.28). Visually impaired participants showed somewhat more anxiety after the mobility scooter drive; however, this difference was not significant (Mvisimp = 28.11, SDvisimp = 7.19; Mcontr = 25.14, SDcont = 4.70; U = 659.0, p = 0.084, r= −0.18). Comparison of the experienced anxiety after the driving skill test (STAI State) between visually impaired participants who needed extra repetitions (Median = 30.0) and those who did not need extra repetition (Median = 24.0), resulted in a significant difference (U = 171.0, p = 0.038, r= −0.30). Visually impaired participants in need of more repetitions experienced more anxiety after the driving skill test. However, visually impaired participants who needed more repetitions were not significantly more anxious in general (STAI Trait, MedianRep = 36.0; MedianNorep = 36.0; U = 255.5, p = 0.820, r = 0.03) Furthermore, worse overall performance was associated with elevated anxiety after the mobility scooter drive (r = 0.244, p = 0.026), but not with anxiety in general.
Discussion
Goal of the present study was to investigate mobility scooter driving ability in visually impaired individuals and to identify elements of the driving task that need special attention in visually impaired people. We showed that both visually impaired individuals and normal-sighted controls were able to learn to use mobility scooters without any prior experience and after getting only a short instruction. Visually impaired individuals needed more attention and training with certain elements depending on their impairment; specifically participants with multiple visual impairments showed difficulties and needed more time to acquire sufficient driving ability. Reversing seemed to be a difficult element amongst all participants, but especially for participants with multiple visual impairments. This observation is comparable to the results of Nitz [Citation10], who described reversing in mobility scooters as one of the most difficult tasks. One reason why reversing is in particular difficult for participants with visual field defects could be that the restricted visual field makes it especially difficult to see the visual scene behind them. Another difficult element appeared to be stopping on time. Rather than being related to visual impairment, this difficulty was based on the operation of the scooter. Since the mobility scooter could not actively be stopped, it was difficult to judge when the vehicle came to a halt. Problems with stopping thus seemed to be mainly dependent on the degree of driving ability, whereas difficulties with reversing appeared to depend both on driving ability and visual impairment.
Although we could observe variation in performance between the participants, we cannot predict someone’s driving ability solely from type or severity of one’s visual impairment. There was only one participant (visual acuity ≈ 0.03, VFS <12) who was not able to master the majority of the elements (i.e., unable to drive straight ahead, constantly bumping into walls). His visual impairment prevented him to walk independently without a human guide which could be an indication that he could not drive mobility scooters independently either. The common belief that people with visual impairments in general cannot learn to drive a mobility scooter is therefore challenged. On the contrary, to purely measure fitness-to-drive, one has to show sufficient driving ability, otherwise an impairment (which often does not have much scope to improve) could be wrongly seen as the reason for poor driving performance, whereas insufficient driving ability (which can be trained easily) is the underlying cause. Sufficient driving ability is thus a basic requirement to be able to participate safely in traffic. However, fitness to drive and driving behavior play a role in safe traffic participation and should be investigated as well. Therefore, we cannot predict how visually impaired individuals actually perform in on-road traffic situations and give advice to mobility scooter allocators solely based on this experiment.
Other individual differences might explain the variance in performance. Contrary to our expectations, visually impaired individuals with more driving experience in other motor vehicles did not instantly perform better on the mobility scooter driving skill test. Maneuvering a mobility scooter seems to be different from driving other vehicles and might not affect how well individuals can learn to drive mobility scooters [Citation10]. With regard to the anxiety experienced, it was shown that visually impaired individuals who performed worse on the driving skill test experienced more anxiety than visually impaired individuals who performed better. Previous research has shown that anxiety can influence performance [Citation11–13,Citation15]. In the present study, though, it is not entirely clear whether anxiety lead to worse performance on the mobility scooter driving skill test or whether worse driving performance evoked more feelings of anxiety. Apart from driving experience and anxiety, factors such as age, personality, or compensation strategies might play a role and should be further investigated in future studies.
A number of limitations of our study should be noted. First, due to our small group size, we were not able to statistically explore differences between the groups in more detail. The sample size could also be an explanation for the fact that not all explored differences were statistically significant. Second, the shortened and partially adapted version of the official mobility scooter course in the Netherlands [Citation22] has not been formally validated. The overall good performance could be a sign of a ceiling effect and might have decreased the true difference between visually impaired and normal-sighted participants. Constructing a more complex driving ability test might increase differences between the two groups. Third, the age range in our study is limited. Younger or older individuals with visual impairment could have less or more difficulties acquiring driving ability due to better or worse cognitive functioning.
This study is the first step to explore mobility scooter driving safety in visually impaired individuals. We showed that visually impaired people are able to learn driving mobility scooters, however, we cannot make predictions about on-road driving safety yet. Allocators of mobility scooters should bear in mind though that a visual impairment does not necessarily mean that driving skills cannot be acquired. Novice mobility scooter users with visuals impairments were able to maneuver the scooters as well as normal-sighted controls when training was increased. Especially, stopping and reversing are skills that need more attention. To be able to confidently make recommendations about mobility scooter allocation, future research needs to explore how individuals with visual impairment perform in real-life situations.
Cordes_et_al_D_R_CCordes_TIDS-05-2016-016_supplement_resubmission.pdf
Download PDF (394.9 KB)Acknowledgements
The authors thank all participants who took part in this study, Linda Schultinga for analyzing the visual data, and Hans van Ieperen, Sanne Dellemijn and Peter Noort for assisting with data collection. We further wish to thank Veilig Verkeer Nederland for giving us permission to use the Mobility Scooter Course Booklet for our research and the reviewers for their valuable comments and suggestions.
Disclosure statement
The authors report no declarations of interest. The authors alone are responsible for the content and writing of this article.
Additional information
Funding
Related Research Data
References
- Schepers JP. Gemotoriseerde voertuigen voor mensen met een beperkte mobiliteit [Motorised vehicles for people with limited mobility]. Ministry Transp Public Work Water Manage. 2007. p. 1–46.
- Auger C, Demers L, Gélinas I, et al. Powered mobility for middle-aged and older adults: systematic review of outcomes and appraisal of published evidence. Am J Phys Med Rehabil. 2008;87:666–680.
- Edwards K, McCluskey A. A survey of adult power wheelchair and scooter users. Disabil Rehabil Assist Technol. 2010;5:411–419.
- Letts L, Dawson D, Kaiserman-Goldenstein E. Development of the power-mobility community driving assessment. Can J Rehab. 1998;11:123–129.
- Oxley J, Whelan M. It cannot be all about safety: the benefits of prolonged mobility. Traffic Inj Prev. 2008;9:367–378.
- Williams G, Willmott C. Higher levels of mobility are associated with greater societal participation and better quality-of-life. Brain Inj. 2012;26:1065–1071.
- Ragland DR, Satariano WA, MacLeod KE. Driving cessation and increased depressive symptoms. J Gerontol A Biol Sci Med Sci. 2005;60:399–403.
- Carp FM. Significance of mobility for the well-being of the elderly. Transp an Aging Soc Improv Mobil Saf Older Pers. 1988;2:1–20.
- Selander H. Driving assessment and driving behaviour [dissertation]. Jönköping: Jönköping University; 2012.
- Nitz JC. Evidence from a cohort of able bodied adults to support the need for driver training for motorized scooters before community participation. Patient Educ Couns. 2008;70:276–280.
- Welsh RL. Psychosocial dimensions of orientation and mobility. In: Wiener, WR, Welsh, RL, Blasch BB, editor. Foundations of orientation and mobility Vol 1. New York: American Foundation for the Blind; 2010; 173–210.
- Fairclough SH, Tattersall AJ, Houston K. Anxiety and performance in the British driving test. Transp Res Part F Traffic Psychol Behav. 2006;9:43–52.
- Wilson M, Smith NC, Chattington M, et al. The role of effort in moderating the anxiety-performance relationship: testing the prediction of processing efficiency theory in simulated rally driving. J Sports Sci. 2006;24:1223–1233.
- Kempen GIJM, Ballemans J. The impact of low vision on activities of daily living, symptoms of depression, feelings of anxiety and social support in community-living older adults seeking vision rehabilitation services. Qual Life Res. 2012;21:1405–1411.
- Zijlstra GAR, Ballemans J, Kempen GIJM. Orientation and mobility training for adults with low vision: a new standardized approach. Clin Rehabil. 2012;27:3–18.
- Colenbrander A. Measuring vision and vision loss. Duane’s Ophthalmol. 2009;5:1–42.
- Colenbrander A. Visual standards: Aspects and ranges of vision loss with emphasis on population surveys. International Congress of Ophthalmology; Sydney, Australia; 2002.
- Langelaan M, Wouters B, Moll AC, et al. Intra- and interrater agreement and reliability of the Functional Field Score. Ophthalmic Physiol Opt. 2005;25:136–142.
- Spek AA, Velderman E. Examining the relationship between Autism spectrum disorders and technical professions in high functioning adults. Res Autism Spectr Disord. 2013;7:606–612.
- Ferris FL, Kassoff A, Bresnick GH, et al. New visual acuity charts for clinical research. Am J Ophthalmol. 1982;94:91–96.
- Kooijman AC, Stellingwerf N, van Schoot EAJ. Groningen Edge Contrast Chart (GECKO). Low Vis Res New Dev Rehabil. 1994;11:101.
- Van Baalen M, Boerwinkel L. Scoot veilig - iedere scootmobielgebruiker veilig op de weg [Scoot safely – every mobility scooter user participates safely in traffic]. Utrecht: Blijf Veilig Mobiel; 2011. Dutch.
- Spielberger CD, Gorsuch RL, Lushene R, et al. Manual for the State-Trait Anxiety Inventory. Palo Alto (CA): Consulting Psychologists Press; 1983.