
Abstract
Purpose: This first psychometric evaluation of the Patient Categorisation Tool examined its properties as an instrument to measure complexity of needs in a mixed population of patients presenting for specialist neurorehabilitation.
Materials/methods: Analysis of a large multicentre cohort of patients (n = 5396) from the national clinical dataset representing 63 specialist rehabilitation services across England. Structural validity was examined using exploratory and confirmatory factor analysis. Concurrent and criterion-validity were tested through a priori hypothesized relationships with other validated measures of resource requirements and dependency.
Results: All but two items loaded strongly onto a single principal component with Cronbach’s alpha 0.88. A total score of ≥30 identified patients with complex (category A) needs with sensitivity 76% and specificity 75%. However, confirmatory factor analysis provided a better fit when the scale was split into two subscales – a 'Cognitive/psychosocial' and a 'Physical' sub-scale (alpha 0.83 and 0.84, respectively). Moderate convergent and discriminant correlations were consistent with hypothesized relationships.
Conclusions: The findings provide some overall support for the Patient Categorisation Tool as a unidimensional tool for measuring complexity of needs for neurorehabilitation, but the subscales may be more suitable for certain groups of patients. Further analysis is now required to evaluate its performance in different conditions.
A psychometrically robust tool for measuring the complexity of rehabilitation needs has potential value, both at an individual level for treatment planning, and at a population level for planning and commissioning rehabilitation services.
The Patient Categorisation Tool now forms part of the United Kingdom national clinical dataset mandated by the National Health Service in England
This psychometric analysis from a large national multicentre cohort representing a diverse range of conditions, provides evidence for its validity as a means to identity patients with complex rehabilitation needs requiring specialist rehabilitation.
Implications for Rehabilitation
Introduction
Patients with complex disability present with a range of impairments that include physical, cognitive, emotional, behavioural and psychosocial problems. They form a diverse group, varying widely both in the pattern of presentation and the complexity of their needs for clinical care [Citation1,Citation2]. For efficient service provision, rehabilitation inputs should be matched as closely as possible to individual patient needs. A tool for measuring complexity of rehabilitation needs has potential value both for individual treatment planning and for resource allocation on a population basis. However, such tools must be valid, reliable and psychometrically robust.
The National Health Service England (NHSE) Service specification for ‘Specialised Rehabilitation for patients with highly complex needs’, identifies three levels of in-patient rehabilitation service (Levels 1–3) and four categories of patient need (categories A–D) [Citation3]. The majority of patients have relatively straightforward needs (category C or D) which can be met by their local general (Level 3) rehabilitation services. Patients with more complex (category B) needs, may require treatment in a local specialist (Level 2) rehabilitation unit; while a small number will have highly complex (category A) needs requiring the specialized skills and facilities of a tertiary (Level 1) rehabilitation service. The UK Rehabilitation Outcomes Collaborative (UKROC) Database provides the national clinical dataset for commissioning of specialist inpatient rehabilitation services for all Level 1 and 2 rehabilitation services in England [Citation4].
The Patient Categorisation Tool (PCAT) [Citation5] was originally drawn up as a checklist to identify patients with complex needs requiring treatment in Level 1 (tertiary) inpatient rehabilitation services. It was subsequently developed as an ordinal scale, to identify patients with either category A or B needs according to the criteria set out in the NHSE service specification. It now forms a mandatory part of the UKROC dataset. The PCAT is scored on admission and is used within the dataset to identify the complexity of the clinical caseload across different services and to signpost services to the different levels, which are associated with different funding streams. It is therefore important to understand its psychometric properties within the group of patients that it is used, but no formal evaluation of the PCAT has yet been published.
The purpose of this article is to describe the psychometric properties of the PCAT in a mixed population of patients with complex needs presenting for specialist neurorehabilitation in England. In this first analysis of the large national multi-centre UK dataset, we present the initial field evaluation of factor structure and internal consistency and concurrent validity, using a traditional psychometric approach based on Classical Test Theory. We also examine the criterion validity of the PCAT in the identification of patients with category A and B needs requiring treatment in a specialist in-patient rehabilitation setting.
Methods
Subjects, source and setting
The UK Rehabilitation Outcomes Collaborative (UKROC) database has systematically collated data on needs, inputs and outcomes from specialist in-patient rehabilitation since 2012. Reporting of the UKROC dataset is now mandatory for all Level 1 and 2 services in England and over 65 services are now registered and submitting data. The majority of these services cater for predominantly working aged adults (16–65 years) with complex neurological disability. Conditions include acquired brain injury (due to trauma, stroke, hypoxia, etc.), spinal cord injury, peripheral neurological conditions (e.g., Guillain Barré Syndrome) and progressive conditions (including Multiple Sclerosis, Motor Neurone Disease, Parkinson’s Disease etc.), but a small number of patients have non-neurological conditions (e.g., complex polytrauma).
Measurement tools
In UK clinical practice, the NHSE service specification requires that all patients referred for specialist rehabilitation should be assessed by a consultant in rehabilitation. The determination of rehabilitation needs relies primarily on their overall clinical impression of whether the patient has category A, B or C/D needs based on the criteria set out in the specification. However, this is largely a subjective assessment. The PCAT was designed as a structured tool to present a more standardized evaluation of rehabilitation needs for the purpose of comparison. It comprises 18 items each rated on a score of 1–3. In general, patients requiring rehabilitation (especially following acquired brain injury) separate into those who are physically dependent and those who are already mobile with cognitive/behavioural needs – but some of course will have both types of need. When calculating the total PCAT score, the UKROC dataset takes only the higher of the two scores for ‘Medical’ and “Neuropsychiatric” inputs, and rescores one item (“Duration of program”) on a scale of 0–2, to give a total possible score range of 16–50. For the purpose of this factor analysis, the Medical and Neuropsychiatric inputs were included as separate items, but the total scores were still adjusted to maintain the same score range of 16–50. The PCAT is applied in English and takes about 3 min to record for each patient. Evidence for the reproducibility of the PCAT (reliability between raters) has been presented elsewhere [Citation6].
There is no accepted gold standard for the measurement of complexity, but it is reasonable to suppose that patents with complex needs for rehabilitation may have higher resource requirements and lower levels of physical and/or cognitive independence. Other measures extracted for concurrent validity were admission scores for a) the Rehabilitation Complexity Scale (RCS-E), b) the UK Functional Assessment Measure (UK FIM + FAM) and c) the Northwick Park Nursing Dependency Scale (NPDS). All of these are well-validated tools routinely collected within the UKROC dataset.
The RCS-E version 12 is a simple 5-item scale (score range 0–20) reflecting the resource requirements for care, nursing, medical management, therapy inputs (number of disciplines and intensity) and specialist equipment [Citation7].
The UK FIM + FAM is a 30-item measure of functional independence (total score range 30-210) comprising 16 “Motor” items relating to self-care, transfers and mobility (score range 16-112) and 14 “Cognitive” items related to cognitive and psychosocial function (score range 14–98) [Citation8]. It forms the principal outcome measure for the UKROC dataset.
The NPDS is a measure of basic care and special nursing needs (score range 0–100) [Citation9]. The Basic Care Needs subscale comprises 16 items covering the daily activities needed for everyday functioning (score range 0–65). These include physical performance (NPDS-PD) for example, washing, dressing, toileting, eating and drinking. (13 items – score range 0–52) and appropriate cognitive behaviour (NPDS-CB) for example, communication, safety awareness etc. (3 items – score range 0–13).
Data extraction
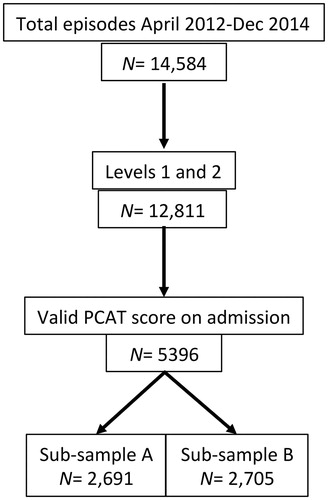
This first analysis was conducted on all PCAT data recorded in the UKROC database for in-patient episodes Level 1 and 2 services between April 2012 and December 2014. During this period, PCAT reporting was optional and ratings were recorded on admission for a total of 5396 patients from a total of 63 services (Level 1 n = 17 and 46 Level 2 n = 46). This figure comprised 42.1% of the total cohort of patients during that period. Within this selected dataset, there were no missing item scores. For the purpose of the factor analyses, the sample was randomly divided into two approximately equal subsamples (A, n = 2691 and B, n = 2705) using the randomization facility in the Statistical Package for Social Sciences (SPSS) v22. summarizes the process of extraction.
Figure 1. Flow chart of the data extraction process. summarizes the process of data extraction. Collection of the PCAT was optional during the data collection period so complete data were not expected. PCAT data were recorded on admission for 42% of case episodes.
Power calculation and sampling
There is a lack of consensus within the literature on how to compute sample size for factor analysis [Citation10]. The COSMIN guidelines [Citation11] state only that a power calculation should be done, rather than specifying how to do it. Subject-to-item ratios are often quoted in the literature, and many authors have suggested “rules of thumb” recommending anything from 2–20 subjects per item with an absolute minimum of 100–250 [Citation12] up to >1000 [Citation13]. MacCallum et al. [Citation14] note that these rules of thumb are often not valid and that the minimum sample size is dependent on other aspects of design including the communality of variables, the number of factors and the degree of cross loading. It also depends on the context in which testing is conducted. In the common scenario of tool development, exploratory factor analysis (EFA) may typically be conducted on a pilot sample to explore dimensionality and exclude mis-fitting or redundant items prior to confirmatory factor analysis (CFA) on a separate larger field study.
For this study, the PCAT tool was already established in clinical use, with data systematically collated in a national database representing the whole population of patients in Level 1 and 2 rehabilitation services in England. The empirical analysis of such a large observational dataset offers the benefit of generalisability to real-life clinical practice. However, because of the diversity of underlying conditions and the anticipated diversity of needs amongst individual patents, it was considered appropriate to use the whole population and to maximize representation of the less common conditions and needs.
The fundamental difference between EFA and CFA is that EFA is “data-driven” to discover an as yet unknown factorial structure, while CFA is “theory-driven” to confirm hypothesized structures suggested by EFA. It is generally advisable to perform EFA and CFA on separate samples, although there are different approaches to achieving this. One approach would be to split the sample into two consecutive cohorts by date of admission. However, national benchmarking shows that populations have become more complex over time [Citation6] so this may introduce other sampling errors. Instead, we chose a 50:50 random split as has been used in other analyses [Citation15] to give two substantial but similar samples. The sample sizes were determined by the data available but, at >2500 each, were large in comparison to many similar analyses.
Analysis
All analyses were conducted using the IBM SPSS v0.22 software, except for CFA which used the LISREL v.8.80 software, and the Receiver Operating Characteristic curve which used STATA v14.2.
To determine the factor structure of the PCAT, EFA was conducted on sub-sample A and CFA on sub-sample B. All other analyses were conducted on the full sample (N-5396).
For EFA, principal component analysis was applied with Varimax rotation. Varimax is an orthogonal rotation where the variances explained by each factor are independent of each other resulting in clear, interpretable solutions The Kaiser–Meyer–Olkin test and Bartlett’s Test of Sphericity were used to ensure that the correlation matrix was suitable for factor analysis [Citation16]. The KMO is a test of sampling adequacy and values >0.6 are acceptable for factor analysis. Bartlett’s test determines if the correlation matrix is an identity matrix and unsuitable for factor analysis which is indicated by a non-significant p value [Citation16,Citation17]. The decision as to the number of factors to rotate was based upon consideration of (a) the number of factors with Eigenvalues >1, (b) visual inspection of the scree plot and (c) parallel analysis. Eigenvalues are numbers representing how much variance an individual component explains. In the Scree test, these are plotted against their components in descending order to help determine the fewest number of components explaining most of the variance [Citation18]. Parallel analysis involves determining the number of factors to rotate by comparing the size of the eigenvalues obtained with those from a Monte Carlo simulation [Citation19].
Internal consistency was examined using Cronbach’s alpha. Values should be between 0.7 and 0.95 for adequate internal consistency without excessive item redundancies [Citation20].
CFA was completed on a separate sample using diagonally weighted least squares as an estimation method together with polychoric correlations. This approach is considered to be the most appropriate one for ordinal-scale datasets [Citation21]. The Chi-Square value (which assesses the magnitude of discrepancy between the sample and fitted covariances matrices) is the traditional measure for evaluating overall model fit – a good model provides an insignificant result at a 0.05 threshold. It was included for completeness but will nearly always reject the model when large sample sizes are used, so a range of other fit statistics are available. Hooper et al. [Citation22] provide helpful guidance on which to use in different contexts. The following fit statistics were selected for this study based on their better suitability to the large sample size. Comparative Fit Index (CFI), Tucker Lewis Index (TLI), Goodness of Fit Index (GFI), Root Mean Square Error of Approximation (RMSEA). The CFI compares the hypothesised model with the independence or null model with fit values ranging from 0 to 1 and is considered sensitive to model misspecification [Citation23]. The TLI (also known as the Non-Normed Fit Index, NNFI) can have values outside the range 0–1. It is recommended for its ability to compensate for the effects of model complexity [Citation23]. The GFI can range from 0 to 1 and reflects the relative amount of observed variance and covariance explained by the model. The RMSEA reflects the difference between the observed and the hypothesised model taking into account the degrees of freedom and is considered appropriate with complex models and large samples [Citation17].
The following criteria were used to evaluate the fit of the model. For an excellent fit, GFI, CFI and TLI should all be >0.95, but values between 0.90 and 0.95 represent “acceptable” fit. For RMSEA values <0.06 represent a “good” fit. Values between 0.06 and 0.08 represent a “reasonable” fit; and values between 0.08 and 0.10 a “mediocre, but acceptable” fit [Citation24].
Concurrent relationships with measures of physical and cognitive function (the UK FIM + FAM and NPDS) were examined using non-parametric Spearman rank correlation tests as all of these scales yield ordinal data. We did not expect to find a very close relationship as these tools measure different parameters. Nevertheless we expected to find a generally convergent relationship (positive correlation) with resource requirements (total RCS-E score) and dependency (total NPDS score), and a discriminant relationship (negative correlation) with independence (Total UK FIM + FAM). We also expected to find stronger relationships than with their respective counterparts between the PCAT-Phys subscale and the motor/physical components of the FIM + FAM and NPDS, and between the PCAT-Cog and the cognitive components of those scales.
To determine whether the PCAT and/or its subscale scores can help to distinguish patients with category A, B and C needs, one-way ANOVA tests (SPSS v0.22) were used to test for significant differences between the clinically assessed category groups. As well as testing for the overall difference between groups, post hoc tests were used to examine pairwise differences between categories A/B and B/C. For example, category A patients were expected to have significantly higher PCAT scores than category B patients, who would in turn have higher scores than category C. To correct for multiple comparisons, the Scheffe test was chosen as a conservative method controlling for the overall confidence level which is also suitable for use with unequal sample sizes [Citation25].
Although no gold standard was available, criterion validity of the PCAT was tested in relation to the assessor’s clinical impression of category of need. A Receiver Operating Characteristic (ROC) curve was plotted to investigate the sensitivity and specificity of the PCAT as a binary classifier of category A and B needs based on the assessor’s clinical impression. The area under the curve (AUC) was computed for total PCAT scores, and PCAT-Phys and PCAT-Cog using the non-parametric option STATA v.14.2 to provide an empirical estimation with standard error and thus estimation of the 95% confidence interval. As reported by other authors, Hanley and De Long methods gave almost identical results. The AUCs reported here were derived from the Hanley method [Citation26,Citation27]. Although the AUC is the most useful estimation of accuracy from a statistical perspective, clinicians like to know the specific cut-off points that may reasonably identify patients with category A and B needs within the sample. These were explored by plotting the coordinates of PCAT scores with clinically assessed category of need, placing equal value on sensitivity and specificity.
Findings are presented according to the framework originally described by Terwee et al. in [Citation28] for reporting the psychometric properties of health-related measurement tools, subsequently developed as the Consensus-based Standards for the Selection of Health Measurement Instruments (COSMIN) checklist [Citation11], which is included as an electronic supplement.
Results
The demographics of all three samples are shown in .
Table 1. Demographics of the total sample and randomised subsamples.
Exploratory factor analysis (EFA)
The findings from EFA (subsample A, n = 2691) are summarized in . The KMO test value was 0.91 (above the recommended cut-off of 0.60) and Bartlett’s test was significant (p < 0.001) confirming suitability of the correlation matrix for factor analysis. Corrected item total correlations (excluding each item from the total score) ranged from 0.24–0.67. Principal components analysis showed that all but two items loaded strongly on the first principal component with loadings ≥0.45, the exceptions being tracheostomy (0.30) and vocational rehabilitation (0.29). Cronbach’s alpha was 0.88 for the total scale.
Table 2. Results of exploratory factor analysis.
Inspection of the Scree plot suggested a 2-factor solution and Varimax rotation revealed two factors:
the first “Cognitive/psychosocial” factor (PCAT-Cog) comprised needs relating to psychiatric input, cognitive, behavioural and mood management. Also within this factor were emotional load on staff, the needs for family support, vocational rehabilitation and medico-legal input (such as assessment of mental capacity etc.)
the second “Complex Physical” factor (PCAT-Phys) comprised needs for medical input, physical handling, management of disability, tracheostomy and swallow/nutrition. Also within this factor were needs for special facilities, and more intensive or longer duration rehabilitation.
Needs for communication and discharge planning loaded strongly on both factors.
Confirmatory factor analysis (CFA)
Reliability of the hypothesized models yielded by EFA in subsample A, was examined in subsample B (n = 2705) using CFA. A single-factor and a two-factor model were tested.
The single-factor model was examined using all 18 items. Inspection of the modification indices suggested that model fit was significantly improved by adding co-variances between error terms, initially for the following two pairs of items: “Mood” and “Psychiatric” and “Physical handling” and “Equipment facilities”. While the RMSEA was marginally acceptable for this model at 0.098, the other fit statistics (CFI/TLI 0.954/0.947 and GFI 0.961) indicated that the model fit was overall very good to excellent. However, error covariance continued to be an issue, as modification indices suggested correlating further error variances of items.
The two-factor model resulted in a substantially improved fit. After correlating three pairs of error variances, (‘Behavioural’ with ‘Staff emotional’, ‘Mood’ with ‘Psychiatric’, and ‘Mood’ with ‘Staff emotional’), a RMSEA value of 0.077 indicated that the fit was reasonable, and the remaining fit indices indicated that the fit was excellent (CFI = 0.972, GFI = 0.973, and TLI = 0.967). However, as the preceding EFA revealed substantial cross-loadings for “Communication” and “Discharge planning”, a further model was tested that allowed “Discharge planning” and “Communication” to load on both factors. After adding co-variances between error terms of three pairs of items (“Equipment facilities” and “Physical”; “Mood” and “Psychiatric”; “Behavioural” and “Staff emotional”), the fit statistics were, RMSEA 0.071, CFI/TLI 0.977/0.972 and GFI 0.979.
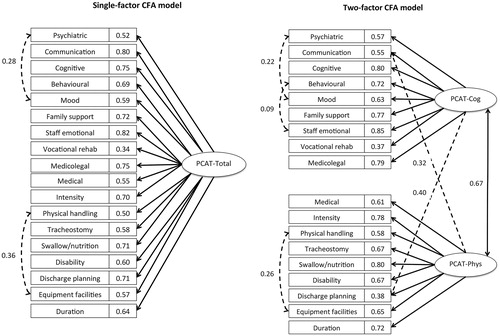
Inevitably with this large sample size, the Chi Square statistics did not support any of the three models. Satorra-Bentler Scaled Chi square/df was 3591.068/133 (=27.001), p < 0.001 for the single-factor model, 2254.669/131 (=17.211), p < 0.001 for the two-factor model, and 1903.557/129 (=14.756), p < 0.001 the two-factor model with the two added cross-loadings. This final two-factor model with two cross-loading items thus presented the overall best fit and supported the two-factor hypothesized structure of the PCAT scale. If these subscales were used in isolation of each other they would therefore comprise 10 items each (score range 0–30), with communication and discharge planning included in each. Cronbach’s alphas for these two scales were PCAT-Cog 0.83 and PCAT-Phys 0.84. illustrates the single factor and the final two-factor CFA model with their respective factor loadings.
Figure 2. Confirmatory factor analysis. Model specification. shows the final solution for confirmatory factor analysis, comparing both a single-factor and a two-factor model. The model produced the best fit when the PCAT was divided into two sub-scales of 10 items each, with items relating to “Discharge planning” and “Communication” allowed to load on both subscales.
Concurrent validity
Concurrent validity was explored through the relationship of the PCAT tool with measures of complexity (RCS-E), dependency (NPDS and UK FIM + FAM). As noted above, we did not expect to find a very close relationship as these tools measure different parameters. Nevertheless we hypothesized and found a congruent relationship (positive correlation) with complexity (total RCS-E score) and dependency (total NPDS score) and a discriminant relationship (negative correlation) with independence (Total UK FIM + FAM).
Also as hypothesised, stronger relationships were found between the motor/physical components of the various scales, and between cognitive components, than with their respective counterparts. summarises the Spearman rho correlations between these different parameters, tested across the whole sample.
Table 3. Spearman rho correlations between PCAT, RCS-E, NPDS and FIM + FAM scores.
Sensitivity and specificity
shows the distribution of total PCAT scores in relation to clinical assessors’ subjective categorization of category A, B and C rehabilitation needs and summarizes the descriptive statistics. (As only 13 patients in this series had category D needs, these were not included in the analysis). One-way ANOVA tests showed significant differences between all groups (). With post hoc Scheffe correction, the differences were still significant at <0.05, as may also be inferred from the non-overlapping confidence intervals.
Figure 3. Distribution of PCAT scores in relation to the assessors’ subjective categorization. shows the distribution of total PCAT scores in relation to clinical assessors’ subjective categorization of rehabilitation needs.
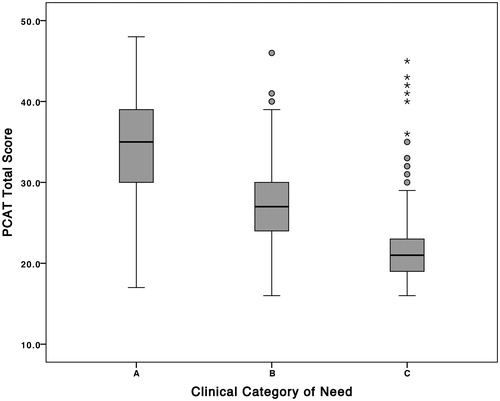
Table 4. PCAT scores within each of the clinically-assessed categories.
Table 5. ANOVA post hoc comparison of differences in PCAT scores between different categories of need.
shows the results of ROC analysis including the area under the curve (AUC) for the clinically-assessed category A and B needs in the PCAT total and subscales. Suggested cutoff points were identified at the point where sensitivity just exceeded specificity. The findings suggest that PCAT total scores of 30 and 24, respectively, mark the cut-off points for category A and B needs. The area under the curve (AUC) for category A and B needs were 0.84 and 0.89 respectively, suggesting that the total PCAT on admission identified patients with category A and B needs with good “accuracy”. A PCAT score of ≥30 identified category A patients with a sensitivity of 76% and specificity of 75%.
Table 6. Area under the curve and sensitivity/specificity of suggested cut-points for category A and B needs within the PCAT total and sub-scales.
The AUCs for PCAT-Phys and PCAT-Cog were 0.81 and 0.78, respectively, with suggested cut-points of 16 and 15, respectively, for category A/B needs. The equivalent AUCs for category B needs were 0.86 and 0.84, with cut points of 13 and 12 respectively.
The psychometric properties of the PCAT according to the framework recommended by Medical Outcomes Trust [Citation28] are summarised in Electronic Supplement 1.
Discussion
In this study dimensionality, internal consistency, criterion-related and concurrent validity of the PCAT were examined in a large multicentre cohort of patients with complex rehabilitation needs across a diverse range of neurological conditions. EFA showed that all but two items loaded strongly onto a single principal component with Cronbach’s alpha 0.88, suggesting that the PCAT forms a unidimensional scale that could reasonably be summed into a single total score. However, in this mixed population, the CFA provided a better fit when the scale was split into two sub-scales – one relating principally to cognitive/psychosocial requirements (PCAT-Cog) and the other to physical requirements (PCAT-Phys).
Neither model had a very good fit, but this was to some extent expected in such a large and heterogeneous population. It should be noted that the criteria for statistical confirmation of a good fit have generally been derived from much smaller more homogenous populations analyzed as part of tool development. In that context, mis-fitting items may simply be discarded to provide a better fit. This study tested a pre-established tool that had been developed to capture a diverse range of needs, in a large sample across a wide range of different conditions. While future analyses may limit the sampling to certain conditions providing a more homogenous sample, for this first analysis of field data we wanted to test the tool in the real life context in which it is actually used. Under these circumstances an “acceptable” fit is about the best that could be expected.
The fact that “Communication” and “Discharge planning” loaded onto both subscales resonates with clinical experience, as these are likely to be key rehabilitation needs for patients regardless of whether they have primarily physical or cognitive/behavioural disabilities. Similarly, vocational rehabilitation did not load strongly onto either factor and would normally be a candidate for omission. However, at a clinical level, vocational rehabilitation represents a small but discrete subspecialty of neurorehabilitation. It is offered in comparatively few in-patient/residential programs in the UK but still needs to be captured for the purpose of commissioning.
Although the PCAT was not developed through formal consensus methodology (such as Delphi or equivalent), a multidisciplinary advisory panel of rehabilitation specialists convened by the Department of Health in England drew up the original checklist as part of its Specialised Service National Definition Set in [Citation29]. The fact that this classification has survived through subsequent iterations of the service specification over nearly a decade confers a degree of face and content validity within its development. In this present study, concurrent validity of the ordinal scale was tested through relationships with other measures of resource requirements and dependency, which fulfilled the a priori hypothesised expectations. In the absence of a gold standard, criterion validity of the PCAT was examined in relation to the assessor’s clinical impression of category of need and a total PCAT score of ≥30 was found to have acceptable sensitivity and specificity as an indicator of category A needs. However, this still means that 25% of patients could be mis-classified by this criterion and further exploration is required to see if weighting of certain items would provide better discriminative value.
Designed to capture complexity of needs across the range of presentation, it was not necessarily expected that the component items of the PCAT would show a very close relationship. In fact, the scale performed better than we had expected as a single total score in the detection of patients with category A, B and C needs resulting from a wide range of conditions. It should be noted, however, that two-thirds of the study population had acquired brain injury of one type or another. Further testing is now indicated across the different diagnostic subgroups of conditions, and also different groups of clinical need, to determine under what circumstances it is appropriate to apply the total scale or the sub-scales.
For example, while the factor analysis provided better support for a two-factor model, the margin between category A and B needs within the physical and cognitive subscales was narrow (at only three points), suggesting that the sub-scales may provide a less robust distinction between different categories of need. It is possible, however, that the PCAT-Phys subscale may perform better in patients with primarily physical disability (e.g., spinal cord injury or peripheral neurological conditions), while the PCAT-Cog subscale may prove a more sensitive and specific indicator of rehabilitation complexity in the mainly ambulant group of patients requiring specialist “cognitive/behavioural” rehabilitation services, who formed a minority within this overall population. These subgroups need to be separated out for further exploration in future research, but this first paper provides a starting platform for this further exploration as the national clinical dataset grows.
The authors recognize a number of limitations to this study:
Complete data were not expected as collection of the PCAT tool was optional during the data extraction period but, importantly, less than half of the total possible cohort had PCAT scores and were included in the analysis. So although there were no missing data in item scores within this sample and the number of cases was very large, this selection criterion could have led to some selection bias.
Ideally EFA and CFA should be conducted on entirely different samples. However, as the UKROC database collates data for all Level 1 and 2 services in England, no alternative data sources currently exist. Fortunately the dataset was large enough to split and we chose a 50:50 random split. The advantage of this approach is that provided two large samples both representative of real life clinical practice. However, as noted above, it may have implications for interpretation of fit statistics in CFA.
This analysis based on classical test theory provides encouraging support for the scalability of the PCAT. Further analysis is required using Rasch analysis in different conditions to determine whether it can truly provide measurement on a single scale and whether transformation to interval level data is possible. This is underway and will be presented for publication separately.
The PCAT tool is measured within the UKROC dataset on admission only. No data are therefore currently available on its responsiveness to change over time.
Despite the above limitations, the findings from this study provide support for the PCAT as a useful tool for measuring rehabilitation complexity as well as its potential to describe different types of needs in a diverse group of patients. The multicentre representation across all 63 Level 1 and 2 centres provides support for the generalisability of our findings within England, but cross-cultural validity requires further exploration to determine its value in other health cultures and jurisdictions.
Ethics approval
The UKROC program was registered as a multicentre service evaluation and by the Department of Health as a Payment by Results Improvement Project until July 2015. It is now commissioned directly by NHS England. Collection and reporting of the UKROC dataset is a commissioning requirement according to the NHS England service specification for Level 1 and 2 Rehabilitation Services. According to the UK Health Research Authority, neither service evaluations nor the publication of research findings from de-identified data gathered in the course of routine clinical practice require research ethics permission.
Lynne_Turner-Stokes_et_al_supplemental_content.zip
Download Zip (81 KB)Acknowledgements
The authors gratefully acknowledge the hard work of the clinical teams in the 63 centres, and of the patients and their families who participated in the follow-up survey. Special thanks are due to the UKROC program steering group and coapplicants, and in particular to Heather Williams, Keith Sephton and Alan Bill who maintain the UKROC database and check the data on a daily basis. We are also grateful to Roxana Vanderstay (King’s College London) and to Dr Maheswaran Rohan (Auckland University of Technology) for their assistance and statistical advice in earlier iterations of this analysis.
Disclosure statement
Outcome measurement is a specific research interest of our center. Lynne Turner-Stokes is Director of UKROC and was the lead developer of the PCAT tool as an ordinal scale, but neither she nor her employing institution has any financial interest in the tools which are disseminated free of charge. None of the authors has any personal financial interests in the work undertaken or the findings reported. All authors are full time employees of NHS or academic institutions, any of which may cite this article as part of their research evaluation processes. Lynne Turner-Stokes has received financial support from the National Institute for Health Research (NIHR) to attend conferences to disseminate the findings from the UKROC program. We do not consider that any of these relationships or activities have influenced the submitted work.
Additional information
Funding
Related Research Data
References
- Wade DT. Complexity, case-mix and rehabilitation: the importance of a holistic model of illness. Clin Rehabil. 2011;25:387–395.
- Specialist neuro-rehabilitation services: providing for patients with complex rehabilitation needs. London: British Society of Rehabilitation Medicine. 2010. Updated 2015.
- Specialist Rehabilitation for Patients with Highly Complex Needs: D02 Service Specification. London 2013 [cited 2017 December 21]; Available from: http://www.england.nhs.uk/wp-content/uploads/2014/04/d02-rehab-pat-high-needs-0414.pdf.
- UKROC: UK Rehabilitation Outcomes Collaborative. London 2010 [cited 2017 December 21]; Available from: https://www.kcl.ac.uk/nursing/departments/cicelysaunders/research/studies/uk-roc/index.aspx.
- The Patient Categorisation Tool (PCAT). UK Rehabilitation Outcomes Collaborative. London: King's College London; 2012 [cited 2017 December 21]; Available from: http://www.kcl.ac.uk/lsm/research/divisions/cicelysaunders/research/studies/uk-roc/tools.aspx.
- Turner-Stokes L, Vanderstay R, Eagar K, et al. Cost-efficient service provision in neurorehabilitation: defining needs, costs and outcomes for people with long-term neurological conditions: Programme grant report (RP-PG-0407-10185). London: National Institute of Health Research 2015 [cited 2017 December 12]. Available from; https://www.kcl.ac.uk/nursing/departments/cicelysaunders/research/studies/uk-roc/Final-submitted-programme-grant-report-29.07.15-draft.pdf
- Turner-Stokes L, Williams H, Siegert RJ. The Rehabilitation Complexity Scale version 2: a clinimetric evaluation in patients with severe complex neurodisability. J Neurol Neurosurg Psychiatr. 2010;81:146–153.
- Turner-Stokes L, Siegert RJ. A comprehensive psychometric evaluation of the UK FIM + FAM. Disabil Rehabil. 2013;35:1885–1895.
- Siegert RJ, Turner-Stokes L. Psychometric evaluation of the Northwick Park Dependency Scale. J Rehabil Med. 2010;42:936–943.
- Wolf EJ, Harrington KM, Clark SL, et al. Sample size requirements for structural equation models: an evaluation of power, bias, and solution propriety. Educ Psychol Meas. 2013;913–934.
- COnsensus-based Standards for the selection of health Measurement Instruments Netherlands 2012 [cited 2017 May 17]; Available from: http://www.cosmin.nl/index.html.
- Anthoine E, Moret L, Regnault A, et al. Sample size used to validate a scale: a review of publications on newly-developed patient reported outcomes measures. Health Qual Life Outcomes. 2014;12:176.
- Comrey AL, Lee HB, editors. A First Course in Factor Analysis. 2. New Jersey: Lawrence Erlbaum Associates; 1991.
- MacCallum RC, Widaman KF, Zhang S, et al. Sample size in factor analysis. Psychol Methods.1999;4:84–99.
- Revicki DA, Cook KF, Amtmann D, et al. Exploratory and confirmatory factor analysis of the PROMIS pain quality item bank. Qual Life Res. 2014;Feb23:245–255.
- Pett MA, Lackey NR, Sullivan JJ. Making sense of factor analysis: the use of factor analysis for instrument development in health care research. Thousand Oaks, California: Sage Publications; 2003.
- Tabachnick BG, Fidell LS. Using multivariate statistics (4th edition). Needham Heights, Massachusetts: Allyn & Bacon; 2001.
- Cattell RB. The scree test for the number of factors. Multivar Behav Res. 1966;1:245–276.
- Horn JL. On subjectivity in factor analysis. Educ and Psychol Meas. 1967;27:811–820.
- Bland JA, Altman A. Statistics notes: Cronbach's alpha. BMJ. 1997;314:572.
- Flora DB, Curran PJ. An empirical evaluation of alternative methods of estimation for confirmatory factor analysis with ordinal data. Psychol Methods. 2004;9:466–491.
- Hooper D, Coughlan J, Mullen MR. Structural Equation Modelling: Guidelines for Determining Model Fit. Electron J Bus Res Methods 2008;6:53–60.
- Hu L, Bentler PM. Fit indices in covariance structure modelling; Sensitivity to underparametrized model misspecification. Psychol Methods. 1998;3:424–453.
- Hu LT, Bentler PM. Cutoff criteria for fit indexes in covariance structure analysis: Conventional criteria versus new alternatives. Struct Equ Modelling. 1999;6:1–55.
- Andale. Post hoc analysis. Statistics How To: [serial on the Internet]. 2015 [cited 2017 December 21]: Available from: http://www.statisticshowto.com/post-hoc/.
- Hanley JA, McNeil BJ. A method of comparing the areas under receiver operating characteristic curves derived from the same cases. Radiology. 1983;148:839–843.
- Kumar R, Indrayan A. Receiver operating characteristic (ROC) curve for medical researchers. Indian Pediatr. 2011;48:277–287.
- Terwee CB, Bot SD, de Boer MR, et al. Quality criteria were proposed for measurement properties of health status questionnaires. J Clin Epidemiol. 2007;60:34–42.
- National Definition Set for Specialised Services No 7: “Complex specialised rehabilitation for brain injury and complex disability (Adult)”. Third Edition. London: Department of Health. 2009