
Abstract
Purpose: Non-ambulatory persons with cerebral palsy are prone to low bone mineral density. In ambulatory persons with cerebral palsy, bone mineral density deficits are expected to be small or absent, but a consensus conclusion is lacking. In this systematic review bone mineral density in ambulatory persons with cerebral palsy (Gross Motor Function Classification Scales I–III) was studied.
Materials and methods: Medline, Embase, and Web of Science were searched. According to international guidelines, low bone mineral density was defined as Z-score ≤ −2.0. In addition, we focused on Z-score ≤ −1.0 because this may indicate a tendency towards low bone mineral density.
Results: We included 16 studies, comprising 465 patients aged 1–65 years. Moderate and conflicting evidence for low bone mineral density (Z-score ≤ −2.0) was found for several body parts (total proximal femur, total body, distal femur, lumbar spine) in children with Gross Motor Function Classification Scales II and III. We found no evidence for low bone mineral density in children with Gross Motor Function Classification Scale I or adults, although there was a tendency towards low bone mineral density (Z-score ≤ −1.0) for several body parts.
Conclusions: Although more high-quality research is needed, results indicate that deficits in bone mineral density are not restricted to non-ambulatory people with cerebral palsy.
Although more high-quality research is needed, including adults and fracture risk assessment, the current study indicates that deficits in bone mineral density are not restricted to non-ambulatory people with CP.
Health care professionals should be aware that optimal nutrition, supplements on indication, and an active lifestyle, preferably with weight-bearing activities, are important in ambulatory people with CP, also from a bone quality point-of-view.
If indicated, medication and fall prevention training should be prescribed.
Implications for Rehabilitation
Introduction
Cerebral palsy (CP) occurs in 1.5–3.0 out of every 1000 live births and is the most common cause of physical disability in pediatric rehabilitation medicine [Citation1]. CP describes a group of permanent disorders in the development of movement and posture causing limitations in activity that are attributable to non-progressive disturbances which occurred in the fetal or infant brain [Citation2]. There are three CP subtypes: spastic, ataxic, and dyskinetic [Citation1]. Motor disorders of CP are often accompanied by disturbances of sensation, perception, cognition, communication, and behavior, as well as epilepsy and secondary musculoskeletal problems [Citation2]. Moreover, persons with CP often have nutritional problems [Citation3,Citation4].
Persons with CP are prone to low bone mineral density (BMD) [Citation3,Citation5] because of low calcium and vitamin D intake [Citation3,Citation5,Citation6] as well as use of anticonvulsant medication [Citation3,Citation7], which can lead to vitamin D deficiency [Citation5]. Furthermore, persons with CP are generally known to have inactive lifestyles [Citation8–11], which may adversely affect BMD [Citation7].
Several studies [Citation3,Citation12–17], including two systematic reviews [Citation16,Citation17], have suggested the presence of low BMD in children, adolescents, and adults with CP. However, these studies mainly focused on non-ambulatory persons with moderate to severe CP (Gross Motor Function Classification System (GMFCS) levels IV–V [Citation18]). Because nutritional deficiencies, epilepsy [Citation19], and inactivity [Citation10] occur less frequently or less severely in persons with CP who are ambulatory or mildly affected (GMFCS levels I–III), it may be expected that BMD deficits are smaller or absent in these subgroups. Furthermore, ambulatory persons perform more weight-bearing activities compared to non-ambulatory persons, which may prevent development of low BMD [Citation9]. However, evidence for the magnitude of BMD deficits in ambulatory persons with CP is, as far as we know, lacking. BMD information in this subgroup is important because it may have treatment implications.
The aim of this systematic review was to provide an overview of the current scientific literature on BMD in ambulatory persons (children and adults) with mild to moderate CP (GMFCS levels I–III).
Materials and methods
Literature search
This study focusing on BMD in ambulatory persons with CP (GMFCS levels I–III) was a computer-aided literature study performed using Medline, Embase, and Web of Science up to June 2017. Key words representing CP and BMD were included in the literature search. The complete search strategy is shown in Supplementary Table S1.
Inclusion criteria
Full-text original studies (i.e., no abstracts, reviews or editorials) were included in this study if they fulfilled all of the following criteria: (1) study of a diagnostic group of CP classified as GMFCS levels I–III. Studies also including GMFCS levels IV and V were permitted if results for GMFCS levels I–III were presented separately or results for GMFCS levels I–III could be calculated separately; (2) BMD was included as an outcome measure; (3) the study had to be an observational study (cohort study or case–control study) or concern baseline measurements of an intervention or experimental study; (4) results on BMD had to be compared with reference data and presented as average Z-score (standard deviation (SD)). A Z-score is the difference between a patient’s value and an age-specific mean value, divided by the reference group’s SD. Alternatively, the average Z-score (SD) for persons with CP could be calculated from results of BMD in a simultaneously measured control group of typically developing persons (case control studies). For proper calculation, a minimum sample size of typically developing persons was set at 15; and (5) the study had to be written in English, German, French, or Dutch.
Study selection
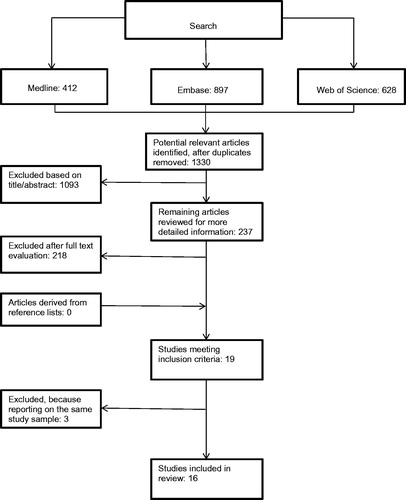
Two reviewers (C. M. and R. v. d. B.) independently selected potentially relevant studies using the inclusion criteria to evaluate titles, abstracts, and full text articles (). A consensus method was used when there was any disagreement regarding the inclusion of the data between the two reviewers. When any disagreement persisted, a third reviewer (B. H.) was consulted. In the case of multiple articles by the same authors, we contacted corresponding authors to clarify whether the articles used different study samples.
Figure 1. Flowchart of the included studies.
Data extraction
The same two reviewers independently extracted the data from included studies. Any disagreement about data extraction was resolved by the same consensus process as previously described. Characteristics of the included studies can be found in Supplementary Table S2.
Methodological quality assessment
The two reviewers (C. M. and R. v. d. B.) independently assessed the methodological quality of the included studies using a constructed quality assessment list (), which included criteria adapted from the New Castle-Ottawa scale [Citation20], the Dutch Cochrane Centre [Citation21], as well as the studies of Huisstede et al. [Citation22,Citation23], Van Rijn et al. [Citation24,Citation25], and Hombergen et al. [Citation26] and modified to cover the topic of this review. The list consisted of ten items within three themes (study population/selection, outcome measurements, and study design). The reviewers scored each item as positive (+), negative (−), or unclear (?). A consensus procedure was used to resolve disagreements between reviewers. A study was considered high-quality when the score exceeded 50% of the maximum attainable score.
Table 1. Quality assessment criteria.
Data analysis
We considered pooling of data in a meta-analysis when patient characteristics and outcome measures used to evaluate BMD were homogeneous. If pooling of data was not possible, a best-evidence synthesis was performed to summarize the results of the included studies. For the best-evidence synthesis, we used Z-score to compare the results between persons with CP and typically developing persons. According to the International Society For Clinical Densitometry [Citation6,Citation27], low BMD was defined as a Z-score ≤ −2 for our primary evidence synthesis. We adopted this definition for both children and adults with CP. In addition, we focused on Z-score ≤ −1.0, because this may indicate a tendency towards low BMD. For (case–control) studies that did not provide Z-score, we calculated average (SD) Z-score based on average BMD level in the CP group and average (SD) BMD level in the simultaneously measured control group of typically developing persons (the minimum requested sample size of typically developing persons was set at 15). If levels of significance were not provided for the comparisons of our interest, we calculated p values using means, SDs, and sample sizes.
The level of evidence for low BMD in persons with CP was ranked as follows [Citation26]: (1) Strong evidence: ≥ 2 high-quality studies in which CP results meet the criteria for low BMD (i.e., an average BMD Z-score ≤ –2.0) and differ significantly (p ≤ 0.05) from typically developing persons results; (2) moderate evidence: ≥ 2 low-quality studies or 1 high-quality study in which CP results meet criteria for low BMD (i.e., an average BMD Z-score ≤ –2.0) and differ significantly (p ≤ 0.05) from typically developing persons results; (3) limited evidence: 1 low-quality study in which CP results meet the criteria for low BMD (i.e., an average BMD Z-score ≤ −2.0) and differ significantly (p ≤ 0.05) from typically developing persons results; (4) conflicting evidence: conflicting findings between studies (less than 75% of studies report low BMD in the CP group compared with the typically developing persons group and a significant difference between the results in the CP and the typically developing persons group); (5) no evidence: studies available, but no low BMD or no significant differences between the CP and typically developing persons groups are reported; (6) no studies found.
In addition, as a secondary best-evidence synthesis, we applied the above ranking method for the cutoff level of Z-score ≤ −1.0, since this level may indicate a tendency towards low BMD.
Results (mean and SD, where necessary, SD was calculated from standard error [SE]) were described for each body site separately (lumbar spine [comprising several spinal levels], total proximal femur, femur neck, distal femur, calcaneus, radius, and tibia), and for the total body. Furthermore, we reported results for children (age 0–17 years) and adults (≥18 years) and for each GMFCS level separately. If this was not possible, we described results for combined age (including both children and adults) and combined ambulatory levels (GMFCS levels I and II or GMFCS levels I–II–III). To enhance readability, we only reported Z-scores ≤ −2.0 and Z-scores ≤ −1.0 in the results section. Of course, the best-evidence syntheses were based on all Z-scores, including those > −1.0; an overview of all Z-scores can be found in . Because of small sample sizes, results at the alpha level of 0.10 were reported.
Results
Characteristics of included studies
The literature search resulted in 1330 potentially eligible studies. After reviewing titles, abstracts, and full text-articles, 19 studies met our inclusion criteria (). For three studies by Henderson et al. [Citation3,Citation13,Citation28] and three studies by Chen et al. [Citation29–31], there was uncertainty about whether these studies reported on the same study sample. Consultation with the authors revealed that the studies of Henderson et al. reported on one study sample; therefore, only one study [Citation3] was included in this review. We did not succeed in contacting the group of Chen. We decided to include the GMFCS level I and II results for the lumbar spine and femur, as reported in one of their studies [Citation31]. Furthermore, we included part of another study by Chen et al. [Citation30] that focused on GMFCS level III and the calcaneus results. In total, 16 studies were included in the analysis.
The study of Esen et al. [Citation32] reported Z-score for four different adjustment methods (decimal age, bone age, height age, and height-for-age). According to the recommendation of the International Society for Clinical Densitometry [Citation27] to use if possible the Z-score adjusted for height, we decided to report only the Z-score adjusted for height. The Society also recommends measuring BMD in the total proximal femur or femur neck and not in the greater trochanter or Ward’s triangle [Citation6,Citation27]. Therefore, we did not report the results measured in these latter regions in the study of Han et al. [Citation33] and Kim et al. [Citation34]. Because most studies of the distal femur measured BMD in region 2 (mixture of cortical and trabecular bone), we report only results for region 2.
Characteristics of the included studies are presented in Supplementary Table S2. The included studies comprised a total of 465 persons with CP (GMFCS I–III) ranging in age from 1 to 65 years. Ten studies used reference data to interpret BMD in CP (Z-score) and six studies had a case–control design from which we calculated Z-score. Pooling of the results was not possible because of heterogeneity in patient characteristics and outcome measurements. Fourteen studies reported BMD results of the lumbar spine [Citation3,Citation12,Citation30–41], nine of the femur [Citation3,Citation12,Citation30,Citation31,Citation33,Citation34,Citation37,Citation38,Citation42], two of the calcaneus [Citation30,Citation36], two of the total body [Citation37,Citation42], and one of the radius and tibia [Citation43]. Most studies focused on children, but five focused on adults [Citation34,Citation38,Citation39] or a mixed age group [Citation3,Citation43]. The countries from which the participants were recruited were: Canada [Citation3,Citation12,Citation42], Taiwan [Citation30,Citation31], USA [Citation3,Citation39], England [Citation36], Turkey [Citation32], Norway [Citation37], Korea [Citation33], Israel [Citation43], and Pakistan [Citation41]. Four studies did not report the country from which the participants were recruited [Citation34,Citation35,Citation38,Citation40]. Five studies [Citation12,Citation30,Citation31,Citation40,Citation42] reported only on persons with spastic CP, three studies [Citation34,Citation37,Citation38] on other types of CP, and seven studies [Citation3,Citation32,Citation33,Citation35,Citation36,Citation39,Citation41,Citation43] did not report CP type.
Almost all studies used dual X-ray absorptiometry scan for measuring BMD. Three studies used quantitative computed tomography (QCT) [Citation35,Citation36,Citation39] and three studies used ultrasound of the calcaneus [Citation30,Citation36], or radius and tibia [Citation43].
Methodological quality
The methodological quality results are shown in . Ten studies (63%) were classified as high-quality [Citation3,Citation12,Citation30,Citation31,Citation35,Citation37,Citation38,Citation40–42] and six (37%) as low-quality [Citation32–34,Citation36,Citation39,Citation43]. The most common methodological shortcomings were (1) study samples that were not consecutive or an obviously representative series of cases (88%); and (2) the total number of cases was less than 50 (63%).
Table 2. Methodological quality of the studies.
Bone mineral density results
Lumbar spine
GMFCS I
Five high-quality studies [Citation12,Citation31,Citation35,Citation37,Citation41] reported BMD results of the lumbar spine in children classified as GMFCS level I ( and ). An exact lumbar spine level was not reported. According to Z-score ≤ −2.0, there was no low BMD noted. However, Akhter et al. [Citation41] reported an average Z-score of −1.30 (SD 0.09, p < 0.0001). According to the best-evidence synthesis regarding Z-score ≤ −2.0, there was no evidence for low BMD. Regarding Z-score ≤ −1.0, there was conflicting evidence for low BMD of the lumbar spine in children with GMFCS level I.
Table 3. Evidence for low bone mineral density.
Table 4. Bone mineral density results for children.
Table 5. Bone mineral density results for combined groups of children and adults.
Table 6. Bone mineral density results for adults.
We found no studies of BMD of the lumbar spine in adults with GMFCS level I ( and ).
GMFCS II
Five high-quality studies [Citation12,Citation31,Citation35,Citation37,Citation41] reported BMD results of the lumbar spine in children classified as GMFCS level II ( and ). According to Z-score ≤ −2.0, none of these studies found low BMD. However, Akhter et al. [Citation41] reported an average Z-score of −1.68 (SD 0.33, p < 0.0001) and Finbråten et al. [Citation37] of −1.4 (SD 1.3, p < 0.01). According to the best-evidence synthesis regarding Z-score ≤ −2.0, there was no evidence for low BMD. Regarding Z-score ≤ −1.0, there was conflicting evidence for low BMD of the lumbar spine in children with GMFCS level II. We found no studies of BMD of the lumbar spine in adults with GMFCS level II ( and ).
GMFCS III
Four high-quality studies [Citation12,Citation30,Citation35,Citation41] and two low-quality studies [Citation33,Citation36] reported BMD of the lumbar spine in children with GMFCS level III ( and ). Regarding Z-score ≤ −2.0, the low-quality study of Wilmshurst et al. [Citation36] reported low BMD at T12-L3 (Z-score −2.12, SD 1.2, p < 0.05). Furthermore, the high-quality studies of Akhter et al. [Citation41] (Z-score −1.86, SD 0.20, p < 0.0001) and Chen et al. [Citation30] (Z-score −1.1, SD 0.6, p < 0.01; L1–L4) reported Z-score ≤ −1.0. According to the best-evidence synthesis regarding Z-score ≤ −2.0 and regarding Z-score ≤ −1.0, there was conflicting evidence for low BMD of the lumbar spine in children with GMFCS level III ().
In the high-quality study by Henderson et al. [Citation3], which included persons up to 19 years of age, BMD lumbar spine results were reported for GMFCS level III ( and ). Regarding Z-score ≤ −2.0, no low BMD of the lumbar spine was noted. However, Henderson et al. [Citation3] reported a Z-score of −1.5 (SD 0.9, p < 0.001; lumbar spine level was not reported). According to the best-evidence synthesis regarding Z-score ≤ −2.0, there was no evidence for low BMD. Regarding Z-score ≤ −1.0, there was moderate evidence for low BMD of the lumbar spine in a combined group of children and adults up to 19 years of age at GMFCS level III.
The high-quality study by Fowler et al. [Citation38] reported BMD results of the lumbar spine (spine level not reported) in adults with GMFCS level III ( and ); no low BMD was reported, neither regarding Z-score ≤ −2.0 nor regarding Z-score ≤ −1.0). According to the best-evidence synthesis (both regarding Z ≤ −2.0 and regarding Z ≤ −1.0), there was no evidence for low BMD of the lumbar spine in adults with GMFCS level III.
GMFCS I − II combined
Two low-quality studies [Citation33,Citation36] reported BMD of the lumbar spine in children with combined GMFCS levels I and II ( and ). None of these studies reported low BMD according to Z-score ≤ −2.0. However, Wilmshurst et al. [Citation36] reported a Z-score of −1.08 (SD 0.9, p < 0.05; T12-L3). According to the best-evidence synthesis regarding Z-score ≤ −2.0, there was no evidence for low BMD. Regarding Z-score ≤ −1.0, there was conflicting evidence for low BMD of the lumbar spine in children within the combined GMFCS levels I and II group.
The high-quality study by Fowler et al. [Citation38] reported BMD results of the lumbar spine (lumbar spine level not reported) in adults with GMFCS levels I and II combined ( and ); no low BMD was reported according to Z-score ≤ −2.0; however, they reported a Z-score of −1.07, (SD 1.0, p < 0.001). According to the best-evidence synthesis regarding Z-score ≤ −2.0, there was no evidence for low BMD. Regarding Z-score ≤ −1.0, there was moderate evidence for low BMD of the lumbar spine in adults of a group with GMFCS levels I and II combined.
GMFCS I–II–III combined
Two high-quality studies [Citation37,Citation40] and one low-quality study [Citation32] reported BMD results of the lumbar spine in a combined group of children with GMFCS levels I, II, and III ( and ). None of the studies reported low BMD according to Z-score ≤ −2.0. However, the low-quality study of Esen et al. [Citation32] reported an average Z-score of −1.21 at L1–L4 (SD 1.4, p < 0.001). According to the best-evidence synthesis regarding Z-score ≤ −2.0, there was no evidence for low BMD. Regarding Z-score ≤ −1.0, there was conflicting evidence for low BMD of the lumbar spine in a combined group of children with GMFCS levels I, II, and III.
Two low-quality studies [Citation34,Citation39] reported BMD results of the lumbar spine in adults with GMFCS levels I, II, and III combined ( and ). Kim et al. [Citation34] reported the results separately for the spastic type and dyskinetic type of CP without mentioning if the BMD was measured in trabecular or in cortical bone of the lumbar vertebras. The study of Peterson et al. [Citation39] reported the results separately for trabecular and cortical bone without mentioning the type of CP. No low BMD was noted, neither regarding Z-score ≤ −2.0 nor regarding Z-score ≤ −1.0. According to the best-evidence synthesis (both regarding Z-score ≤ −2.0 and regarding Z-score ≤ −1.0), there was no evidence for low BMD of the lumbar spine in adults with GMFCS levels I, II, and III combined.
Femur
Total proximal femur
Two high-quality studies, one by Henderson et al. [Citation12] and one by Chad et al. [Citation42], reported BMD of the total proximal femur in children with different GMFCS levels ( and ). Regarding Z-score ≤ −2.0, Henderson et al. [Citation12] reported low BMD in children with GMFCS level III (Z-score of −2.3 SD 1.2, p < 0.001). For GMFCS level I, GMFCS level II, and GMFCS levels I and II combined, no low BMD was reported, neither regarding Z-score ≤ −2.0 nor regarding Z-score ≤ −1.0 [Citation12,Citation42]. According to the best-evidence synthesis regarding Z-score ≤ −2.0 and regarding Z-score ≤ −1.0, there was moderate evidence for low BMD of the total proximal femur in children with GMFCS level III. There was no evidence (not regarding Z-score ≤ −2.0 nor regarding Z-score ≤ −1.0) for low BMD of the total proximal femur in children with GMFCS level I, II, or in a group with GMFCS levels I and II combined.
One high-quality study by Fowler et al. [Citation38] and one low-quality study by Kim et al. [Citation34] reported BMD results of the total proximal femur in adults with different GMFCS levels ( and ). None of these studies reported low BMD according to Z-score ≤ −2.0. However, the high-quality study of Fowler et al. [Citation38] reported in GMFCS level III a Z-score of −1.23 (SD 0.9, p < 0.01) and the low-quality study of Kim et al. [Citation34] reported in GMFCS levels I–II–III combined (spastic type) a Z-score of −1.2, (SD 1.0, p = 0.001). According to the best-evidence synthesis regarding Z-score ≤ −2.0, there was no evidence for low BMD in the group of adults with GMFCS levels I and II combined, GMFCS level III, and adults with spastic and dyskinetic type of CP with GMFCS levels I, II, and III combined. According to the best-evidence synthesis regarding Z-score ≤ −1.0, there was moderate evidence for low BMD of the total proximal femur in adults with GMFCS level III and limited evidence for low BMD of the total proximal femur in adults with spastic type of CP with GMFCS levels I, II and III combined. In addition, according to the best-evidence synthesis regarding Z-score ≤ −1.0, there was no evidence for low BMD of the total proximal femur in adults in a group with GMFCS level I and II combined, as well as in adults with dyskinetic type of CP with GMFCS levels I, II, and III.
Proximal femur: femur neck
The high-quality study by Chad et al. [Citation42] and the low-quality study by Han et al. [Citation33] reported BMD of the femur neck in children with different GMFCS levels ( and ). The low-quality study of Han et al. [Citation33] reported in a group with GMFCS levels I and II combined a Z-score of −1.0 (SD 0.6, p = 0.05). According to the best-evidence synthesis regarding Z-score ≤ −2.0, there was no evidence for low BMD of the femur neck in children with GMFCS levels I and II combined or with GMFCS level III. According to the best-evidence synthesis regarding Z ≤ −1.0, there was conflicting evidence for low BMD of the femur neck in children with GMFCS levels I and II combined and no evidence for children with GMFCS level III.
One high-quality study by Fowler et al. [Citation38] and one low-quality study by Kim et al. [Citation34] reported BMD of the femur neck in adults with different GMFCS levels ( and ). No low BMD was reported, neither regarding Z-score ≤ −2.0 nor regarding Z-score ≤ −1.0. According to the best-evidence synthesis, there was no evidence for low BMD of the femur neck in adults with GMFCS level III, levels I and II combined, or levels I, II, and III combined, both regarding Z-score ≤ −2.0 and regarding Z score ≤ −1.0.
Distal femur
Three high-quality studies [Citation30,Citation31,Citation37] reported BMD of the distal femur in children with different GMFCS levels ( and ). Two studies [Citation31,Citation37] reported BMD results in region 2 (mixture of cortical and trabecular bone); one study [Citation30] did not report the specific region of BMD measurement. For GMFCS level I, no low BMD was reported, neither regarding Z-score ≤ −2.0 nor regarding Z-score ≤ −1.0. For GMFCS level II, Finbråten et al. [Citation37] reported low BMD (Z-score −2.8, SD 1.2, p < 0.001), whereas Chen et al. [Citation31] reported no low BMD according to Z-score ≤ −2.0. For GMFCS levels I, II, and III combined, Finbråten et al. [Citation37] reported no low BMD according to Z-score ≤ −2.0 (Z-score −1.6, SD 1.8, p < 0.001). According to the best-evidence synthesis regarding Z-score ≤ −2.0 and Z-score ≤ −1.0, there was conflicting evidence for low BMD of the distal femur in children with GMFCS level II. Furthermore, there was no evidence for low BMD of the distal femur in children with GMFCS level I, GMFCS level III, or in a group combining GMFCS levels I, II, and III regarding Z-score ≤ −2.0. According to the best-evidence synthesis regarding Z-score ≤ −1.0, there was moderate evidence for low BMD of the distal femur in a group combining GMFCS levels I, II and III and no evidence for low BMD for GMFCS levels I and III.
The high-quality study of Henderson et al. [Citation3] reported distal femur results (region 2, a mixture of cortical and trabecular bone) in a sample that included persons up to 19 years of age with GMFCS level III. Regarding Z-score ≤ −2.0, no low BMD was reported; however, Henderson et al. [Citation3] reported a Z-score of −1.8, (SD 1.3, p < 0.001). According to the best-evidence synthesis regarding Z-score ≤ −2.0, there was no evidence for low BMD of the distal femur in a combined group of children and adults up to 19 years of age with GMFCS level III. According to the best-evidence synthesis regarding Z-score ≤ −1.0, there was moderate evidence for low BMD of the distal femur in a group combining children and adults up to 19 years of age with GMFCS level III.
Calcaneus
The high-quality study of Chen et al. [Citation30] and the low-quality study of Wilmshurst et al. [Citation36] reported BMD results of the calcaneus in children with different GMFCS levels ( and ). In a group with GMFCS levels I and II combined, Wilmshurst et al. [Citation36] and Chen et al. [Citation30] reported no low BMD regarding Z-score ≤ −2.0. However, Wilmshust et al. [Citation36] reported a Z-score of −1.07, SD 1.0, p < 0.01. Likewise, no low BMD was reported regarding Z-score ≤ −2.0 in the GMFCS level III group, but the studies by Wilmshurst et al. [Citation36] (Z-score −1.85, SD 1.0, p < 0.05) and Chen et al. [Citation30] (Z-score −1.71, SD 0.7, p < 0.001) reported low BMD regarding Z-score ≤ −1.0. According to the best-evidence synthesis regarding Z score ≤ −2.0, there was no evidence for low BMD of the calcaneus in children in a combined group with GMFCS levels I and II or GMFCS level III group. According to the best-evidence synthesis regarding Z-score ≤ −1.0, there was conflicting evidence for low BMD of the calcaneus in children in a combined group with GMFCS level I and II. In addition, there was moderate evidence for low BMD of the calcaneus in children with GMFCS level III.
We found no studies regarding BMD of the calcaneus in adults (GMFCS I–III) ( and ).
Radius
The low-quality study of Hartman et al. [Citation43] reported BMD results of the radius in a sample of persons up to 29 years of age with GMFCS levels I and II ( and ). According to Z-score ≤ −2.0, no low BMD was reported for GMFCS level I (Z-score –1.7, SD 0.5, p < 0.01) or GMFCS level II. According to the best-evidence synthesis regarding Z-score ≤ −2.0, there was no evidence for low BMD of the radius in a group of children and adults up to 29 years of age with GMFCS level I or GMFCS level II. According to the best-evidence synthesis regarding Z-score ≤ −1.0, there was limited evidence for low BMD of the radius in a group of children and adults up to 29 years of age with GMFCS level I and no evidence for GMFCS level II.
Tibia
The low-quality study by Hartman et al. [Citation43] reported BMD results for the tibia in a sample that included persons aged 1–29 years with GMFCS levels I and II ( and ). No low BMD was reported, not regarding Z-score ≤ −2.0 nor regarding Z-score ≤ −1.0 in GMFCS level I or GMFCS level II. According to the best-evidence synthesis regarding Z-score ≤ −2.0 and Z ≤ −1.0, there was no evidence for low BMD of the tibia in a combined group of children and adults up to 29 years of age with GMFCS level I and GMFCS level II.
Total body
Two high-quality studies [Citation37,Citation42] reported BMD results of the total body for children with different GMFCS levels ( and ). Regarding Z-score ≤ −2.0, for GMFCS level I, Finbråten et al. [Citation37] reported no low BMD (Z-score −1.5, SD 0.9, p < 0.001). However, the same study showed low BMD for GMFCS level II (Z-score −2.2, SD 1.1, p < 0.001). In a group combining GMFCS levels I and II, Chad et al. [Citation42] reported no low BMD. According to the best-evidence synthesis regarding Z-score ≤ −2.0, there was moderate evidence for low BMD of the total body for children with GMFCS level II. There was no evidence for low BMD of the total body in children with GMFCS level I or in a combined group with GMFCS levels I and II. According to the best-evidence synthesis regarding Z-score ≤ −1.0, there was moderate evidence for low BMD of the total body in children with GMFCS levels I and II and no evidence for BMD of the total body in a combined group with GMFCS levels I and II.
We found no studies regarding BMD of the total body in children with GMFCS III and in adults (GMFCS I–III) ( and ).
Discussion
According to our primary best-evidence synthesis regarding a Z-score ≤ −2, which follows the International Society For Clinical Densitometry [Citation6,Citation27], we found moderate evidence for low BMD of the total proximal femur in children with GMFCS III and of the total body in children with GMFCS level II. Furthermore, we found conflicting evidence for low BMD of the distal femur in children with GMFCS level II and of the lumbar spine in children with GMFCS level III. We found no evidence for low BMD in children with GMFCS I, in adults, or in other parts of the body. However, Z-scores ≤ −1 were found in several parts of the body and in several groups. Although this cutoff value is not in accordance with the criteria of the International Society for Clinical Densitometry [Citation6,Citation27], it may indicate a tendency towards low BMD and may be clinically important considering timely prevention. In addition, it is unknown whether BMD Z-score > −2 is associated with more fragility or increased fracture risk [Citation6,Citation27].
The moderate evidence we found for low BMD of the total proximal femur in children with GMFCS level III is consistent with our expectations, as the duration and number of standing and walking activities decreases with worsening gross motor functioning [Citation9]. In contrast, there was no evidence for low BMD of the total proximal femur for adults with GMFCS level III. However, the best-evidence synthesis regarding Z-score ≤ −1.0 suggests a tendency towards low BMD of the total proximal femur in adults with GMFCS level III. In addition, this secondary analysis showed limited evidence for a tendency towards low BMD of the total proximal femur in a combined group of adults with spastic type CP with GMFCS I–II–III.
The finding of moderate evidence for low BMD of the total body in children with GMFCS II was surprising, because we did not find evidence for low BMD in children with GMFCS II in most parts of the body except for the distal femur (conflicting evidence, same result for the best-evidence synthesis regarding Z-score ≤ −1.0). This finding of conflicting evidence for the distal femur was also remarkable because we found no evidence for low BMD in the same region in children with GMFCS level III .However, the best-evidence syntheses regarding Z-score ≤ −1 pointed at a tendency towards low BMD in several groups and in several regions, which may explain the above discrepancy.
Several studies explored BMD in non-ambulatory persons with CP (GMFCS IV–V), [Citation3,Citation16,Citation17,Citation30,Citation32,Citation35,Citation37,Citation44]. These studies focused primarily on BMD of the femur and lumbar spine in children, and generally showed that low BMD is a serious problem in children with severe CP [Citation3,Citation16,Citation17,Citation32,Citation42]. The BMD Z-score in these studies ranged from −2.4 to −3.8 for the femur and from −1.8 to −2.2 for the lumbar spine. Compared with these studies, the average BMD deficits we found in ambulatory persons with CP were less severe. It is worth mentioning that this study focuses on mean Z-scores from various studies, while variability between subjects within a study exists, as some individuals will have lower Z-scores than the mean while others will have higher scores. Our findings are in line with our expectations, as nutritional problems, epilepsy, and inactivity (including fewer weight-bearing activities) occur less frequently in ambulatory persons with CP [Citation9,Citation10,Citation19,Citation30,Citation38].
For non-ambulatory children at risk for low BMD, regular BMD evaluation and vitamin D and calcium intake optimization is advised [Citation16]. One might argue to also use a similar strategy in ambulatory children with CP (particularly for GMFCS II and III). However, although nutritional adaptations may improve BMD, it is yet unclear whether this results in fewer fractures [Citation45]. It is also unclear to what extent nutritional problems and medication determine low BMD in ambulatory persons with CP. Given the generally low activity levels in ambulatory persons with CP, a more active lifestyle with more weight-bearing activities is a potential strategy to improve BMD as well. Because the literature on BMD in ambulatory persons with CP, particularly adults, is scarce, more research is required before specific recommendations can be made for treatment in this population. Future research should also address fracture risk because the literature on the relationship between low BMD and fractures is limited and conflicting, and is primarily based on retrospective self-reports [Citation12,Citation46,Citation47].
The strength of our systematic review is that we retrieved and combined data from available studies on BMD from various countries. However, some limitations should be mentioned: (1) dual X-ray absorptiometry was the most frequently used method for measuring BMD, but other methods were also used. The International Society for Clinical Densitometry stated in 2013 that dual X-ray absorptiometry is the preferred method for clinical densitometry evaluation in children and adults [Citation27]. However, the dual X-ray absorptiometry scan has limitations. The bone is a three-dimensional structure that is measured two-dimensionally by dual X-ray absorptiometry; this can lead to underestimation of BMD in small bones and overestimation of BMD in large bones [Citation26,Citation48–50]. The QCT measures volumetric BMD but, because of limited reference data and higher radiation dose, this method is not regularly used [Citation26,Citation48,Citation49]. There are also limited reference data for ultrasound. (2) Muscle and joint contractures may have influenced BMD measurements. McDowell et al. [Citation51] reported a significant reduction of the passive range of motion with increasing functional limitation. Scoliosis and metallic implants may also have limited BMD measurements. The risk of developing scoliosis also increases with increasing functional limitations [Citation52]. (3) In most studies, participants were recruited from only one hospital or rehabilitation center, which may have resulted in selection bias. Only the high-quality study of Henderson et al. [Citation3] included participants from multiple centers. Furthermore, studies focused primarily on children. (4) Because of the heterogeneity of CP, we decided to present the evidence as much as possible by GMFCS level. This grouping often resulted in small sample sizes per level. Because not all studies used the GMFCS classification, we had to infer GMFCS level in some studies. (5) Some research groups have published several articles on BMD, so we had to use our own judgment regarding study inclusion in those cases. (6) Most studies did not focus on differences in BMD between ambulatory persons with CP (GMFCS I–III) and typically developing persons, but on differences between persons with CP across all GMFCS levels, including non-ambulatory persons, and typically developing persons. Therefore, we had to calculate significance levels for several studies. (7) Finally, five of the included studies only presented average BMD (SD) levels in persons with CP and typically developing persons. Thus, we had to calculate average (SD) Z-score from these data. Because we only included studies containing a typically developing group ≥15 persons, we expect only a minor effect of this procedure on our conclusions.
In conclusion, we found moderate and conflicting evidence for low BMD of several body parts (total proximal femur, total body, distal femur, and lumbar spine) in children with GMFCS II and III. This suggests that mainly children with GMFCS II and III are vulnerable to low BMD. However, the results of the secondary best-evidence syntheses for Z-score ≤ −1.0, suggest a tendency towards low BMD in other regions than the above in children with GMFCS II and III and also in children with GMFCS I and adults. Although more high-quality research is needed, including adults and fracture risk assessment, the current study indicates that deficits in BMD are not restricted to non-ambulatory people with CP.
Supplemental Material
Download PDF (239.5 KB)Disclosure statement
No potential conflict of interest was reported by the authors.
Additional information
Funding
Related Research Data
References
- Surveillance of cerebral palsy in Europe: a collaboration of cerebral palsy surveys and registers. Dev Med Child Neurol. 2001;42:816.
- Bax M, Goldstein M, Rosenbaum P, et al. Proposed definition and classification of cerebral palsy, April 2005. Dev Med Child Neurol. 2005;47:571–576.
- Henderson RC, Lark RK, Gurka MJ, et al. Bone density and metabolism in children and adolescents with moderate to severe cerebral palsy. Pediatrics. 2002;110:e5.
- Sullivan PB, Lambert B, Rose M, et al. Prevalence and severity of feeding and nutritional problems in children with neurological impairment: Oxford feeding study. Dev Med Child Neurol. 2007;42:674–680.
- Houlihan CM. Bone health in cerebral palsy: who's at risk and what to do about it? J Pediatr Rehabil Med. 2014;7:143–153.
- Schousboe JT, Shepherd JA, Bilezikian JP, et al. Executive summary of the 2013 international society for clinical densitometry position development conference on bone densitometry. J Clin Densitom. 2013;16:455–466.
- Coppola G, Fortunato D, Auricchio G, et al. Bone mineral density in children, adolescents, and young adults with epilepsy. Epilepsia. 2009;50:2140–2146.
- Nooijen CFJ, Slaman J, Stam HJ, et al. Inactive and sedentary lifestyles amongst ambulatory adolescents and young adults with cerebral palsy. J Neuroeng Rehabil. 2014;11:49.
- Shkedy Rabani A, Harries N, Namoora I, et al. Duration and patterns of habitual physical activity in adolescents and young adults with cerebral palsy. Dev Med Child Neurol. 2014;56:673–680.
- Nieuwenhuijsen C, van der Slot WMA, Beelen A, et al. Inactive lifestyle in adults with bilateral spastic cerebral palsy. J Rehabil Med. 2009;41:375–381.
- Carlon SL, Taylor NF, Dodd KJ, et al. Differences in habitual physical activity levels of young people with cerebral palsy and their typically developing peers: a systematic review. Disabil Rehabil. 2012;35:647–655.
- Henderson RC, Lin PP, Greene WB. Bone-mineral density in children and adolescents who have spastic cerebral palsy. J Bone Joint Surg Am. 1995;77:1671–1681.
- Henderson RC, Kairalla JA, Barrington JW, et al. Longitudinal changes in bone density in children and adolescents with moderate to severe cerebral palsy. J Pediatr. 2005;146:769–775.
- King W, Levin R, Schmidt R, et al. Prevalence of reduced bone mass in children and adults with spastic quadriplegia. Dev Med Child Neurol. 2003;45:12–16.
- Shaw NJ, White CP, Fraser WD, et al. Osteopenia in cerebral palsy. Arch Dis Child. 1994;71:235–238.
- Mergler S, Evenhuis HM, Boot AM, et al. Epidemiology of low bone mineral density and fractures in children with severe cerebral palsy: a systematic review. Dev Med Child Neurol. 2009;51:773–778.
- Houlihan CM, Stevenson RD. Bone density in cerebral palsy. Phys Med Rehabil Clin N Am. 2009;20:493–508.
- Palisano RJ, Rosenbaum P, Bartlett D, et al. Content validity of the expanded and revised gross motor function classification system. Dev Med Child Neurol. 2008;50:744–750.
- Shevell MI, Dagenais L, Hall N. Comorbidities in cerebral palsy and their relationship to neurologic subtype and GMFCS level. Neurology. 2009;72:2090–2096.
- Wells GS, O'Connell D, Peterson J, et al. The Newcastle-Ottawa Scale (NOS) for assessing the quality of nonrandomized studies in meta-analyses [Internet]. Ottawa (ON): Ottawa Hospital Research Institute, Department of Clinical Epidemiology. 2014 [cited 2016 Jan 30].
- Offringa MA, Scholten R. Inleiding in evidence-based medicine, klinisch handelen gebaseerd op bewijsmateriaal. 3rd ed. Houten: Bohn Stafleu van Loghum; 2008.
- Huisstede B, Miedema HS, van Opstal T, et al. Interventions for treating the radial tunnel syndrome: a systematic review of observational studies. J Hand Surg. 2008;33:72.e71–72.e10.
- Huisstede BMA, Miedema HS, van Opstal T, et al. Interventions for treating the posterior interosseus nerve syndrome: a systematic review of observational studies. J Peripher Nerv Syst. 2006;11:101–110.
- van Rijn RM, Huisstede BMA, Koes BW, et al. Associations between work-related factors and specific disorders at the elbow: a systematic literature review. Rheumatology. 2008;48:528–536.
- van Rijn RM, Huisstede BMA, Koes BW, et al. Associations between work-related factors and specific disorders of the shoulder – a systematic review of the literature. Scand J Work Environ Health. 2010;36:189–201.
- Hombergen SP, Huisstede BM, Streur MF, et al. Impact of cerebral palsy on health-related physical fitness in adults: systematic review. Arch Phys Med Rehabil. 2012;93:871–881.
- Gordon CM, Leonard MB, Zemel BS. 2013 pediatric position development conference: executive summary and reflections. J Clin Densitom. 2014;17:219–224.
- Henderson RC, Kairalla J, Abbas A, et al. Predicting low bone density in children and young adults with quadriplegic cerebral palsy. Dev Med Child Neurol. 2004;46:416–419.
- Chen C, Ke J, Lin K, et al. Anthropometric and fitness variables associated with bone mineral density and broadband ultrasound attenuation in ambulatory children with cerebral palsy. J Child Neurol. 2011;26:552–559.
- Chen C-L, Ke J-Y, Wang C-J, et al. Factors associated with bone density in different skeletal regions in children with cerebral palsy of various motor severities. Dev Med Child Neurol. 2010;53:131–136.
- Chen CL, Lin KC, Wu CY, et al. Relationships of muscle strength and bone mineral density in ambulatory children with cerebral palsy. Osteoporos Int. 2011;23:715–721.
- Esen IDF, Guven A, Degerliyurt A, et al. Assessment of bone density in children with cerebral palsy by areal bone mineral density measurement. Turk J Pediatr. 2011;53:638–644.
- Han D, Lee B. Bone mineral density variation in children with cerebral palsy based on the differences in weight bearing. J Phys Ther Sci. 2012;24:877–880.
- Kim W, Lee SJ, Yoon Y-K, et al. Adults with spastic cerebral palsy have lower bone mass than those with dyskinetic cerebral palsy. Bone. 2015;71:89–93.
- Wren TA, Lee DC, Kay RM, et al. Bone density and size in ambulatory children with cerebral palsy. Dev Med Child Neurol. 2010;53:137–141.
- Wilmshurst S, Ward K, Adams JE, et al. Mobility status and bone density in cerebral palsy. Arch Dis Child. 1996;75:164–165.
- Finbråten AK, Syversen U, Skranes J, et al. Bone mineral density and vitamin D status in ambulatory and non-ambulatory children with cerebral palsy. Osteoporos Int. 2015;26:141–150.
- Fowler EG, Rao S, Nattiv A, et al. Bone density in premenopausal women and men under 50 years of age with cerebral palsy. Arch Phys Med Rehabil. 2015;96:1304–1309.
- Peterson MD, Zhang P, Haapala HJ, et al. Greater adipose tissue distribution and diminished spinal musculoskeletal density in adults with cerebral palsy. Arch Phys Med Rehabil. 2015;96:1828–1833.
- Unay BSS, Vurucu S, Inanc N, et al. Evaluation of bone mineral density in children with cerebral palsy. Turk J Pediatr. 2003;45:11–14.
- Akhter N, Khan AA, Ayyub A. Motor impairment and skeletal mineralization in children with cerebral palsy. J Pak Med Assoc. 2017;67:200–203.
- Chad KE, McKay HA, Zello GA, et al. Body composition in nutritionally adequate ambulatory and non-ambulatory children with cerebral palsy and a healthy reference group. Dev Med Child Neurol. 2000;42:334–339.
- Hartman C, Brik R, Tamir A, et al. Bone quantitative ultrasound and nutritional status in severely handicapped institutionalized children and adolescents. Clin Nutr. 2004;23:89–98.
- Yoon YK, Kim AR, Kim OY, et al. Factors affecting bone mineral density in adults with cerebral palsy. Ann Rehabil Med. 2012;36:770.
- Fehlings D, Switzer L, Agarwal P, et al. Informing evidence-based clinical practice guidelines for children with cerebral palsy at risk of osteoporosis: a systematic review. Dev Med Child Neurol. 2011;54:106–116.
- Henderson RC. Bone density and other possible predictors of fracture risk in children and adolescents with spastic quadriplegia. Dev Med Child Neurol. 2008;39:224–227.
- Trinh A, Wong P, Fahey MC, et al. Musculoskeletal and endocrine health in adults with cerebral palsy: new opportunities for intervention. J Clin Endocrinol Metab. 2016;101:1190–1197.
- van Kuijk C. Pediatric bone densitometry. Radiol Clin North Am. 2010;48:623–627.
- Gilsanz V. Bone density in children: a review of the available techniques and indications. Eur J Radiol. 1998;26:177–182.
- Gilsanz V, Wren T. Assessment of bone acquisition in childhood and adolescence. Pediatrics. 2007;119(Suppl):S145–S149.
- McDowell BC, Salazar-Torres JJ, Kerr C, et al. Passive range of motion in a population-based sample of children with spastic cerebral palsy who walk. Phys Occup Ther Pediatr. 2012;32:139–150.
- Persson-Bunke M, Hägglund G, Lauge-Pedersen H, et al. Scoliosis in a total population of children with cerebral palsy. Spine (Phila Pa 1976). 2012;37:E708–E713.