
Abstract
Background: Accelerometers are accurate tools to assess movement and physical activity. However, interpreting standardly used outputs is not straightforward for populations with impaired mobility.
Methods: The applicability of GENEActiv was explored in a group of 30 participants with myotonic dystrophy and compared to a group of 14 healthy-controls. All participants performed a set of tests while wearing four different accelerometers (wrists and ankles): [1] standing still; [2] ten-meters walk test; [3] six-minutes walking test; and, [4] ten-meters walk/run test.
Results: Relevant findings were: [1] high intra-accelerometer reliability (i.e. 0.97 to 0.99; p < 0.001); [2] each test acceleration values differ significantly between each other; [3] no inter-accelerometer reliability between wrist-worn devices and ankle-worn; and [4] a significant difference between the myotonic dystrophy group and the healthy-controls detectable at each test (i.e. Left-ankle values at six-minutes walking test: 48±17 for the myotonic dystrophy group, vs, 74±16 for the healthy-controls; p < 0.001).
Conclusions: GENEActiv demonstrated to be valid and reliable, capable of detecting walking periods and discriminating different speeds. However, inter-accelerometer reliability only applied when comparing opposite sides of the same limb. Specific movement characteristics of the myotonic dystrophy group were identified and muscle strength showed not to be a full determinant of limb acceleration.
Rehabilitation professionals in the field of neuromuscular disorders should be aware of the potential use of objective monitoring tools such as accelerometers whilst acknowledging the implications of assessing populations with altered movement patterns.
Researchers should be cautious when translating accelerometry outputs previously validated in healthy populations to functionally impaired cohorts like myotonic dystrophy.
Accelerometers can objectively expose movement disturbances allowing further investigations for the source of these disturbances.
Implications for rehabilitation
Introduction
In recent years, accelerometers have been proposed as accurate and sensitive tools to assess movement patterns, physical activity intensity, daily life activity behaviour and sleep in healthy and disabled populations [Citation1,Citation2]. Accelerometer outputs derive from detecting and recording body acceleration and deceleration over specific periods of time that can later be transformed into meaningful outputs such as energy expenditure or step counts [Citation3]. This type of technology has increasingly been implemented to investigate diseases with impaired mobility including neuromuscular disorders [Citation4–6]. However, the majority of these more clinically meaningful outputs are obtained from validation studies using healthy individuals and the translation to diseased or physically impaired individuals is not that straightforward and requires further validations [Citation7,Citation8].
Myotonic Dystrophy type 1 (DM1) is a rare autosomal dominant neuromuscular disorder, which affects multiple organ systems resulting in signs of premature ageing, muscle weakness, myotonia and fatigue among other symptoms [Citation9,Citation10]. This is the most common inherited muscular dystrophy amongst adults encompassing about 30% of genetic caused neuromuscular disorder in this age group [Citation11]. Muscle weakness, regardless of having a relatively slow progression, has proven to impact significantly on patient’s ambulation and balance, most particularly the ankle weakness [Citation12,Citation13]. The combination of muscle weakness and the fatigue and daytime sleepiness, results in a population less active and with reduced social participation [Citation14,Citation15]. There is no current drug on market available for these patients so alternative methods to improve patient’s quality of life have been proposed [Citation16]. Targeting DM1 disturbed physical activity patterns has been proposed as a possible method to combat fatigue and increase daily life participation [Citation17,Citation18].
Activity monitors (including accelerometers) may help to (1) determine whether altered activity behaviours are present in this cohort independent of time and location of the probands; (2) establish an ideal dose of physical activity required to impact on specific health parameters; (3) set measurable goals for activity-related interventions; and (4) establish a surrogate outcome measure for therapies that promise an improvement in patient’s mobility and performance [Citation19–21]. To optimally apply these tools we first must understand their usability in the target population. The purpose of this study was to compare accelerometry data between a DM1 cohort and healthy controls. To explore the reliability of their use to detect ambulation at different speeds; and finally, to assess which body location (wrist or ankle), if any, is better to place these devices when measuring ambulation in the DM1 population.
Methods
Participants
The DM1 group was recruited from an on-going DM1 natural history study in the United Kingdom (PHENODM1 study). This sub-study included 30 adult genetically confirmed DM1 patients who were recruited to one of the sites (Royal Victoria Infirmary – Newcastle Upon Tyne NHS Foundation Trust, Newcastle upon Tyne, United Kingdom) and assessed at baseline only. All DM1 participants provided written informed consent and completed the functional assessments independently (walking assistive devices and orthosis were permitted). The matched healthy-control group consisted of 14 adult participants from Newcastle University, Newcastle upon Tyne, United Kingdom. The study protocol was approved by the Newcastle and North Tyneside Ethics committee (Ref: NE/15/0178) and the Newcastle University Ethics committee (Ref: 5572/2016). All procedures performed in the study were in accordance with the Declaration of Helsinki.
For sub-group analysis, the DM1 group participants were classified as mild (i.e., late onset) if they met two of the three following criteria as assessed at baseline: (1) first symptoms reported at the age of 40 or older; (2) 200 or fewer repeats of the CTG nucleoid triplet (i.e., genotype severity); and (3) a score of 1 or 2 on the Muscular Impairment Rating Scale [Citation22]. The rest were categorized as classic (i.e., adult onset) phenotype [Citation23].
Study assessments
All participants wore four accelerometers at the same time: one on each limb (right wrist, right ankle, left wrist and left ankle) while performing different functional assessments following pre-established standardized operational procedures. Functional assessments performed were (1) stand still for a minimum of 10 s; (2) 6 min walking test (6MWT) [Citation24]; (3) 10 m walking test (10-mWT), where patients were requested to walk at their comfortable speed [Citation25]; and (4) 10 m walk/run test (10-mW/RT), where patients were requested to walk as fast as possible and if considered capable, running was allowed [Citation25]; and all followed this same sequential order. With these functional assessments, we aimed to elicit participants’ individual walking paces with 10-mWT representing selected (i.e., comfortable) pace, 6MWT representing fast walking pace and 10-mW/RT representing the fastest possible pace (including running). 10-mWT and 10-mW/RT were performed three times with a brief rest in between each test until participant’s reported recovery. MicroFet-2 in standardized testing positions was used to assess isometric strength of the DM1 group for the following muscles: ankle dorsiflexors, knee extensors and hip flexors.
Accelerometer
The GENEActiv (Activinsights Ltd., Cambridgeshire, United Kingdom) tri-axial accelerometer was utilized in this study, which can be worn on multiple body locations such as the wrist, ankle or hip. Wrist-worn GENEActiv data have demonstrated strong validity against indirect calorimetry for both physical activity and sedentary behaviour [Citation26,Citation27]. Accelerometer data was processed in R (www.cran.r-project.org) using R-package [Citation28]. The output metric (i.e., unit) used was Euclidean Norm Minus One – miligravitational units (ENMO – mg), which not only considers the acceleration in three planes provided by the device but also systematically includes gravity into its algorithm (as in (x2 + y2 + z2)1/2 – 1) making it more reliable for dynamic physical activity estimations [Citation29–31]. Prior to testing, all devices were configured equally to their maximum sampling frequency of 100 Hz.
Data extraction
Data extracted were converted into 1-s epochs (counts) and then imported into a custom-built Excel spread sheet that included a column for time (h:min:s) and a column for the acceleration value (ENMO – mg) registered at each second. Based on the assessor’s records, start and finish timings for each of the functional tasks and the closest 10 s were plotted to identify the real start point as the point with a visible increment in acceleration value and continued until the recorded finish time. For each functional set of data, the mean units per second was calculated and then multiplied by 60 to obtain a value per minute for each task [Citation32].
Statistical analysis
Gaussian distribution was tested for each individual set of data using Shapiro–Wilk test. For our initial aim, mean acceleration values per minute from each performed test were compared between the DM1 and the healthy-controls groups using Mann-Whitney U Test.
We performed a multivariate analysis of covariance (MANCOVA) adjusted by sex (male/female) and age (years) to corroborate if any differences were influenced by any of these factors.
To test the second and third aims, intra-class correlation coefficient (ICC) were estimated between accelerometers to assess inter-accelerometer reliability and Bland-Altman plots were used to examine the agreement level between the different body locations of the accelerometers (i.e., ankle versus wrist, right-ankle versus left-ankle and right-wrist versus left-wrist) [Citation33,Citation34]. Spearman’s correlation coefficients (rho) were also calculated for each functional test comparing accelerometry units per second with the results from each performed test (i.e., distance and speed) and muscle strength (i.e., myometry). All statistical analyses were performed using SPSS version 23 (IBM Corporation, Armonk, NY) and only results with p values ≤0.05 were considered as statistically significant for discussion and conclusion matters.
Results
The demographic variables show a Gaussian distribution for both groups (i.e., DM1 and healthy-controls), hence data were treated accordingly. Participants’ characteristics are presented in . There was an age difference between groups and in the total of meters completed for the 6MWT.
Table 1. Demographic characteristics of study sample presented by group. Data are presented as mean values or scores (standard deviation).
Regardless of the accelerometer placement site, mean acceleration values at each individual task differ significantly between DM1 and healthy-controls at both ankle and wrist reports with the exception of the times considered as standing still (). In the walking tests, the results from the wrist demonstrated closer or mildly overlapping 95% confidence interval between the DM1 group and the healthy-controls group, which was not the case for the ankle data (see ). The average acceleration detected when walking at a comfortable pace (10-mWT) and at a sub-maximal pace (6MWT) were higher in the ankle devices than in the wrist devices for both groups. When fastest pace was tested (10-mW/RT), the wrist-worn accelerometers detected the higher scores in the healthy-controls group, but not in the DM1 (). However, when the DM1 participants were sub-divided into mild (n = 7) and classic (n = 23) phenotypes (refer to methods), the mild-sub-group showed the same pattern as the healthy participants, but not for the more severe (classic) phenotype (). With the exception of the left wrist worn accelerometer at the 10-mWT (), the MANCOVA did not show any changes on the significance levels when adjusting by sex nor age.
Figure 1. Box plots representing the accelerometer reports for each test per limb-placement. (a) The 10-m walking at comfortable pace test (10-mWT); and (b) the 10-m walk/run test (10-mW/RT) which implies the fastest pace performed. (c) The DM1 group sub-divided into classic and mild phenotypes (classification explained in methods). Values on the y-axis represent the average of acceleration (ENMO-mg) per minute for each test. Values on the x-axis showed the two groups tested: DM1 and healthy controls.
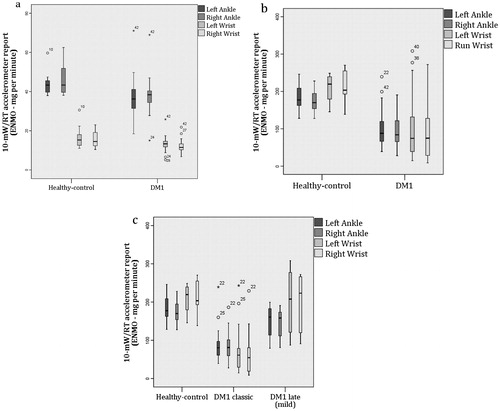
Table 2. Mean acceleration units for each performed task presented by group.
When comparing accelerometers within themselves (i.e., intra-accelerometer ICC) values ranged from 0.86 (95% CI 0.74–0.93, p = 0.003; DM1 cohort during the 10-mWT) to 0.97 (95% CI 0.95–0.99, p < 0.001; DM1 during the 6MWT) for the walking tests. During the running test (i.e., 10-mW/RT), intra-accelerometer reliability was higher (p=) for the DM1 cohort (0.96; 95% CI 0.93–0.98, p < 0.001) than for the healthy controls (0.76; 95% CI 0.38–0.93, p < 0.001). By comparing the values obtained from each limb between each other inter-accelerometer reliability was estimated. Both groups (i.e., DM1 and healthy-controls) presented similar result patterns. There was no agreement between devices placed in the wrist when compared to those placed in the ankle at neither of the performed tasks. For example, the coefficient estimated for the left-wrist accelerometer against left-ankle one during the 6MWT was of 0.59 (95% CI −0.12 to 0.88, p < 0.001). Devices on the same body location but opposite sides presented good reliability (i.e., ICC >0.8) for all performed tasks with the exception of left-wrist versus right-wrist when standing still (ICC = 0.62; 95% CI −0.53 to 0.9, p < 0.001). However, the confidence interval of the mean agreement got wider at faster speeds more obvious on the healthy-controls group. For example, the coefficient estimated between left-ankle and right-ankle during the 6MWT was 0.98 (95% CI 0.93–0.99, p < 0.001) and for the 10-mW/RT was 0.85 (95% CI 0.45–0.96, p = 0.004).
Bland–Altman plots between ankle and wrist measurements were estimated identifying differences between the mean values that invalidated the plots for all tests except running. On the valid-to-perform plots (i.e., ankle versus wrist 10-mW/RT), the higher the acceleration value the further the mean value will appear from the estimated agreement level.
Correlation analysis showed stronger correlation values between the 6MWT distance completed and the ankle-worn accelerometry units (mean ENMO per minute) (). There was no correlation identified in the DM1 group for the wrist-worn devices and all correlation values were higher on the healthy-controls group. Correlation analysis between lower limb muscle strength and accelerometry demonstrated the following: the relationship between strength and acceleration increases in parallel with the increment of walking speed. Walking at a comfortable speed (i.e., 10-mWT) did not show any correlation with accelerometry. Whereas the 10-mW/RT showed a moderate correlation with: knee extensors (r = 0.4, p = 0.05) and hip flexors (r = 0.43, p = 0.02); and, border line significance with ankle dorsiflexors (r = 0.4, p = 0.06).
Table 3. Spearman’s (rho) correlation values estimated between total distance (m) completed during the 6-min walking test (6MWT) and each of the accelerometer units reports (ENMO per minute).
Discussion
This study explored the usability of a tri-axial accelerometer (GENEActiv, Activinsights, Cambridgeshire, United Kingdom) in short walking tests in DM1 participants in comparison with a healthy cohort. ICC estimations showed an excellent level of agreement within each accelerometer for all walking distances validating the accuracy of this technology for an ambulant DM1 population in accordance with findings in other study populations and protocols [Citation35]. However, the accelerometer location impacts significantly when translating raw data into meaningful outputs. An inter-accelerometer reliability was proven when comparing accelerometers of the same limbs between each other (i.e., opposite sides) but not when comparing different limbs (i.e., wrist and ankle). This reliability was reduced with the increment of speed when it is expected that the arms will increase their force to accelerate over the legs (i.e., running test). This is a common case scenario with accelerometers as these devices can exhibit a phenomenon where a speed increment could either emphasize walking disturbances that reflect differences between the limbs or enhance a frequency-dependent filtering effect of accelerometers where the amplitude of the acceleration waves lose priority over frequency [Citation36–38]. These findings strongly confirm that algorithms created for activity outputs validated for the wrist cannot be translated directly onto the ankle. This applies for either healthy or disease populations. When reporting activity outputs derived from accelerometry, researchers have to be aware of the origin of these outputs and when the applicability of the source is questionable it is recommended to better present direct accelerometry units.
GENEActiv (Activinsights, Cambridgeshire, United Kingdom) demonstrated potential when assessing different walking speeds in this disease cohort and showed sensitivity to differentiate the affected from non-affected and a difference in range values between walking speeds. However, no difference was reported in the standing-still position. This device was also sensitive enough to notice variances between disease phenotypes (i.e., classic and mild). The findings in provided evidence that each device recorded higher acceleration with each activity intensity increment and that these values differed from slower walkers (e.g., DM1) to faster walkers. The proximity observed in the 95% confidence interval estimated for the wrist values when walking might suggest the ankle as a better option to distinguish walking periods of a DM1 participant with a comfortable speed, detecting outputs between 33 and 41 ENMO (mg)/min (i.e., acceleration units). Average acceleration per minute detected at the ankle differed significantly from the wrist when walking and this difference disappeared when increasing speed into running. However, this effect is less evident in the DM1 cohort. This can certainly be explained by an impaired running capability, which agrees with the differences observed within the DM1 cohort when the sample was sub-divided into mild and classic phenotypes ().
At present, the 6MWT is the most commonly used outcome measure in NMD in assessing functionality and fitness [Citation39]. The performance on the 6MWT depends on factors such as limb strength, joints mobility, balance and cardiovascular fitness, all of which will influence directly or indirectly on the limb power and range of motion when performing the test [Citation40,Citation41]. In this present study, when 6MWT was correlated to the accelerometry data provided by each different accelerometer, there was an overall higher correlation with the ankle devices and was certainly more significant in the case of the DM1 group as these showed no correlation with what was reported by the wrist-worn devices. The higher values observed on the healthy-controls could indicate that in the case of the DM1 participants there are additional factors influencing on their 6MWT performance besides the speed of their limbs when walking.
When exploring relationships of accelerometry with lower limb strength, there were only moderate correlation scores, which were actually not consistent along all tests. This may reflect the small sample size (n = 30). However, when considering the scores identified as statistically significant and the point that there was a minimal relationship detected at comfortable speed these suggest the relevance of other disease-factors (not muscle strength) that may impact on walking speed (i.e., balance, fatigue or motivation). Due to the importance of walking, investigating other factors interfering with its speed will be highly relevant.
A common and more reliable placement site for accelerometers has been the waist [Citation42,Citation43]. However, distal joints have shown better compliance by participants which is an advantage when considering them for clinical trials [Citation42,Citation44]. From these two placement-options, this is not the first time that ankle has been suggested as the most appropriate site for placing an accelerometer as it has been identified before as the most effective when aiming to classify different speeds in activity, in particular to distinguish low-speed walkers and when recognizing activities such as ambulation and cycling [Citation44–46]. Important to emphasize is that this conclusion might not apply in two relevant cases: (1) for energy expenditure predictions as these are influenced by a range of other factors such as heart rate and oxygen consumption [Citation30,Citation47]; and (2) at detecting non-ambulant activities of daily life living such as gardening, housework or recreational activities [Citation48]. Few studies in other populations have suggested that thigh and ankle-worn devices may have a higher correlation to actual physical activity energy expenditure [Citation47,Citation49,Citation50]. A crucial need in this section is the identification of intensity thresholds for the ankle that can differentiate the movements recorded as inactive (sedentary), low, moderate or vigorous activity-intensities and all these should be estimated for the targeted population specifics. Additionally, research on the use of these devices on other body parts such as hip or tight is still relevant as these locations might reduce the impact of distal weakness and may be more reliable when assessing sedentary periods [Citation51,Citation52].
When considering GENEActiv for a clinical trial, the overall differences between wrist-worn and ankle-worn accelerometer results might not be significant enough to force for one location over the other [Citation48] and the location-selection should be guided by the main research question, protocol particular characteristics and specifics of the targeted sample [Citation53]. Already, the first randomized controlled trial in DM1 selected the use of GENEActiv in the ankle and the ENMO-mg units measure as a secondary outcome measure to assess the impact of their intervention on the physical activity levels of the patients [Citation18]. One limitation of this study is that only one metric methodology was used (i.e., “classical” accelerometer measures used for activity assessment) [Citation29–31]. Implementing other methods of analysis or signal processing may change the perspective. Still, the high-resolution data collected in this study would allow such investigations to be conducted in the future.
Conclusions
When interpreting results from an activity monitor used in a functionally impaired population caution is needed as the majority of these outputs might come from validation studies performed with healthy volunteers. This study provided evidence that disturbances observed in diseased cohorts such as DM1 might impact significantly on results. The body location of the device impacts significantly on the validity of the translation of raw data into activity outputs and the same rules that apply for a healthy person might not apply for one with impairment. In the case of DM1, this study demonstrated that an ankle-worn GENEActiv, more than a wrist-worn device, could provide reliable and sensitive results about an ambulant DM1 patient if the research interest is detecting walking periods, differentiating these from standing still periods and identifying different walking speeds. Moreover, the accelerometry results during these short functional assessments correlated accurately with the severity of the condition and impairment, and strength showed not to be the only factor impacting on walking speed.
Disclosure statement
No potential conflict of interest was reported by the authors.
Additional information
Funding
References
- Westerterp KR. Physical activity assessment with accelerometers. Int J Obes. 1999;23:S45.
- van Hees VT, Sabia S, Anderson KN, et al. A novel, open access method to assess sleep duration using a wrist-worn accelerometer. Plos One. 2015;10:e0142533.
- Strath SJ, Kaminsky LA, Ainsworth BE, et al. Guide to the assessment of physical activity: clinical and research applications. Circulation. 2013;128:2259–2279.
- Jimenez-Moreno AC, Newman J, Charman SJ, et al. Measuring habitual physical activity in neuromuscular disorders: a systematic review. Jnd. 2017;4:25–52.
- Fini NA, Holland AE, Keating J, et al. How is physical activity monitored in people following stroke? Disabil Rehabil. 2015;37:1717–1731.
- Del Din S, DGodfrey A, Mazza C, et al. Free-living monitoring of Parkinson’s disease: lessons from the field. Mov Disord. 2016;31:1293–1313.
- Steins D, Dawes H, Esser P, et al. Wearable accelerometry-based technology capable of assessing functional activities in neurological populations in community settings: a systematic review. J Neuroengineering Rehabil. 2014;11:36.
- Motl RW, Snook EM, Agiovlasitis S. Does an accelerometer accurately measure steps taken under controlled conditions in adults with mild multiple sclerosis? Disability Health J. 2011;4:52–57.
- Thornton CA. Myotonic dystrophy. Neurol Clin. 2014;32:705–719, viii.
- Turner C, Hilton-Jones D. Myotonic dystrophy: diagnosis, management and new therapies. Curr Opin Neurol. 2014;27:599–606.
- Norwood FLM, Harling C, Chinnery PF, et al. Prevalence of genetic muscle disease in Northern England: in-depth analysis of a muscle clinic population. Brain. 2009;132(Pt 11):3175–3186.
- Galli M, Cimolin V, Crugnola V, et al. Gait pattern in myotonic dystrophy (Steinert disease): a kinematic, kinetic and EMG evaluation using 3D gait analysis. J Neurol Sci. 2012;314:83–87.
- Hammaren E, Kjellby-Wendt G, Kowalski J, et al. Factors of importance for dynamic balance impairment and frequency of falls in individuals with myotonic dystrophy type 1 – a cross-sectional study – including reference values of Timed Up & Go, 10m walk and step test. Neuromuscular Disorders: NMD. 2014;24:207–215.
- Kierkegaard M, Harms-Ringdahl K, Widen Holmqvist L, et al. Perceived functioning and disability in adults with myotonic dystrophy type 1: a survey according to the International Classification Of Functioning, Disability and Health. J Rehabil Med. 2009;41:512–520.
- Gagnon C, Mathieu J, Jean S, et al. Predictors of disrupted social participation in myotonic dystrophy type 1. Arch Phys Med Rehabil. 2008;89:1246–1255.
- Gagnon C, Chouinard MC, Laberge L, et al. Health supervision and anticipatory guidance in adult myotonic dystrophy type 1. Neuromuscular Disorders. 2010;20:847–851.
- Schillings M, Kalkman J, Janssen H, et al. Experienced and physiological fatigue in neuromuscular disorders. Clin Neurophysiol. 2007;118:292–300.
- van Engelen B. Cognitive behaviour therapy plus aerobic exercise training to increase activity in patients with myotonic dystrophy type 1 (DM1) compared to usual care (OPTIMISTIC): study protocol for randomised controlled trial. Trials. 2015;16:224.
- Berlin JES, Storti JES, Brach JS Using activity monitors to measure physical activity in free-living conditions. Physical Therapy. 2006;86:1137–1145.
- Trost SG, O'Neil M. Clinical use of objective measures of physical activity. Br J Sports Med. 2014;48:178–181.
- Byrom B, Rowe DA. Measuring free-living physical activity in COPD patients: Deriving methodology standards for clinical trials through a review of research studies. Contemp Clin Trials. 2016;47:172–184.
- Mathieu J, Boivin H, Meunier D, et al. Assessment of a disease-specific muscular impairment rating scale in myotonic dystrophy. Neurology. 2001;56:336–340.
- Jean S, Richer L, Laberge L, et al. Comparisons of intellectual capacities between mild and classic adult-onset phenotypes of myotonic dystrophy type 1 (DM1). Orphanet J Rare Dis. 2014;9:186.
- McDonald CM, Henricson EK, Han JJ, et al. The 6‐minute walk test as a new outcome measure in Duchenne muscular dystrophy. Muscle Nerve. 2010;41:500–510.
- Bohannon RW. Comfortable and maximum walking speed of adults aged 20–79 years: reference values and determinants. Age Ageing. 1997;26:15–19.
- Rowlands AV, Olds TS, Hillsdon M, et al. Assessing sedentary behavior with the GENEActiv: introducing the sedentary sphere. New York: Lippincott Williams & Wilkins; 2014.
- Esliger DW, Rowlands AV, Hurst TL, et al. Validation of the GENEA Accelerometer. Med Sci Sports Exerc. 2011;43:1085–1093.
- RCoreTeam. R: A language and environment for statistical computing. Vienna, Austria: R Foundation for Statistical Computing; 2013.
- van Hees VT, Fang Z, Langford J, et al. Autocalibration of accelerometer data for free-living physical activity assessment using local gravity and temperature: an evaluation on four continents. J Appl Physiol. 2014;117:738–744.
- Hildebrand M, Van Hees VT, Hansen BH, et al. Age group comparability of raw accelerometer output from wrist-and hip-worn monitors. Med Sci Sports Exercise. 2014;46:1816–1824.
- Van Hees VT, Gorzelniak L, Leon ECD, et al. Separating movement and gravity components in an acceleration signal and implications for the assessment of human daily physical activity. PloS One. 2013;8:e61691.
- Kayes NM, Schluter PJ, McPherson KM, et al. Exploring actical accelerometers as an objective measure of physical activity in people with multiple sclerosis. Arch Phys Med Rehabil. 2009;90:594–601.
- Bland JM, Altman D. Statistical methods for assessing agreement between two methods of clinical measurement. Lancet. 1986;327:307–310.
- Bland JM, Altman DG. Measuring agreement in method comparison studies. Stat Methods Med Res. 1999;8:135–160.
- Koo TK, Li MY. A guideline of selecting and reporting intraclass correlation coefficients for reliability research. J Chiropractic Med. 2016;15:155–163.
- John D, Tyo B, Bassett DR. Comparison of four ActiGraph accelerometers during walking and running. Med Sci Sports Exerc. 2010;42:368.
- Park J, Ishikawa-Takata K, Tanaka S, et al. Effects of walking speed and step frequency on estimation of physical activity using accelerometers. J Physiol Anthropol. 2011;30:119–127.
- Rowlands AV, Stone MR, Eston RG. Influence of speed and step frequency during walking and running on motion sensor output. Med Sci Sports Exerc. 2007;39:716–727.
- Finch E, Brooks D, Stratford PW, et al. Physical rehabilitation outcome measures: a guide to enhanced clinical decision making. Physiother Can. 2003;55:053–054.
- Severinsen K, Jakobsen JK, Overgaard K, et al. Normalized muscle strength, aerobic capacity, and walking performance in chronic stroke: a population-based study on the potential for endurance and resistance training. Arch Phys Med Rehabil. 2011;92:1663–1668.
- Middleton A, Braun CH, Lewek MD, et al. Balance impairment limits ability to increase walking speed in individuals with chronic stroke. Disabil Rehabil. 2017;39:497–502.
- Byrom B, Rowe DA. Measuring free-living physical activity in COPD patients: deriving methodology standards for clinical trials through a review of research studies. Contemporary Clin Trials. 2016;47:172–184.
- Kuo TBJ, Li JY, Chen CY, et al. Influence of accelerometer placement and/or heart rate on energy expenditure prediction during uphill exercise. J Motor Behav. 2018;50:127–133.
- Mannini A, Intille SS, Rosenberger M, et al. Activity recognition using a single accelerometer placed at the wrist or ankle. Med Sci Sports Exerc. 2013;45:2193–2203.
- Kim DY, Jung YS, Park RW, et al. Different location of triaxial accelerometer and different energy expenditures. Yonsei Med J. 2014;55:1145–1151.
- Mannini A, Rosenberger M, Haskell WL, et al. Activity recognition in youth using single accelerometer placed at wrist or ankle. Med Sci Sports Exerc. 2017;49:801–812.
- Montoye AH, Mudd LM, Biswas S, et al. Energy expenditure prediction using raw accelerometer data in simulated free living. Med Sci Sports Exerc. 2015;47:1735–1746.
- Ozemek C, Kirschner MM, Wilkerson BS, et al. Intermonitor reliability of the GT3X + accelerometer at hip, wrist and ankle sites during activities of daily living. Physiol Meas. 2014;35:129–138.
- Afaq S, Tan S-T, Afzal U, et al. 117 Validation of accelerometers for measurement of physical activity energy expenditure in South Asians and Europeans. Heart. 2014;100:A66.2. A7.
- Thaler-Kall K, Tusker F, Hermsdörfer J, Gorzelniak L, Horsch A. Where to wear accelerometers to measure physical activity in people? Studies in health technology and informatics. Studies Health Technol Informatics. 2012;192:1045.
- Cleland I, Kikhia B, Nugent C, et al. Optimal placement of accelerometers for the detection of everyday activities. Sensors (Basel). 2013;13:9183–9200.
- Felez-Nobrega M, Hillman CH, Dowd KP, et al. ActivPAL™ determined sedentary behaviour, physical activity and academic achievement in college students. J Sports Sci. 2018;1–6. DOI:10.1080/02640414.2018.1451212
- Matthews CE, Hagströmer M, Pober DM, et al. Best practices for using physical activity monitors in population-based research. Med Sci Sports Exercise. 2012;44:S68.