
Abstract
Purpose: Sedentary behavior is common in people with stroke and has devastating impact on their health. Quantifying it is important to provide people with stroke with adequate physical behavior recommendations. Sedentary behavior can be quantified in terms of posture (sitting) or intensity (low energy expenditure). We compared the effect of different operationalizations of sedentary behavior on sedentary behavior outcomes (total time; way of accumulation) in people with stroke.
Methods: Sedentary behavior was analyzed in 44 people with chronic stroke with an activity monitor that measured both body postures and movement intensity. It was operationalized as: (1) combining postural and intensity data; (2) using only postural data; (3) using only intensity data. For each operationalization, we quantified a set of outcomes. Repeated measures ANOVA and Bland–Altman plots were used to compare the operationalizations.
Results: All sedentary behavior outcomes differed significantly between all operationalizations (p < 0.01). Bland–Altman plots showed large limits of agreement for all outcomes, showing large individual differences between operationalizations.
Conclusions: Although it was neither possible nor our aim to investigate the validity of the two-component definition of sedentary behavior, our study shows that the type of operationalization of sedentary behavior significantly influences sedentary behavior outcomes in people with stroke.
Reliable assessment of sedentary behavior after stroke is important in order to provide adequate physical behavior recommendations for people with stroke.
Sedentary behavior can be operationalized in terms of body posture (sitting time) or in terms of movement intensity (time <1.5 MET) or as a combination of both criteria; this study reveals that the type of operationalization affects the different outcome measures used to quantify sedentary behavior.
Comparing sedentary behavior outcomes requires caution and should only be done when sedentary behavior is operationalized in the same way.
Implications for Rehabilitation
Introduction
Regular physical activity contributes to primary and secondary prevention of several chronic diseases and is associated with a reduced risk of premature death [Citation1]. Moreover, there is increasing evidence for an association between sedentary behavior (SB) and disease, health markers and mortality, independent of the level of physical activity [Citation2–5]. SB is not the same as the lack of physical activity [Citation6,Citation7]; for example, during 1 day, individuals can be both highly active and have a large amount of SB [Citation4,Citation5]. The Sedentary Behavior Research Network has defined SB as “any waking behavior characterized by a low energy expenditure (≤1.5 METs) while in a sitting or reclining posture” [Citation7]. Thus SB comprises two components: a postural one and an intensity component. Moreover, not only the amount of SB is important, but also the way in which SB time is accumulated [Citation8,Citation9]. For example, breaking up long periods of sedentary time may provide beneficial metabolic effects in addition to the beneficial effects of reducing total sedentary time [Citation8,Citation9]. Therefore, SB is expressed by several outcomes, such as total time, number of bouts, and mean bout length.
Despite the availability of a clear definition of SB [Citation7], few studies have measured SB according to the full definition, i.e. comprising both the postural and intensity component. Some groups used an activity monitor which estimates energy expenditure [Citation8–10] whereas others used activity monitors which measure body postures and movements (hereafter called postures/movements) [Citation11,Citation12]. Using only postural data, or only intensity data, as the operationalization of SB is likely to influence the values of SB outcomes. However, the effect of using these different operationalizations of SB is unknown.
In order to understand how different operationalizations of SB affect SB outcomes, we previously assessed this effect in healthy people [Citation13]. We found significant and substantial differences in SB outcomes between different operationalizations. Specifically, the amount of sedentary time differed 10–20% between different operationalizations, while the difference in the accumulation of sedentary time was even larger; i.e., fragmentation of sedentary time varied up to 50% [Citation13]. We suggested that these differences could result from specific physical behavior patterns, such as standing still with low energy expenditure and sitting while moving with high energy expenditure [Citation13]. Because the frequency and duration of such behaviors most likely differ between people with stroke and healthy people [Citation14–17], the results of our previous study in healthy people may not be generalizable to people with stroke.
Measuring SB in people with stroke is relevant because of their high level of SB [Citation14–17] and the fact the SB is a risk factor for cardiovascular diseases in persons who are already at risk [Citation18]. Quantifying SB is important to provide people with stroke with adequate physical behavior recommendations. Previous studies on people with stroke did not measure SB according to the full two-component definition, the study was either based on estimates of energy expenditure [Citation14,Citation15] or on postures/movements [Citation16,Citation17]. Therefore, the present study aimed to quantify differences between three different operationalizations of SB in a set of SB outcomes in people with chronic stroke.
Methods
Participants
The data of this study was collected as part of a larger study. The purpose of that larger study was to predict fall risk in daily life based on balance capacity in a group of 81 people with chronic stroke [Citation19]. In that larger study, the level of physical activity was determined as covariate and was measured with pedometers, and in a subset of 58 participants, with a sophisticated activity monitor. Inclusion criteria were (i) > 6 months after a unilateral supratentorial stroke, and (ii) able to stand/walk independently (Functional Ambulation Categories ≥3). Excluded were people with (i) other neurological or musculoskeletal disorders affecting balance, (ii) a reduced cognitive functioning (Mini Mental State Examination score <24), and (iii) medication that affects reaction time. All participants provided written informed consent. The study protocol was approved by the Medical Ethics Committee of the region Arnhem-Nijmegen.
Data collection
SB was objectively measured using the accelerometer-based VitaMove activity monitor (2 M Engineering, Veldhoven, The Netherlands). The VitaMove is the wireless successor of the Vitaport and both have widely been used to measure postures/movements. For detection of postures/movements, validation studies with the Vitaport were performed with video recordings as reference data, and those studies showed good results (agreement Vitaport – video around 90%) with only small differences between different patient groups (agreement ranging 87–90%) [Citation20–22]. Thus, our measurement system has proven to be valid for postures/movements detection in a variety of populations with deviating movement patterns. In addition, the Vitaport/VitaMove system has been previously applied in people with stroke [Citation23–27]. In addition to the valid postures/movements detection, the Vitaport/VitaMove provides reliable estimates of movement intensity and energy expenditure, comparable to those of heart rate. The way in which movement intensity is calculated is basically the same as the vector magnitude calculations in other accelerometer devices. A conceptual difference is that the Vitaport/VitaMove movement intensity (called body motility) is based on the input of 3–4 sensor units, whereas other accelerometer devices usually use only 1 sensor. Bussmann et al. [Citation28] compared body motility of the Vitaport with oxygen uptake and heart rate during increasing walking speed in healthy people. Pearson correlation coefficient, based on individual linear regression equations, for the body motility—oxygen uptake relation was on average 0.97, which was the same for the heart rate–oxygen uptake relation. The inter-individual range was somewhat smaller for the body motility–oxygen uptake relation (0.95–0.98) than for the heart rate–oxygen uptake relation (0.93–0.99). Next, this body motility was used as measure for walking speed in several studies [Citation29,Citation30]. Finally, the body motility values showed to have a strong relationship (r = 0.91) with movement counts measured with the Actigraph device [Citation13]. We used this strong relation to set a threshold below which the intensity is defined as SB (see Data Processing). The VitaMove consists of three body-fixed accelerometers (Freescale MMA7260Q, Denver, USA), one attached to the sternum and one to each thigh. The three sensors are wirelessly connected and synchronize every 10 s; full details on this device are published elsewhere [Citation31,Citation32].
The system was worn during waking hours; participants fixed the sensors (using elastic belts) after getting out of bed and removed them before going to bed. Because the sensors are not waterproof, they were not worn during swimming, bathing, or showering. The monitoring period lasted for 7 consecutive days. The first day was not included in the analysis, because this was not a full and representative day: the measurement was initialized, the device was attached and the measurement instructions were given. Data was included in the analysis when the device was worn correctly for at least 3 days with a minimum of 8 h of wearing time/day. To avoid measurement bias, participants were instructed to follow their ordinary daily life; the principles of the activity monitor and the research questions were explained after the monitoring period.
Data processing
The measured accelerations were analyzed using VitaScore Software (VitaScore BV, Gemert, The Netherlands). For the postural data, the same software was used to automatically detect a specific postures/movements (lying, sitting, standing, walking, cycling, and general noncyclic movements) each second. Full details on all steps of this detection procedure are described elsewhere [Citation31]. Briefly, the posture/movement detection is based on three feature signals that are derived from each measured acceleration signal. These feature signals are (1) an angular feature (expressing the orientation of the sensor relative to the gravity), (2) a motility feature (expressing movement intensity, based on the variability of the acceleration signal around the mean), and (3) a frequency feature (expressing the main frequency of the signal in case of repetitive movements). Based on thses feature signals, posture/movement specific settings, and minimal distance-based algorithms, each second a specific posture/movement is automatically detected.
One of the features used in those steps is the motility or movement intensity of each sensor, which is quantified based on the variability around the mean of the raw acceleration signal. The average of the motility of all sensors, the body motility (expressed in g: 1 g = 9.81 m/s2), was used as intensity data. Comparable to other devices providing energy expenditure output (usually in movement counts), there is a threshold below which the intensity is defined as SB. In this study, a threshold of 0.045 g was used. This threshold was determined based on additional measurements in 8 healthy people (mean age 31 years; 2 men); during these measurements the participants wore the VitaMove and Actigraph (GT3X, Actigraph, Pensacola, FL), and performed a short protocol including sitting, standing and walking, all items with different intensities. The body motility of the VitaMove and the counts of the Actigraph were strongly correlated (R = 0.91, p < 0.001), and a VitaMove body motility of 0.045 g corresponded to 150 counts of the Actigraph, which is a valid threshold for SB [Citation33]. After dichotomizing the body motility output, a 5-s duration threshold was applied, comparable to the post-processing of the postural data in VitaScore [Citation31].
Sedentary behavior: operationalization and outcomes
SB was operationalized in three ways:
Combining postural and intensity data as the definition of SB: waking time in which i) the posture was lying or sitting, and ii) the movement intensity was low (body motility <0.045 g, comparable to Actigraph <150 counts).
Using only postural data: waking time in which the posture was lying or sitting.
Using only intensity data: waking time in which the movement intensity was low (body motility <0.045 g, comparable to Actigraph <150 counts).
For all these operationalizations SB was quantified by five SB outcomes:
Total time: the absolute sum of all sedentary time (in min).
Number of bouts: the number of uninterrupted periods of SB.
Mean bout length: the back transformed mean of the natural log data (in min). This transformation was done because the length of the sedentary bouts was not normally distributed.
Fragmentation: the number of sedentary bouts divided by the total sedentary time. The higher the fragmentation, the more fragmented the sedentary time.
W-index: the fraction of the total sedentary time that was accumulated in sedentary bouts longer than the median sedentary bout length. The higher the W-index, the more time is accumulated in relatively long sedentary bouts.
These outcomes were calculated by an in-house Matlab program for each measurement day, and then averaged for all days of a measurement to represent the average SB per day.
Statistical analyses
To quantify and test differences between the three operationalizations of SB, repeated measures ANOVA and Bland–Altman plots were used. For the repeated measures ANOVA, the different operationalizations were used as the within-subject variable. To test sphericity, Mauchly’s test was used and the Greenhouse–Geisser estimate was used when the sphericity assumption was violated. Significance level was set at p < 0.05 and Bonferroni’s post hoc correction was used to correct for multiple pairwise comparisons. The mean difference and corresponding 95% limits of agreement were calculated and plotted for each of the three pairs of operationalizations for all five outcomes. All analyses were performed with SPSS software version 21 and Microsoft Excel version 2010.
Results
Data of 14 of the 58 participants were excluded from analysis due to system failures (e.g., low power, n = 7), bad quality of data (e.g. leg sensors switched during measurement period, n = 6), or too little valid data (<3 days with at least 8 h, n = 1). Remaining data of 44 participants were included in the analysis with a mean of 5.6 days of 14 h of measurement per participant ().
Table 1. Characteristics of the participants included in the analysis (n = 44).
All SB outcomes showed a significant difference between the three operationalizations of SB (all p < 0.001; part A). The three paired t-tests of the post-hoc comparison showed that all pairs were significantly different for all SB outcomes (p < 0.001; p < 0.01 for the posture-intensity difference for the W-index; part B). The total time and the W-index had the highest values in the postural operationalization and the lowest in the combined operationalization, whereas the number of bouts and fragmentation had the highest values in the intensity operationalization and the lowest in the postural operationalization. The mean bout length had the opposite pattern, with the lowest values for the intensity operationalization and the highest for the postural operationalization.
Table 2. (A) Mean values of the three operationalizations for all sedentary behavior outcomes and results of repeated measures ANOVA. (B) Mean difference between the pairs of operationalizations.
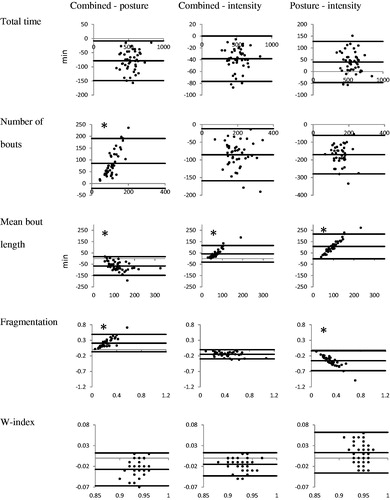
In the Bland–Altman plots (), the mean difference between the pairs of operationalizations and the limits of agreement are visualized for all SB outcomes. The mean difference in all pairs of all SB outcomes indicated a systematic difference between the operationalizations. The limits of agreement showed that there was an inter-subject variability in the difference between operationalizations. The range between the limits of agreement was larger for the outcomes describing the accumulation pattern (except for the W-index) than for the amount (total time). can also be seen that the difference between the combined operationalization and postural component alone is proportional to the magnitude of the measure for the number of bouts, the mean bout length, and the fragmentation. This also applies to the mean bout length of the other two comparisons and for the fragmentation of the posture–intensity pair.
Figure 1. Bland–Altman plots (x-axis: mean of both operationalizations; y-axis: difference between both operationalizations) per pair of operationalization for all sedentary behavior outcomes.
Discussion
This study compared the effect of three operationalizations of SB in a set of SB outcomes measured in people with chronic stroke. All three operationalizations yielded significantly different results for all SB outcomes. The differences between the operationalizations were systematic and showed large variability between participants.
Our results indicated systematic differences in SB outcomes between the different operationalizations of SB. Specifically, the combined operationalization yielded the lowest duration of sedentary time compared to the postural and intensity operationalizations. This difference can be logically explained by the conceptual differences between the operationalizations. Both the postural and intensity operationalization have only one requirement: either time has to be in a sitting or reclined position, or below a certain intensity level. However, in the combined operationalization both requirements must be met, which logically results in less time indicated as SB. When we compared the sedentary time in the postural operationalization to the time in the intensity operationalization we found the highest duration in the postural operationalization. This difference cannot be immediately explained from a conceptual perspective, because there are two effects that counteract each other: in the postural operationalization, some of the time will be classified as SB while this time does not meet the requirement of a low intensity, for example in the case of so-called “active sitting”. On the other hand, in the intensity operationalization, ‘standing still’ might be included as SB, whereas this does not meet the postural requirement.
The type of operationalization did not only affect the duration of SB, but also the other outcomes. For example, in the postural operationalization time classified as SB was, as already discussed, higher, but also accumulated in less bouts which were on average longer compared to the combined operationalization. The opposite happened in the intensity operationalization, with shorter time classified as SB, but accumulated in more and shorter bouts compared to the combined operationalization. The time of SB only detected by one of both requirements can be within two SB bouts connecting them to one larger bout, or can be a separate bout. These differences in SB outcomes between the operationalizations were not only significant (, Part B), but also sufficiently large to be considered clinically relevant. Especially outcomes related to the accumulation of SB (e.g., the number of bouts, mean bout length, and fragmentation) exhibited large differences between almost all pairs of operationalizations; these differences were larger than 50% of the mean value of the compared operationalizations.
Besides large mean differences, the limits of agreement were also large (, Part B. and ). These large limits of agreement indicate a high variability in the individual differences between operationalizations. In some participants SB outcomes differ very little between two operationalizations, whereas others show a considerable difference between two operationalizations. However, the limits of agreement were overestimated for some comparisons (: indicated by *) because the difference between the two operationalizations was dependent on the mean value; i.e. when being more sedentary the two operationalizations differ more from each other. In those comparisons, the individual variability was much lower when taking dependency into account. This result was not expected and it is unclear why this occurs in only some of the SB outcomes for some pairs of operationalization. However, our main results still showed a systematic difference between the three operationalizations, with individual variability in the differences between operationalizations.
The present study is a continuation of our earlier study investigating the effect of operationalization in healthy people; the previous study revealed a strong and significant effect of the operationalization of SB in a set of SB outcomes [Citation13]. The rationale for this additional study in people with stroke is that the previous results cannot be automatically generalized to people with stroke. In addition, we assumed that a different physical behavior might also influence the effect of the operationalization of SB, and based on literature, we also assumed that people with stroke have a different physical behavior than healthy people [Citation14–17]. In both our studies, the same SB outcomes were calculated and the same operationalizations of SB were used.
Analysis revealed that values on the SB outcomes per operationalization differed only slightly between healthy people in our earlier study and people with stroke in the present study (see for comparative data). However, because the healthy group differed in demographic characteristics from the stroke group, we cannot conclude that the physical behavior of healthy people and people with stroke is the same, despite the minor differences in these values. Therefore, this study provides relevant findings, i.e. that also in people with stroke there is a strong effect of operationalization of SB on a set of SB outcomes.
Table 3. Effect of operationalization in people with stroke (present study) compared with results from our previous study in healthy people.
The effect of operationalization is important when using SB outcomes in research or clinical practice. Operationalization of SB is mainly determined by the measurement device used. For example, Actigraph (an accelerometer commonly used to assess SB) has movement counts as primary output, which is comparable to the intensity operationalization [Citation8–10,Citation14], whereas activPAL (also increasingly used to assess SB) primarily measures postures/movements comparable to the postural operationalization [Citation11,Citation12,Citation16,Citation17]. When comparing the results of SB when SB has been operationalized in different ways (i.e. mainly when two different devices are used), it remains unclear whether there is a real difference in SB, or whether the difference is caused by the different operationalization of SB. Therefore, we recommend that SB data and results only be compared when both outcomes are measured with the same operationalization of SB. This applies to various types of comparisons, e.g., comparing one’s own results with literature, comparing different groups, and comparing longitudinal results within the same study.
Based on this study, it was neither possible nor our aim to investigate the validity of the two-component definition of SB. However, as mentioned in our previous paper, elucidating the working mechanism of SB and the most reliable and valid way to operationalize SB is the next major challenge in research [Citation13]. Until then, we recommend to simultaneously measure postures/movements and intensity in SB research to follow the consensus definition of SB proposed by The Sedentary Behavior Research Network [Citation7]. When both components are measured simultaneously, it is also possible to elucidate the contribution of both components separately to SB and its health effects. It is possible to measure simultaneously postural and intensity data with devices such as the Actigraph and activPAL, albeit they are not often used in that way. Some information is available on measuring postural data with the Actigraph and estimating energy expenditure with activPAL [Citation34–37]; however, studies using these functionalities [Citation38,Citation39] had other aims and did not combine postural data and intensity data to estimate SB. Hopefully, those devices will be improved to enable simultaneously measuring postures/movements and intensity to estimate SB according to its definition.
A limitation of this study is that the intensity (or energy expenditure) was measured indirectly by movement counts. Although the threshold for SB was determined previously, this was not verified with simultaneous direct measurement of energy expenditure [Citation13]. Furthermore, this threshold was not adjusted for people with stroke relative to healthy people. Performing PA is more strenuous for people with chronic conditions than for healthy people, indicating the need to adjust thresholds for intensity levels [Citation6]. However, adjusting the threshold for the SB level seems less urgent than for PA, due to the generally very low burdening during sedentary activities.
Conclusions
Although it was neither possible nor our aim to investigate the validity of the two-component definition of SB, the present study shows that the type of operationalization of SB has a significant impact on SB outcomes in people with chronic stroke. Therefore, comparing SB outcomes from different studies requires caution and should only be done when SB is operationalized in the same way.
Disclosure statement
No potential conflict of interest was reported by the authors.
Additional information
Funding
Related Research Data
References
- Warburton DE, Nicol CW, Bredin SS. Health benefits of physical activity: the evidence. CMAJ. 2006;174:801–809.
- Biswas A, Oh PI, Faulkner GE, et al. Sedentary time and its association with risk for disease incidence, mortality, and hospitalization in adults: a systematic review and meta-analysis. Ann Intern Med. 2015;162:123–132.
- Wilmot EG, Edwardson CL, Achana FA, et al. Sedentary time in adults and the association with diabetes, cardiovascular disease and death: systematic review and meta-analysis. Diabetologia. 2012;55:2895–2905.
- Tremblay MS, Colley RC, Saunders TJ, et al. Physiological and health implications of a sedentary lifestyle. Appl Physiol Nutr Metab. 2010;35:725–740.
- Owen N, Healy GN, Matthews CE, et al. Too much sitting: the population health. Sci Sedentary Behav. Exerc Sport Sci Rev. 2010;38:105–113.
- Bussmann JB, van den Berg-Emons RJ. To total amount of activity…. and beyond: perspectives on measuring physical behavior. Front Psychol. 2013;4:463.
- Tremblay MS, Aubert S, Barnes JD, et al. Sedentary Behavior Research Network (SBRN) – Terminology Consensus Project process and outcome. Int J Behav Nutr Phys Act. 2017;14:75.
- Carson V, Wong SL, Winkler E, et al. Patterns of sedentary time and cardiometabolic risk among Canadian adults. Prev Med. 2014;65:23–27.
- Healy GN, Dunstan DW, Salmon J, et al. Breaks in sedentary time: beneficial associations with metabolic risk. Diabetes Care. 2008;31:661–666.
- Shuval K, Li Q, Gabriel KP, et al. Income, physical activity, sedentary behavior, and the 'weekend warrior' among U.S. adults. Prev Med. 2017;103:91–97.
- de Rooij BH, van der Berg JD, van der Kallen CJ, et al. physical activity and sedentary behavior in metabolically healthy versus unhealthy obese and non-obese individuals – The Maastricht Study. PLoS One. 2016;11:e0154358.
- Tigbe WW, Granat MH, Sattar N, et al. Time spent in sedentary posture is associated with waist circumference and cardiovascular risk. Int J Obes (Lond). 2017;41:689–696.
- Fanchamps MHJ, van den Berg-Emons HJG, Stam HJ, et al. Sedentary behavior: Different types of operationalization influence outcome measures. Gait Posture. 2017;54:188–193.
- Butler EN, Evenson KR. Prevalence of physical activity and sedentary behavior among stroke survivors in the United States. Top Stroke Rehabil. 2014;21:246–255.
- Moore SA, Hallsworth K, Plotz T, et al. Physical activity, sedentary behaviour and metabolic control following stroke: a cross-sectional and longitudinal study. PLoS One. 2013;8:e55263.
- Paul L, Brewster S, Wyke S, et al. Physical activity profiles and sedentary behaviour in people following stroke: a cross-sectional study. Disabil Rehabil. 2016;38:362–367.
- Tieges Z, Mead G, Allerhand M, et al. Sedentary behavior in the first year after stroke: a longitudinal cohort study with objective measures. Arch Phys Med Rehabil. 2015;96:15–23.
- Batty GD, Lee IM. Physical activity for preventing strokes. BMJ. 2002;325:350–351.
- de Kam D. Postural instability in people with chronic stroke and Parkinson's disease: dynamic perspectives [dissertation]. Nijmegen (NL): Radboud University Nijmegen; 2017.
- Bussmann HB, Reuvekamp PJ, Veltink PH, et al. Validity and reliability of measurements obtained with an "activity monitor" in people with and without a transtibial amputation. Phys Ther. 1998;78:989–998.
- Bussmann JB, van de Laar YM, Neeleman MP, et al. Ambulatory accelerometry to quantify motor behaviour in patients after failed back surgery: a validation study. Pain. 1998;74:153–161.
- van den Berg-Emons HJ, Bussmann JB, Balk AH, et al. Validity of ambulatory accelerometry to quantify physical activity in heart failure. Scand J Rehabil Med. 2000;32:187–192.
- de Niet M, Bussmann JB, Ribbers GM, et al. The stroke upper-limb activity monitor: its sensitivity to measure hemiplegic upper-limb activity during daily life. Arch Phys Med Rehabil. 2007;88:1121–1126.
- Janssen W, Bussmann J, Selles R, et al. Recovery of the sit-to-stand movement after stroke: a longitudinal cohort study. Neurorehabil Neural Repair. 2010;24:763–769.
- Michielsen ME, de Niet M, Ribbers GM, et al. Evidence of a logarithmic relationship between motor capacity and actual performance in daily life of the paretic arm following stroke. J Rehabil Med. 2009;41:327–331.
- Michielsen ME, Selles RW, Stam HJ, et al. Quantifying nonuse in chronic stroke patients: a study into paretic, nonparetic, and bimanual upper-limb use in daily life. Arch Phys Med Rehabil. 2012;93:1975–1981.
- Sánchez M, Bussmann J, Janssen W, et al. Accelerometric assessment of different dimensions of natural walking during the first year after stroke: recovery of amount, distribution, quality and speed of walking. J Rehabil Med. 2015;47:714–721.
- Bussmann JB, Hartgerink I, van der Woude LH, et al. Measuring physical strain during ambulation with accelerometry. Med Sci Sports Exerc. 2000;32:1462–1471.
- Bussmann JB, Grootscholten EA, Stam HJ. Daily physical activity and heart rate response in people with a unilateral transtibial amputation for vascular disease. Arch Phys Med Rehabil. 2004;85:240–244.
- Bussmann JB, Schrauwen HJ, Stam HJ. Daily physical activity and heart rate response in people with a unilateral traumatic transtibial amputation. Arch Phys Med Rehabil. 2008;89:430–434.
- Bussmann JB, Martens WL, Tulen JH, et al. Measuring daily behavior using ambulatory accelerometry: the Activity Monitor. Behav Res Methods Instrum Comput. 2001;33:349–356.
- Harmsen WJ, Ribbers GM, Heijenbrok-Kal MH, et al. Inactive lifestyles and sedentary behavior in persons with chronic aneurysmal subarachnoid hemorrhage: evidence from accelerometer-based activity monitoring. J NeuroEng Rehabil. 2017;14:120.
- Kozey-Keadle S, Libertine A, Lyden K, et al. Validation of wearable monitors for assessing sedentary behavior. Med Sci Sports Exerc. 2011;43:1561–1567.
- Edwardson CL, Rowlands AV, Bunnewell S, et al. Accuracy of posture allocation algorithms for thigh- and waist-worn accelerometers. Med Sci Sports Exerc. 2016;48:1085–1090.
- Kim Y, Welk GJ. criterion validity of competing accelerometry-based activity monitoring devices. Med Sci Sports Exerc. 2015;47:2456–2463.
- Lyden K, Keadle SK, Staudenmayer J, et al. The activPALTM accurately classifies activity intensity categories in healthy adults. Med Sci Sports Exerc. 2017;49:1022–1028.
- Stemland I, Ingebrigtsen J, Christiansen CS, et al. Validity of the Acti4 method for detection of physical activity types in free-living settings: comparison with video analysis. Ergonomics. 2015;58:953–965.
- Brewer W, Ogbazi R, Ohl D, et al. A comparison of work-related physical activity levels between inpatient and outpatient physical therapists: an observational cohort trial. BMC Res Notes. 2016;9:313.
- Gupta N, Heiden M, Aadahl M, et al. what is the effect on obesity indicators from replacing prolonged sedentary time with brief sedentary bouts, standing and different types of physical activity during working days? A cross-sectional accelerometer-based study among blue-collar workers. PLoS One. 2016;11:e0154935.