
Abstract
Background: The aim of this study is to assess the viability of a decision tree version of an often used questionnaire to measure wrist pain and disability, the Patient Rated Wrist Evaluation.
Methods: Patient Rated Wrist Evaluation scores were collected from a cohort of 10394 patients who are part of a routine outcome measurement system. A decision tree version of the Patient Rated Wrist Evaluation (PRWE) was created. The intraclass correlation was used to evaluate the inter-version reliability between the original PRWE and the decision tree version.
Results: The decision tree reduced the number of questions from 5 to 3 for the pain subscale, and from 10 to 3 for the disability subscale. The intraclass correlation between the original PRWE and the decision tree version was 0.97. The mean difference between the Patient Rated Wrist Evaluation and the decision tree Patient Rated Wrist Evaluation total sumscore was 0.35 (95% CI −9.92–10.62).
Conclusions: We found that the decision tree was successful at reducing the items of the Patient Rated Wrist Evaluation from fifteen to only six questions with very high similarity to the scores of the full questionnaire.
The Patient Rated Wrist Evaluation can reliably be used with 6 instead of 15 questions.
Decision trees are useful statistical tools to shorten lengthy questionnaires, especially when large amounts of data are available.
Having a shortened Patient Rated Wrist Evaluation saves patients and clinicians time in answering this specific questionnaire.
Implications for rehabilitation
Background
Monitoring and recording patients’ pain, disability and quality of life is increasingly important in medicine. Patient reported outcome measures (PROMs) are widely used to accomplish this and are frequently used as primary outcomes of clinical trials [Citation1,Citation2]. PROMs are also incorporated in patient monitoring systems to evaluate the quality of care [Citation3], to provide personalized medicine [Citation4,Citation5] and as part of value based healthcare analysis [Citation3,Citation6].
A frequently-used PROM in hand surgery, hand therapy and rehabilitation medicine is the Patient Rated Wrist Evaluation (PRWE) [Citation7]. The PRWE was developed to create a valid and reliable tool to quantify pain and disability of the wrist [Citation8] in disorders such as distal radius, scaphoid fractures, arthritis or other musculoskeletal disorders affecting the wrist and hand. The PRWE has a score between 0 to 100 with two subscale scores; pain and disability. A low score on the PRWE represents little pain or disability while a high PRWE score represents a high level of pain and disability. The PRWE correlates significantly with measures such as grip strength, range of motion and the SF-36 quality of life questionnaire [Citation7]. Good to excellent test-retest reliability was reported for both the original questionnaires as well as for multiple-language versions, including the Dutch language version [Citation9]. The PRWE has been recommended as a core outcome measure for assessment of distal radius fractures [Citation10,Citation11].
Since it has been reported that a longer questionnaire will have a lower response rate [Citation12–14] there has been a focus on defining shorter versions accepted measures [Citation15–18]. Shorter measures can improve efficiency of assessment or allow time for additional constructs to be assessed. Especially in busy clinical settings a shorter questionnaire may provide smoother delivery of care. For the PRWE, however, no attempts to reduce the length of the questionnaire have been reported. In other questionnaires for example, during development of the QuickDASH [Citation17] three different methods were used; expert opinion, a correlation analysis and a Rasch model, with expert opinion ultimately selected as the most parsimonious solution to reduce the DASH from 30 items to 11. Another method is applied in PROMIS, an international collaboration to develop a generalized item bank for PROMs, which uses computerized adaptive testing based on item response theory [Citation19]. An alternative promising method to reduce item length of questionnaires is by generating decision trees using Chi-squared Automated Interaction Detection (CHAID).
CHAID is a non-parametric data mining technique used to automatically detect interactions between categorized variables in large data sets [Citation20]. It is often used as an analytical method for market segmentation, but has recently also been successfully applied for item reduction of the personality and life events questionnaire [Citation21]. A potential advantage of CHAID over other item reduction methods is its efficiency in data reduction. For the personality and life events questionnaire CHAID-based modeling resulted in a reduction of questions from 26 to 4, instead of a reduction to 9 questions as achieved with computer adaptive testing based on item response theory [Citation21].
So far, CHAID has rarely been used as an item reduction technique for PROMs. In the present exploratory study, we aim to determine if we can develop a decision tree-based version of an often used PROM in hand surgery (PRWE) with a significant reduction in questions without compromising the psychometric performance.
Methods
Patient selection
In this retrospective cohort study we used data from all patients treated between November 2011 and May 2016 in Xpert Clinics, a network of private practices for hand surgery and hand therapy, that were treated conservatively or surgically for a wrist-related problem (see for a specification of the most common disorders). Data used in the present study were collected as part of routine outcome measurement of all patients in all 11 participating clinics. All patients gave consent for anonymized analysis of their data and institutional review board of the Erasmus MC approved the study.
Table 1. Patient characteristics.
Measurement
Patients were asked to fill in a web-based version of the Dutch patient reported wrist/hand evaluation [Citation9]. This questionnaire consists of 17 questions, divided into a pain subscore of five items, a disability subscore of ten items and esthetics subscore using two questions. The esthetics subscore is not scored, pain and disability scores can vary between 0 and 50 and can be combined into a total sumscore [Citation22]. From these patients, all PRWHEs completed on intake, six weeks, three months, six months or twelve months were analyzed. Only the PRWE part of the questionnaire was used for analysis excluding the questions concerning cosmetics of the hand, that only appear on the PRWHE version.
Decision tree development
The decision tree was generated using the Chi-squared Automated Interaction Detection (CHAID) [Citation20] algorithm. This algorithm classifies data based on the interaction between dependent factors and an independent factor. In this study the dependent factor was the sumscore of the pain or disability subscale of the PRWE. The independent factors were the individual questions. The algorithm works in several steps: First, the algorithm will identify the question which answers will provide the best discrimination of the sumscore. Secondly, it will try to split all questionnaires based on the answers of the identified question into subgroups. Splits where only preformed when splits were significant, with a p values <0.05. Thirdly, within those subgroups the algorithm will identify the most discriminative question and split the subgroup again based on the answers of the most discriminative question in the subgroup, until stop conditions are met. Finally, when stop conditions are met, an end group (=terminal node) is created. For each terminal node a score will be predicted. The end result of the algorithm is a decision tree which classifies questionnaires based on their answers to specific questions and predicts the sumscore for each terminal node.
Optimization of split and stop parameters of the CHAID algorithm was performed to find the optimal decision trees for both the pain and disability sub scores separately. Parameters used for optimization were the minimal split, minimal bucket and the maximal depth [Citation20]. Minimal split was defined as the minimal number of PRWE questionnaire needed for the algorithm to perform a split, minimal bucket was defined as the minimal amount of questionnaires in a subgroup after splitting and maximal depth was defined as the maximal amount of splits allowed to perform on each questionnaire.
The completed PRWE questionnaires were randomly split into a development and a validation group in a three-to-one ratio. The development group was used to optimize, develop and select a decision tree. The validation group was used to assess the agreement of the selected decision tree with the original PRWE in an independent dataset.
To select an optimal decision tree we calculated the difference between the original PRWE sub score and the predicted subscore for all questionnaires, for each decision tree developed with an unique set of parameters. The mean and standard deviation of these differences were calculated for each decision tree. We manually selected the optimal decision tree-based on a combination of a low standard deviation and a low depth (i.e., a small number of questions). The resulting final Decision Tree PRWE (DT-PRWE) was used for further comparisons with the original PRWE.
Reliability and agreement
To compare the DT-PRWE with the original PRWE in the independent validation group, we performed three analyses. The intraclass correlation between the original PRWE and the DT-PRWE was calculated to assess the inter-version reliability. In addition, Bland-Altman plots were made to analyze the agreement between the original PRWE and DT-PRWE scores. The mean difference and the range of agreement between the PRWE and the DT-PRWE was also calculated. Finally, we calculated spearman correlations between the original and DT-PRWHE score. All analyses were performed using R with the interface R studio, more specifically, the CHAID package [Citation23].
Results
Patient selection
In total 10394 patient reported wrist evaluations (PRWE) were completed between November 2011 and May 2016, which were randomly split into a development group containing 7795 questionnaires and a validation group containing 2599 questionnaires. Characteristics of patients who completed the questionnaire can be found in . Within both groups there was heterogeneity in terms of, amongst others, duration of the symptoms and pathology. However, as also can be seen, patient characteristics were similar between both groups.
Decision tree development
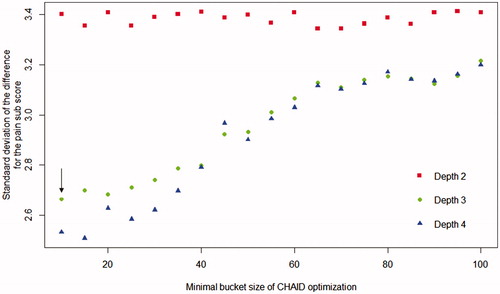
The results of the optimization for the CHAID based decision trees for the pain sub score, using the development group data, are displayed in . Maximal depth (i.e., the maximum number of questions that is allowed) was varied between two and four and minimal bucket size between 10 and 100. The minimal split size was linked to the minimal bucket size and was always three times larger. The standard deviation of the difference between the original PRWE and the predicted PRWE pain score in the development group ranged between 2.5 and 3.4 points on the 0–50 PRWE pain score, depending on the maximal depth and minimal bucket size. More specifically, a larger minimal bucket size and a maximum depth of 2 resulted in higher standard deviations while a maximal depth of 3 and 4 resulted in an almost equal standard deviation. Therefore, we selected a decision tree for the pain sub score, highlighted with the arrow, with a maximal depth of three and a minimal bucket size of 10.
Figure 1. Standard deviation of the difference between the PRWE pain score and the DT-PRWE pain score. Optimization of the CHAID-algorithm displaying the standard deviation of the difference between the original Patient Reported Wrist Evaluation (PRWE) and the decision tree-based PRWE (DT-PRWE) in the development set as a function of minimal bucket size and maximal depth of the CHAID-algorithm. A lower standard deviation indicates more similarity between both scores and therefore a better decision tree. The arrow indicates the decision tree that was selected for the PRWE-DT.
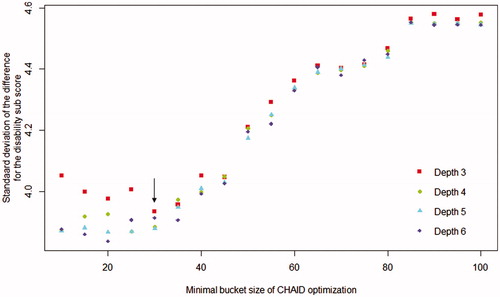
The results of the optimization for the CHAID-based decision trees for the disability sub score, using the development group data, are displayed in . Maximal depth was varied between three and six and minimal bucket size between 10 and 100. The minimal split size was linked to the minimal bucket size and was always three times larger. The standard deviation of the difference between the original PRWE and the predicted PRWE pain score in the development group ranged between 2.5 and 3.4 points on the 0–50 PRWE disability score, depending on the maximal depth and minimal bucket size. More specifically, a larger minimal bucket size resulted in higher standard deviations while any maximal depth resulted in an almost equal standard deviation. Therefore, we selected a decision tree for the disability sub score, highlighted with the arrow, with a maximal depth of three and a minimal bucket size of 30. A total of 336 terminal nodes were created, thus there are 336 different ways of navigation through the DT-PRWE with a maximum of 3 questions per patients per subdomain. An online version of the DT-PRWE [Citation24] can be filled in and provides subscores and a total score. In addition, syntax for a LimeSurvey version of the DT-PRWE questionnaire is available as download.
Figure 2. Standard deviation of the difference between the PRWE disability score and the DT-PRWE disability score. Optimization of the CHAID-algorithm displaying the standard deviation of the difference between the original Patient Reported Wrist Evaluation (PRWE) and the decision tree-based PRWE (DT-PRWE) in the development set as a function of minimal bucket size and maximal depth of the CHAID-algorithm. A lower standard deviation indicates more similarity between both scores and therefore a better decision tree. The arrow indicates the decision tree that was selected for the PRWE-DT.
Reliability and agreement
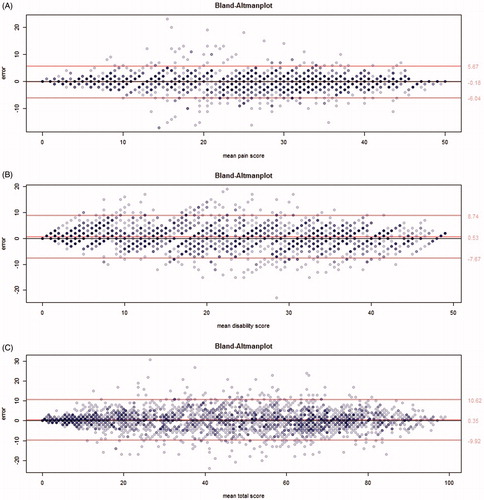
The differences in the validation dataset between the original PRWE and DT-PRWE for all individual questionnaires are displayed in . All figures display a normal distribution with a high peak around a zero difference and a relatively low width. The Intra Class Correlation(ICC) calculated between the original PRWE sumscore and the DT-PRWE was 0.96 for the pain subscore, 0.92 for the disability subscore and 0.97 for the total PRWE sumscore. Spearman correlations between the PRWE and DT-PRWE were 0.98, 0.97 and 0.98 for, respectively, function, pain and total score. The agreement between the PRWE and the DT-PRWE is further shown in the Bland Altman plots for both subscores (). From these plots, it can be seen that agreement is highest for high and low scores, while the middle range showed a lower agreement. Furthermore, the Bland-Altman plots show the mean difference between PRWE versions as the middle red line and the 95% confidence interval of the mean difference as the upper and lower red lines. The agreement of the pain subscore has a mean difference of −0.18 with a 95%CI between −6.04 and 5.67. The agreement of the disability subscore has a mean difference of 0.53 with a 95%CI between −7.67 and 8.74. The agreement of the total sumscore has a mean of 0.35 with a 95%CI between −9.92 and 10.62.
Figure 3. Distribution of the differences between original PRWE score and DT-PRWE. (A) shows this distribution for the pain sub score, (B) for the disability sub score and (C) for the total score of all questionnaires in the validation group. Furthermore, ICC of the total score is displayed for all questionnaires in the validation group.
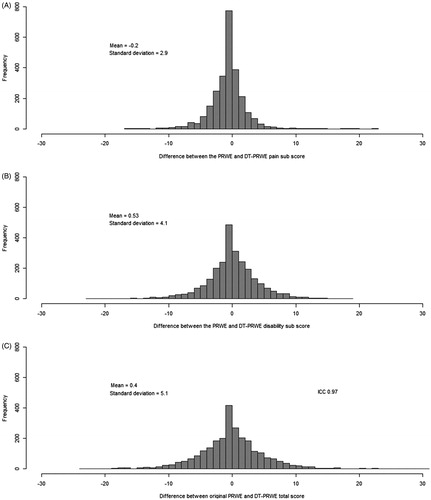
Figure 4. Bland-Altman plots displaying the agreement between the original PRWE and the decision tree PRWE. (A) shows this agreement for the pain subscore of the Patient Reported Wrist Evaluation (PRWE), (B) shows this agreement for the disability subscore of the Patient Reported Wrist Evaluation (PRWE), (C) shows this agreement for the total sumscore of the Patient Reported Wrist Evaluation. In all figures, the middle red line represents the mean error. The outer lines represent the 95% confidence interval. The darkness of the dots indicate the number of overlapping data points at the same location.
Discussion
This study developed and evaluated a decision tree-based version of the PRWE using the CHAID algorithm resulting in a a significant reduction in the number of questions while maintaining a high agreement with the original questionnaire. After parameter optimization, we developed a decision tree for the subscores of pain and disability separately, that can be combined into a total PRWE score. Using only a maximum of three questions per subscore, we found an ICC of 0.97 between the original PRWE sumscore and the DT-PRWE sumscore in our independent validation dataset. Bland-Altman plots indicated higher agreement between both versions in patients with relatively low and high scores, while a lower agreement was found in patients in the middle range of scores. The Bland-Altman plots do not show any systematic bias, although confidence intervals do indicate that scores could vary up to about 10% of the score maximum between versions.
The present study cannot directly be compared with previously performed test-retest validation studies. However, the reliability reported in these studies can provide context to interpret the differences that we find in the present study between the full version and the decision tree version The minimal detectable change of 12.2 [Citation22] is larger than the limits of agreement in the Bland-Altman plot, indicating that the difference between the full version and the decision tree scores is smaller than the minimal detectable difference of the original PRWE. This is also supported by the high correlation between the original and DT-PRWE scores.
The finding in the present study that the number of items of PROMs such as the PRWE can be reduced using techniques such as a decision tree questionnaire while maintaining high agreement with the original questionnaire is in line with findings for other reductions of PROMs, using similar or different techniques. Techniques to reduce item number can be divided into techniques resulting in fixed reductions and in dynamic reductions. When using fixed reductions, the reduced questionnaire always consists of the same items in the same order, such as in in the QuickDASH and Brief MHQ[Citation13,Citation14]. When using dynamic reductions, follow-up items are based on the response(s) of the previous item(s), such as in computerized adaptive testing [Citation25] and in a decision tree questionnaire. The QuickDASH and Brief MHQ were developed by identifying the questions that correlated best with the final score within each subscore. This resulted in a reduction of the DASH from thirty to eleven items, with an ICC of 0.94. The Brief-MHQ reduced the number of items from thirty-seven to twelve, with a correlation of 0.99 with the original score. This is comparable with the ICC of 0.97 we found in our study.
The decision tree approach used in the present study has a number of advantages. A first advantage is that we were able to maintain both subscores (pain and disability) and maintain the multidimensionality of the original PRWE. For example the QuickDash and Brief MHQ did not maintain subscores. In addition, maintaining this multidimensionality makes possible to combine and compare data from the DT-PRWE with data from the full questionnaire, since previously completed questionnaires of the full version can be converted to the DT-PRWE questionnaire score. Since a decision thee questionnaire can only be administered electronically, we made an electronic version of the questionnaire, available as download, in the open source LimeSurvey software to facilitate use of the DT-PRWE. This questionnaire can be administered using an internet connection or can be completed offline. In contrast, computerized adaptive testing (CAT) based on item response theory uses a continuous connection with a server to administer the questionnaire. Another advantage of CHAID over CAT is the potential efficiency in reducing items, as has been shown in previous research [Citation21].
The present study has a number of strengths and limitations. A strength is that we were able to develop and test the decision tree using over 10 000 completed questionnaires. This allowed the CHAID algorithm to develop a decision tree version of the PRWE with an agreement of 0.97. The large amount of questionnaires used for the development and validation allowed the algorithm to reliably predict a score on a scale between 0 and 50, similar to the original PRWE scale. A possible limitation of this study is that we simulated how patients would fill in the DT-PRWE based on their responses on the original PRWE. It is possible that responses to the proposed DT-PRWE differ from the responses to the original PRWE because the items are not asked in the same sequence.
A general limitation for any form of a short version of a questionnaire, whether it is using a fixed or dynamic reduction, it that it reduces the amount of information that is obtained from individual patients. When, for example, a questionnaire is used to screen if patients show specific patterns in specific questions at an individual patient level, then a short version of the questionnaire may not be appropriate. However, in case the questionnaire is also used to determine how the scores of a patient on specific items change over time, the DT version is not appropriate since the same questions may not be asked again. Additionally, future research should better determine the responsiveness, reproducibility and validity of the DT version. However, for example, for measuring outcome at group level, for comparative effectiveness, for quality of care evaluation and value-based healthcare, often several questionnaires are collected from the same patients and the outcome of interest is a total score. In that case, a shortened questionnaire may be a time-efficient way to increase patient compliance and reduce patient burden. A further application of our DT version to calculate a total score for the full PRWE when patients do not complete the entire questionnaire. Many outcome measure developers suggest substitution of the mean score, the impact of this strategy has not been evaluated and it can be problematic where multiple items are missing. Use of DT version would provide a validated approach to handling missingness.
Given the PRWE was already a relatively brief scale the benefits of reduction in items would have to be weighed against any potential changes in measurement properties beyond those evaluated in this study. Future research into questionnaire reduction using a decision tree should focus on multiple aspects of the reduced questionnaire. Primarily, the reliability of the DT-PRWE should be compared with the reliability of the original PRWE in a test-retest study, and where the scores are not derived from the full version. Secondly, responsiveness of both the DT-PRWE and the original PRWE should be tested, preferably for multiple musculoskeletal diagnoses. Finally, clinical implementation of the DT-PRWE should be investigated. More specifically, patients experience with the electronic DT-PRWE can provide an interesting point of view.
Conclusions
We found that the CHi-squared Automated Interaction Detection (CHAID) algorithm is able to reduce a patient reported outcomes measure, which is widely used in hand surgery and therapy, The developed decision tree patient reported wrist evaluation (DT-PRWE) uses maximal six instead of fifteen questions and has a high agreement with the original PRWE.
Data availability statement
All patients’ data were available but cannot be published in open access because it is owned by a third party, Xpert Clinic. Patient data can be shared upon request and when permission of Xpert Clinic is given. Please contact the corresponding author request access to the patient data.
Acknowledgements
We would like to thank all patients that have filled out questionnaires as part of their clinical care and that have agreed that their data could be anonymously used for the present study. In addition, we would like to acknowledge the members of the Hand-Wrist Study Group, caregivers and personnel of Xpert Clinic, Handtherapie Nederland and Equipe Zorgbedrijven for assisting in the routine outcome measurements that are the basis for this manuscript.
Disclosure statement
Joy C. MacDermid is also developer of the PRWHE.
References
- Rhee JS, McMullin BT. Outcome measures in facial plastic surgery: patient-reported and clinical efficacy measures. Arch Facial Plast Surg. 2008;10:194–207.
- Zhong T, Pusic AL. Future of outcomes research in plastic surgery. Clin Plast Surg. 2013;40:351–357.
- Pusic AL, Lemaine V, Klassen AF, et al. Patient-reported outcome measures in plastic surgery: use and interpretation in evidence-based medicine. Plast Reconstr Surg. 2011;127:1361–1367.
- Forbes M, Fairlamb H, Jonker L. The health of patients' eyes (HOPE) glaucoma study. The effectiveness of a 'glaucoma personal record' for newly diagnosed glaucoma patients: study protocol for a randomised controlled trial. Trials. 2015;16:337.
- Hendrikx J, Fransen J, van Riel PL. Monitoring rheumatoid arthritis using an algorithm based on patient-reported outcome measures: a first step towards personalised healthcare. RMD Open. 2015;1:e000114.
- Fayanju OM, Mayo TL, Spinks TE, et al. Value-based breast cancer care: a multidisciplinary approach for defining patient-centered outcomes. Ann Surg Oncol. 2016;23:2385–2390.
- MacDermid JC, Turgeon T, Richards RS, et al. Patient rating of wrist pain and disability: a reliable and valid measurement tool. J Orthop Trauma. 1998;12:577–586.
- MacDermid JC. Development of a scale for patient rating of wrist pain and disability. J Hand Ther. 1996;9:178–183.
- Brink SM, Voskamp EG, Houpt P, et al. Psychometric properties of the Patient Rated Wrist/Hand Evaluation - Dutch Language Version (PRWH/E-DLV). J Hand Surg Eur. 2009;34:556–557.
- Lalone E, MacDermid J, Grewal R, et al. Patient reported pain and disability following a distal radius fracture: a prospective study. Open Orthopaed J. 2017;11:589–599.
- Constand MK, MacDermid JC, Law M, et al. Patient-centered care and distal radius fracture outcomes: a prospective cohort study analysis. J Hand Ther. 2014;27:177–183.
- Edwards P, Roberts I, Sandercock P, et al. Follow-up by mail in clinical trials: does questionnaire length matter? Control Clin Trials. 2004;25:31–52.
- Edwards PJ, Roberts I, Clarke MJ, et al. Methods to increase response to postal and electronic questionnaires. Cochrane Database Syst Rev. 2009;3:MR000008.
- Bolt EE, van der Heide A, Onwuteaka-Philipsen BD. Reducing questionnaire length did not improve physician response rate: a randomized trial. J Clin Epidemiol. 2014;67:477–481.
- Hung M, Saltzman CL, Greene T, et al. The responsiveness of the PROMIS instruments and the qDASH in an upper extremity population. J Patient Rep Outcomes. 2017;1:12.
- Crins MHP, Terwee CB, Klausch T, et al. The Dutch-Flemish PROMIS Physical Function item bank exhibited strong psychometric properties in patients with chronic pain. J Clin Epidemiol. 2017;87:47–58.
- Beaton DE, Wright JG, Katz JN, et al. Development of the QuickDASH: comparison of three item-reduction approaches. J Bone Joint Surg Am. 2005;87:1038–1046.
- Waljee JF, Kim HM, Burns PB, et al. Development of a brief, 12-item version of the Michigan Hand Questionnaire. Plast Reconstr Surg. 2011;128:208–220.
- Cella D, Yount S, Rothrock N, et al. The patient-reported outcomes measurement information system (PROMIS): progress of an NIH roadmap cooperative group during its first two years. Med Care. 2007;45:S3–S11.
- GV K. An exploratory technique for investigating large quantities of categorical data. Appl Stat. 1980;29:119–127.
- Delgado-Gomez D, Baca-Garcia E, Aguado D, et al. Computerized adaptive test vs. decision trees: development of a support decision system to identify suicidal behavior. J Affect Disord. 2016;206:204–209.
- Schmitt JS, Di Fabio RP. Reliable change and minimum important difference (MID) proportions facilitated group responsiveness comparisons using individual threshold criteria. J Clin Epidemiol. 2004;57:1008–1018.
- TFSP T. CHAID: CHi-squared Automated Interaction Detection 2015.
- Van der Oest M. DT PRWE. 2017. Available from: http://www.handquestionnaires.net
- Beckmann JT, Hung M, Voss MW, et al. Evaluation of the patient-reported outcomes measurement information system upper extremity computer adaptive test. J Hand Surg Am. 2016;41:739–744 e4.