
Abstract
Purposes
To identify fatigue trajectories during/after stroke rehabilitation, to determine characteristics associated with trajectory membership before discharge and to investigate how these trajectories and activity pacing are associated with sustained physical activity after rehabilitation.
Methods
People after stroke (n = 206) were followed from 3–6 weeks before discharge (T0) to 14 (T1), 33 (T2) and 52 (T3) weeks after discharge from rehabilitation in the ReSpAct study. Latent Class analysis was used to identify trajectories of perceived fatigue. Binomial multivariable logistic regression analyses were performed to determine characteristics associated with trajectory membership (T0). Multilevel regression analyses were used to investigate how perceived fatigue and activity pacing were associated with self-reported physical activity (T0–T3).
Results
Three fatigue trajectories were identified: high (n = 163), low (n = 41) and recovery (n = 2). Compared with the high fatigue trajectory, people in the low fatigue trajectory were more likely to report higher levels of health-related quality of life (HR-QoL) (OR = 3.07, 95%CI = 1.51–6.26) and physical activity (OR = 1.93, 95%CI = 1.07–3.47). Sustained high levels of physical activity after rehabilitation were significantly associated with low perceived fatigue and high perceived risk of overactivity.
Conclusions
Three fatigue trajectories after stroke rehabilitation were identified. High levels of HR-QoL and physical activity before discharge identified people in the low fatigue trajectory. A physically active lifestyle after rehabilitation was associated with low perceived fatigue and perceived risk of overactivity.
Since almost 80% of people after stroke in this study perceived severe fatigue up to 1 year after stroke rehabilitation, activities focusing on the management of fatigue symptoms should be integrated in general stroke rehabilitation.
In clinical practice, low levels of health-related quality of life and low levels of self-reported physical activity before discharge from stroke rehabilitation should be considered by rehabilitation professionals (e.g., physicians, physiotherapists, and physical activity counsellors) since these characteristics can predict chronic perceived fatigue up to 1 year after stroke rehabilitation.
A physical activity counselling programme delivered during and after stroke rehabilitation may be improved by incorporating tailored advice regarding the management of fatigue.
IMPLICATIONS FOR REHABILITATION
Introduction
It is worrisome that most people after stroke, one of the largest populations in rehabilitation [Citation1,Citation2], spend their time inactive and sedentary [Citation3]. This is the more so, since a physically active lifestyle contributes to the improvement of functioning and health (e.g., reducing the risk of new cardiovascular events and maintaining functional autonomy), encourages socialization (e.g., participating in sports groups), and is deemed crucial for the quality of life [Citation1,Citation3–5]. Promoting physical activity during and after stroke rehabilitation seems to be promising and is therefore recommended [Citation6–9]. Although research has shown that tailored physical activity counselling sessions can increase physical activity levels in people after stroke [Citation6,Citation7], these increased physical activity levels are not always sustained at the longer term. A possible reason for this is that people after stroke may experience barriers to obtain and maintain a physically activity lifestyle [Citation10,Citation11].
A common and distressing personal barrier that is often reported by people after stroke is (perceived) fatigue, which is also one of the strongest predictors of daily functional limitations [Citation12,Citation13]. Indeed, people after stroke reported higher levels of fatigue compared with healthy adults [Citation14]. However, there is a large variability in fatigue levels reported by and measured in people after stroke [Citation15,Citation16]. The wide variability in fatigue (wide range of prevalence and intensity) in people after stroke is potentially driven by population heterogeneity [Citation13], for example, age, sex, depression, pain, anxiety symptoms, employment status before the stroke, pre-stroke fatigue and excessive daytime sleepiness [Citation17–20]. Furthermore, the variability in (perceived) fatigue can be due to the large variation in measurement tools to assess fatigue (e.g., maximal voluntary contractions versus surveys) [Citation13,Citation21] and/or the large variation in definitions of fatigue [Citation16]. Enoka and Duchateau previously raised this terminology issue and defined fatigue as “a disabling symptom in which physical and cognitive function is limited by interactions between performance fatigue and perceived fatigue” [Citation22,Citation23]. The current study only focused on perceived fatigue assessed with a questionnaire (the fatigue severity scale). It explores the large variability in fatigue among people after stroke in a longitudinal multicentre study design focussed on the evolution over time of a physically active lifestyle after rehabilitation [Citation15,Citation16,Citation24]. This prospective questionnaire-based cohort study provided the opportunity to explore perceived fatigue patterns over time (trajectories of perceived fatigue) in people after stroke [Citation16,Citation25] (by performing latent class growth mixture modelling) in the context of a physically active lifestyle, personal, disease/health, psychosocial, lifestyle and environmental characteristics.
How people effectively manage their fatigue during the day, for example, by dividing their daily activities into smaller, more manageable, portions, is called activity pacing behaviour. Questions raised when unravelling fatigue in the context of a physically active lifestyle in general are: how do people deal with their fatigue during the day, and how do people divide their energy and daily physical activities during the day in order to reduce fatigue? Two different attitudes towards activity pacing behaviour can be identified: (1) people are at risk of underactivity and probably more aware of how they divide their energy and activities during the day, as they are afraid to overdo the activities [Citation26] and (2) people are at risk of overactivity characterized by an un-even activity pattern consisting of high activity peaks followed by long periods of inactivity [Citation27–33]. The literature on activity pacing in rehabilitation populations today is scarce [Citation34,Citation35]. A better understanding of activity pacing behaviour in people after stroke with varying levels of perceived fatigue might provide new directions for more person-specific physical activity stimulation programmes in rehabilitation.
The physical activity and sports stimulation programme Rehabilitation, Sports and Exercise (RSE; Dutch: “Revalidatie, Sport en Bewegen”) is a programme in rehabilitation practice aiming to stimulate an active lifestyle in adults with a physical disability and/or chronic disease [Citation36,Citation37]. The Rehabilitation, Sports and Active lifestyle study (ReSpAct) is a multicentre longitudinal cohort study (with people after stroke as a largest subgroup), that was designed to evaluate the RSE programme [Citation36,Citation37] within the context of the International Classification of Disability, Functioning and Health [Citation38].
The current study is part of the ReSpAct study and aimed (1) to explore perceived fatigue with identifying trajectories of perceived fatigue during and after stroke rehabilitation, (2) to determine which personal, disease/health, psychosocial, lifestyle and environmental characteristics before discharge are associated with the different trajectories of perceived fatigue (also called trajectory membership of perceived fatigue) and (3) to explore how trajectories of perceived fatigue and activity pacing are associated with physical activity over time up to 1 year after stroke rehabilitation. In the current study, associations between physical activity, perceived fatigue and activity pacing will be studied in separate statistical models to help understand the independent role of perceived fatigue as well as in combination with activity pacing. In this context the following hypotheses were formulated: firstly, we hypothesized that most people after stroke perceive chronic high fatigue levels even up till 1 year after rehabilitation [Citation1,Citation13]. Secondly, we expected personal related and disease/health-related characteristics to be associated with trajectory membership of perceived fatigue. Thirdly, we hypothesized that high perceived fatigue is associated with maintaining a lower physically active lifestyle after stroke rehabilitation [Citation39,Citation40]. Finally, we expected that when people after a stroke are aware of their activity pacing related decisions, it allows them to gradually enhance physical activity after stroke rehabilitation [Citation41–43].
Methods
Context and theoretical framework
This study is part of the multicentre longitudinal cohort study ReSpAct that was designed to evaluate the RSE programme [Citation36,Citation37]. This motivational interview-based physical activity and sports stimulation RSE programme aims to stimulate an active lifestyle in people with a physical disability and/or chronic disease during the rehabilitation period and to guide them in maintaining a physically active lifestyle in the home setting after discharge from rehabilitation [Citation36,Citation37]. Three to six weeks before discharge from rehabilitation, participants in the RSE programme were referred to a physical activity counselling centre for a face-to-face consultation with physical activity and sports counsellor, followed by four telephone-based counselling sessions (based on motivational interviewing) up to 13 weeks after discharge from rehabilitation [Citation36,Citation37]. The RSE programme was successfully implemented in Dutch rehabilitation practice [Citation8].
The stages of change concept of the Transtheoretical model and the Physical Activity for people with a Disability (PAD) model [Citation44] formed the theoretical basis for the RSE programme [Citation37]. These models provide insight into the process of behavioural change and the relationships between physical activity behaviour, its determinants and the daily functioning of people with a disability [Citation44]. The PAD model is an integration of the Attitude, Social influence and self-Efficacy model in the International Classification of Functioning, Disability and Health (ICF) model [Citation44].
Participants were included in the ReSpAct study from May 2013 till August 2015. Participants were followed over time: at baseline (T0: 3–6 weeks before discharge) and at 14 (T1), 33 (T2) and 52 (T3) weeks after discharge from clinical rehabilitation [Citation37]. Each measurement consisted of filling out a set of questionnaires. The study was approved by the ethics committee of the Center for Human Movement Sciences of the University Medical Center Groningen (reference: ECB/2013.02.28_1, which can be found on the Open Science Framework: osf.io/f4hjc/). All participants signed informed consent.
Study population
Participants were recruited through seventeen rehabilitation institutions across the Netherlands (11 rehabilitation centres and 6 rehabilitation departments of hospitals). Inclusion criteria for the current study were (1) being at least 18 years of age, (2) having been diagnosed with a stroke, (3) receiving inpatient or outpatient rehabilitation care or treatment within one of the participating rehabilitation institutions, (4) participating in the RSE programme, and (5) filling in the Fatigue Severity Scale (FSS) at two or more measurement occasions. Participants were excluded when they were not able to complete the questionnaires, even with help, or were participating in another physical activity stimulation programme [Citation37]. The current study concerns the cohort of those persons with a stroke.
Measures
Self-reported physical activity
Physical activity was assessed with the Short Questionnaire to Assess Health-enhancing physical activity (SQUASH) [Citation45], a 19-item self-reported recall questionnaire, which is a valid and reliable measurement tool to assess the total minutes of physical activity in healthy adults [Citation45] and in patient populations [Citation46,Citation47] based on an average week in the past month. The SQUASH is pre-structured in four main domains outlining types and settings of activity: “commuting traffic.” “activities at work and school.” “household activities” and “leisure time activities” including “sports activities” [Citation45]. The ReSpAct research team adapted the SQUASH to make it applicable for people with a physical disability and/or chronic disease as described elsewhere [Citation37]. A previous study found that the intraclass correlation coefficient for the test–retest reliability of the Adapted-SQUASH was 0.76 (p < 0.001) for the total minutes of activity and the intraclass correlation coefficient for the validity was 0.22 (p = 0.027) between the Actiheart activity monitor and the Adapted-SQUASH [Citation48].
Perceived fatigue
Perceived fatigue severity was assessed by using the FSS questionnaire [Citation49,Citation50]. The FSS (range: 1–7) is a valid and reliable questionnaire to determine the impact of perceived fatigue in several patient populations (e.g., stroke) [Citation51,Citation52] and to detect change over time [Citation51]. A higher score on the FSS indicated greater fatigue severity, in which a FSS score of 4 or greater indicates severe fatigue [Citation49].
Activity pacing
Activity pacing was assessed by using a self-constructed seven-item questionnaire based on literature [Citation53–55]. This questionnaire assessed the two different attitudes of activity pacing and evaluated how and based on what aspects people modify their physical activity behaviour over the day. The questionnaire includes two constructs of attitudes towards engagement in activity pacing: (1) a two-item construct on persons’ perceptions of being at risk of overactivity (Cronbach’s α = 0.71), and (2) a five-item construct on persons’ awareness of their engagement in activity pacing (Cronbach’s α = 0.78). The participants scored the seven items of the questionnaire on a scale of 1–5 (1 = never, 2 = rarely, 3 = sometimes, 4 = often, 5 = very often). Sum scores were calculated for each construct (range from 2–10 and from 5–25, respectively). Reliability and construct validity have been investigated by the ReSpAct research team and a paper is in preparation [Citation56].
Personal characteristics
Personal characteristics include sex, age at inclusion, body mass index (BMI) in kg/m2, living situation and level of education dichotomized into low (up to completed secondary education) and high (completed applied University or higher) to make it internationally comparable.
Disease/health characteristics
Disease/health characteristics include the number of comorbidities dichotomized into no comorbidities and one or more comorbidities because this variable included all kind of diseases and disabilities reported by a participant, which makes this value hard to compare between people. The level of acceptance of the stroke was assessed on a four-point Likert scale (1–4, no acceptance to complete acceptance), with a higher score indicating better acceptance of the stroke. The level of acceptance was dichotomized into no (no or little acceptance) and yes (acceptance to a large extent or completely), because the assumption for linearity was not met. Health-related quality of life (HR-QoL) was assessed by using the self-reported RAND-12 questionnaire [Citation57], an adapted, abbreviated version of the RAND-36 [Citation58–60]. We used an age-corrected general health score for this study [Citation58]. A higher score on the RAND-12 (range 0-65) indicated better quality of life [Citation58,Citation59].
Psychosocial characteristics
Psychosocial characteristics include motivation towards physical activity assessed with the 19-item Behavioural Regulation in Exercise Questionnaire (BREQ-2) (range of the total score from −80 to 80) [Citation61]. The BREQ-2 is factorially validated among adults who participated in an exercise referral scheme [Citation61]. Self-efficacy towards physical activity (range: 0–70) was assessed by using five items out of an existing questionnaire, which was designed to measure one’s ability to maintain physical activity in various situations and showed good internal consistency (Cronbach’s α = 0.82) [Citation62], and two additional items formulated by the ReSpAct research team in order to assess a more comprehensive self-efficacy construct. The internal consistency of the self-efficacy questionnaire assessed in the ReSpAct cohort (n = 1719) improved after adding the two items. More information on the internal consistency of the self-efficacy questionnaire used in this study can be found on the Open Science Framework (osf.io/mg6z9/).
Lifestyle characteristics
Lifestyle characteristics included the dichotomous variables smoking and alcohol use (“Do you currently smoke?” and “Do you currently consume alcohol?”: yes or no). Information on sports participation (yes/no) was obtained from an additional question derived from the SQUASH questionnaire. If the participant reported performing at least one sports activity per week, then they were coded as “yes.” if not as “no.”
Environmental characteristics
Environmental characteristics include the rehabilitation and treatment context and the number of received physical activity counselling moments as part of the RSE programme.
Statistical analyses
Descriptive statistics at baseline (T0) of the included sample, the excluded sample and for the trajectories of perceived fatigue were analysed using the Statistical Package for the Social Science (IBM SPSS Statistics, version 24). The statistical analyses for the three aims of this study are described below.
Firstly, trajectories of perceived fatigue during and after rehabilitation were identified by fitting latent class growth mixture (LCGM) models to the data of the FSS score, with quadratic (assuming non-linear change over time), linear (assuming linear change over time) and latent class analyses (LCA) models [Citation63], using the Mplus software programme 7.11 (Muthén & Muthén, Los Angeles, CA). From the ReSpAct study population, only people after stroke with at least two measurement occasions over time were included for these analyses. LCGM models are based on regression and structural equation modelling techniques. These techniques assume that there are multiple underlying subpopulations (or latent classes), that each follows a unique trajectory of perceived fatigue over time, which provide us with insight in the heterogeneity of patterns in perceived fatigue over time. The latent classes to which individuals belong are denoted by the term “trajectory membership.” The classes in perceived fatigue are based on the total FSS scores at T0, T1, T2 and T3 (dependent variables). Common stepwise modelling strategies were applied [Citation63]. The Guidelines for Reporting on Latent Trajectory Studies (GRoLTS) were used to transparently report the results of the LCGM modelling analyses [Citation64]. First, a one-class model was determined. Subsequently, more classes were added one at a time to investigate if the model fit improves due to the additional class [Citation63,Citation65]. A 1–4 trajectory solution was inspected. The optimal number of classes was determined according to the following model fit criteria: (1) a lower Bayesian Information Criterion (BIC), where a difference of ten points lower is usually regarded as sufficient improvement [Citation66], (2) a higher entropy (range from 0 to 1), a standardized measure of how accurately individuals’ trajectories are classified, where higher values indicate better classification [Citation67,Citation68] and (3) average posterior probabilities of ≥0.80 [Citation63]. In addition, clinical interpretation (rejecting solutions that do not make clinical sense) of the trajectories were considered for the optimal number of classes. Participants were classified into their most likely class (trajectory membership) based on their posterior probabilities.
Secondly, a binomial multivariable logistic regression analysis was performed to assess associations between trajectory membership (dependent variable) and different independent variables: characteristics of the study population (personal, disease/health, psychosocial, lifestyle and environmental), using the Statistical Package for the Social Science (IBM SPSS Statistics, version 24). Descriptive statistics of the independent variables were analysed at baseline. Assumptions of normality and linearity were met. All continuous independent variables were standardized. Independent variables at baseline were all entered block-wise based on the PAD model (block 1: personal characteristics, block 2: disease/health characteristics, block 3: psychosocial characteristics, block 4: lifestyle characteristics, block 5: environmental characteristics) in a multivariable model. Results of the binomial multivariable logistic regression analysis were presented as odds ratios (OR) and corresponding 95% confidence intervals (95%CI).
Thirdly, multilevel regression analysis was performed to determine whether and how perceived fatigue and attitudes towards engagement in activity pacing were associated with physical activity up to 1 year after stroke rehabilitation by using MLwiN 3.0. The total minutes of physical activity based on the Adapted-SQUASH was the dependent variable in the multilevel regression analysis. A three-level model was used in which repeated measures (Level 1) were clustered within individuals (Level 2), and individuals were clustered within institutions (Level 3). The model was corrected for sex, age, BMI and treatment context at baseline (level two variables), as well as motivation and self-efficacy scores from T0 to T3 (level one variables). These confounders are based on the PAD model. Firstly, perceived fatigue was added in model 1 as an independent variable, a dichotomized variable based on the identified high and low fatigue trajectories. Activity pacing for both awareness of engagement in activity pacing and perceived risk of overactivity were entered separately (due to collinearity) in respectively model 2 and model 3. All continuous variables in the multilevel model were standardized. Random intercepts were considered thus allowing a unique intercept for each individual participant [Citation69]. We expected variation in physical activity behaviour between participants. Therefore, random slopes were entered into the model to properly account for correlations amongst repeated measures within individuals. The independent variables were entered separately into the initial model. During each step goodness of fit was evaluated by comparing the −2*Log Likelihood (IGLS deviance) of the previous model, with the most recent model. In general, two-sided p-values were given, where a p-value lower than 0.05 was regarded as statistically significant.
To facilitate transparency and reproducibility, additional information is available in the supplemental material and on the Open Science Framework (osf.io/f4hjc/): (a) the dataset of perceived fatigue at T0–T3, (b) the Mplus syntax of the LCGM modelling, the SPSS syntax of the binomial multivariable logistic regression analysis, and the multilevel models in MLwiN, and (c) an overview table of the statistical analyses used in the current study.
Results
Characteristics of the participants
In total 303 persons after stroke were included in the ReSpAct study, whereof data from 206 participants (68%) completed at least two measurement occasions with perceived fatigue data and were included in the LGCM modelling analyses. Participants had an average age of 55.3 ± 10.8 years and 41.7% were female (). Descriptive statistics at T0 for included (n = 206) and excluded (n = 97) participants for the LCGM modelling analyses are presented in . Participants excluded for the LGCM modelling analyses lived less independent, had worse acceptance of the stroke, had a lower HR-QoL score, smoked more, and received less physical activity counselling moments after rehabilitation.
Table 1. Participants’ descriptive statistics at baseline for participants included (n = 206) and excluded (n = 97) in the latent class growth mixture modelling analyses.
Trajectories of perceived fatigue
LCGM modelling showed distinct trajectories of perceived fatigue based on the total FSS score after rehabilitation (n = 206). The results of the fit indices for quadratic, linear and LCA models with one to four trajectories are presented in . According to the model fit criteria () and clinical interpretation, the three-trajectory linear model for perceived fatigue was superior. Quadratic and LCA models were considered but showed worse statistical fit compared with the linear models. Three fatigue trajectories were identified whereof one large and stable trajectory with slightly increasing high perceived fatigue over time (labelled “high.” n = 163, 79.1%), one smaller stable trajectory with slightly decreasing low perceived fatigue over time (labelled “low.” n = 41, 19.9%), and one very small trajectory with a large decline in perceived fatigue (labelled “recovery.” n = 2, 1.0%) (). Supplementary figures can be found on the Open Science Framework (see osf.io/f4hjc/), including estimated mean trajectories for each model and the estimated with observed means for the final model. For each trajectory of perceived fatigue, the estimated mean with individual trajectories are presented in . Although the average course of perceived fatigue is relatively stable over time, shows that heterogeneity within the identified trajectories of perceived fatigue is high. Most individual trajectories in the trajectory of high perceived fatigue lie above the cut-off point (FSS > 4) for severe fatigue () and in the trajectory of low perceived fatigue lie below this cut-off point (). The two individual trajectories within the trajectory of recovery perceived fatigue show a large shift from severe fatigue (T0–T1) to low fatigue (T2–T3). The trajectory of recovery perceived fatigue was left out of further analyses due to the too-small sample size.
Figure 1. Three trajectory model of perceived fatigue (FSS score) during and after rehabilitation in people after stroke (n = 206), based on latent class growth mixture modelling.
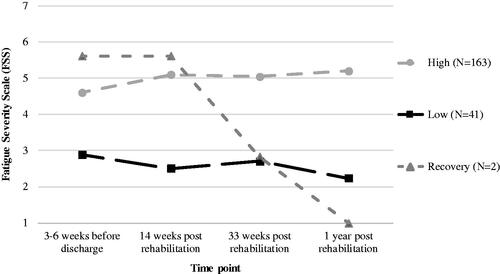
Figure 2. Individual trajectories within each trajectory of perceived fatigue, based on latent class growth mixture modelling: (A) High, n = 163, (B) Low, n = 41, (C) Recovery, n = 2.
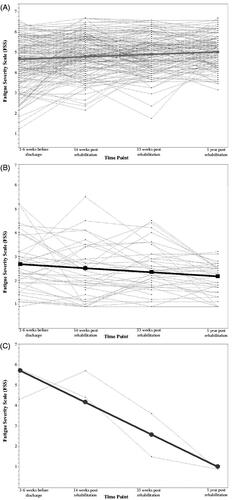
Table 2. Fit indices for latent class growth mixture models with 1–4 trajectories of perceived fatigue (FSS score) in people after stroke rehabilitation (n = 206).
Characteristics of the trajectories of perceived fatigue
Baseline descriptive statistics of characteristics – 3 to 6 weeks before discharge from rehabilitation (T0) – of the trajectories of high and low perceived fatigue are displayed in . Binomial multivariate logistic regression analysis was performed to determine which characteristics (personal, disease/health, psychosocial, lifestyle and environmental) could discriminate between the trajectories of high and low perceived fatigue (). Compared with the trajectory of high perceived fatigue, people after stroke in the trajectory of low perceived fatigue were more likely to experience high levels of HR-QoL (OR = 3.07, 95%CI = 1.51–6.26) and were more likely to be physically active (OR = 1.93, 95%CI = 1.07–3.47) at baseline (T0) ().
Table 3. Descriptive statistics of characteristics 3–6 weeks before discharge (T0) for the high (n = 163) and low (n = 41) trajectories of perceived fatigue among people after stroke and binomial multivariate logistic regression analysis to distinguish between those trajectories.
Fatigue and activity pacing associated with physical activity
Descriptive statistics of self-reported physical activity from T0 to T3 are presented in , both for the trajectories of high and low perceived fatigue. People in the trajectory of low perceived fatigue had higher levels of physical activity over time compared to people in the trajectory of high perceived fatigue (). Results of the multilevel regression analysis are presented in . A random intercept model at level 2 did improve the model fit, but a random intercept model for rehabilitation institutions did not improve the model fit. The third multilevel model showed that the trajectory of low perceived fatigue (β = 0.57[0.14], 95%CI = 0.30–0.84) and higher levels of the perceived risk of overactivity (β = 0.11[0.05], 95%CI = 0.02–0.20) were simultaneously associated with higher levels of self-reported physical activity (min/week) after correction for sex, age, BMI, treatment context, motivation and self-efficacy (). People in the trajectory of low perceived fatigue had almost half a standard deviation higher levels of self-reported physical activity over time compared to people in the trajectory of high perceived fatigue. High awareness of activity pacing was not significantly associated with self-reported physical activity. Random slopes did not improve the model fit.
Figure 3. Self-reported physical activity (min/week) during and after rehabilitation in the high (n = 163) and low (n = 41) trajectories of perceived fatigue, based on descriptive statistics (medians).
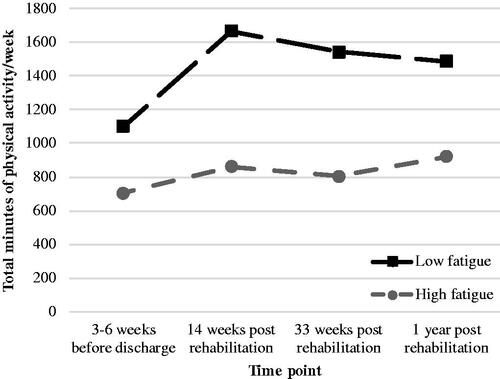
Table 4. Results of the multilevel regression analyses for the outcome – total minutes of self-reported physical activity per week – in three subsequent models for determinants perceived fatigue (model 1), awareness of activity pacing (model 2) and risk of overactivity (model 3) for data from T0 to T3 in people after stroke (n = 204).
Discussion
Firstly, the current study aimed to explore perceived fatigue with identifying fatigue trajectories during and after stroke rehabilitation using LCGM. We identified two main trajectories of perceived fatigue (high and low) during and after discharge from stroke rehabilitation and one very small trajectory (recovery). Most people after stroke (79.1%) perceived high fatigue even up to 1 year after rehabilitation, while 19.9% of the sample indicated a trajectory of low perceived fatigue. This finding highlights that perceived fatigue is a very common and chronic symptom in people after stroke, which is in accordance with previous literature [Citation12,Citation14]. Although most people after stroke were assigned to stable trajectories of perceived fatigue, high levels of within-person heterogeneity were found, indicating that levels of perceived fatigue might fluctuate over time (). On average, the fatigue severity identified in our sample 3–6 weeks before discharge from stroke rehabilitation (FSS score = 4.3 ± 1.4) is lower compared to that in patients with fibromyalgia (FSS score = 6 ± 1) [Citation70] and patients with rheumatoid arthritis (FSS score = 5 ± 1) [Citation70].
Secondly, this study determined which characteristics (personal, disease/health, psychosocial, lifestyle and environmental) before discharge from rehabilitation are associated with the two main trajectories of perceived fatigue. High levels of HR-QoL and high levels of physical activity before discharge distinguished people in the trajectory of low perceived fatigue from people in the trajectory of high perceived fatigue. In general, most personal and disease/health characteristics were not found to be significant characteristics of trajectory membership of perceived fatigue, which contrasts with our hypothesis. A possible explanation for this is that previous literature mostly focused on predictors for fatigue up to 6 months after stroke [Citation71,Citation72], while the current study determined predictors for fatigue from 3–6 weeks before discharge up to 1 year after stroke rehabilitation. Probably, predictors for fatigue early after stroke, like personal and disease/health characteristics, are not necessarily predictors for fatigue in the chronic phase after stroke.
Thirdly, this study explored how the trajectories of high and low perceived fatigue and activity pacing are associated with self-reported physical activity up to 1 year after stroke rehabilitation. We found that people after stroke in the trajectory of low perceived fatigue, who participated in the physical activity stimulation RSE programme [Citation36,Citation37], showed higher levels of self-reported physical activity even up to 1 year after discharge from rehabilitation compared to people in the trajectory of high perceived fatigue. Note: this is not a causal relationship. This finding supports literature on the benefits of counselling on promoting participation in physical activity during and after stroke rehabilitation [Citation6,Citation7]. However, most of our sample showed high levels of perceived fatigue which in turn were associated with low levels of self-reported physical activity up to 1 year after rehabilitation after correction for several confounders. Although 63% of our sample did receive three or more counselling moments, the content of the counselling from physical activity and sports counsellor during and after rehabilitation may be improved by providing more targeted advice regarding the management of fatigue. Furthermore, our results did not support our hypothesis that people after stroke who are aware of their engagement in activity pacing are more physically active. We found that people who perceived to be at risk of overactivity, are not afraid to overdo, because they reported higher levels of physical activity. However, the RSE programme did not specifically focus on the management of fatigue and/or activity pacing behaviour. We are not sure if advice on fatigue has been provided by rehabilitation professionals during and after rehabilitation. Tailored advice on how to manage fatigue and energy during the day in people after stroke might be recommended. Abonie et al. concluded in their meta-analysis that both perceived fatigue severity and levels of physical activity improved after activity pacing interventions in patients with chronic diseases [Citation35].
Strengths and limitations
The principal strength of the current study lies in its multicentre longitudinal cohort design, including one baseline measurement and three follow-up measurements up to 1 year after stroke rehabilitation, and the use of LCGM modelling to identify trajectories of perceived fatigue. To our knowledge, a data-driven LCGM modelling has never been used before to analyse the course of perceived fatigue during and after discharge from stroke rehabilitation, which has some advantages compared to the traditional way of summarizing patient-data over time into “the average of a group” [Citation63]. This specific methodological technique categorises people based on their developmental pattern instead of on a-priori classification in predefined groups [Citation62,Citation69]. Also, this Latent Class Growth approach categorises people in homogenous subgroups, which might represent different underlying subpopulations requiring different interventions regarding the management of perceived fatigue [Citation63]. To support this data-driven approach, open communication of the performed analyses and results is important. Therefore, to make the LCGM modelling more transparent, the data, syntax and results are available on the Open Science Framework (osf.io/f4hjc/), and we used the GRoLTS checklist [Citation64] in reporting the results of the LCGM modelling analyses.
Some limitations of this study need to be addressed. An important point of discussion is the decision of the number of classes and the low sample size in one of the classes when considering both the model fit criteria and clinical interpretation. Choices made during the modelling process based on model fit criteria, but also the sample size and the number of measurement occasions have been shown to influence the number and characteristics of the identified classes in the final model [Citation73–77]. This may influence the interpretation of the models and subsequent implications. The identified “recovery” trajectory consisted of only two people, excluding further secondary statistical analyses.
We are not able to describe our study population in terms of the type of stroke, the severity of the stroke and the side of affection, because these data were not available in more detail in the current study. However, we think that stroke severity would not be a significant determinant for trajectory membership, since a recent study of Chen and Marsh (2018) found that early post-stroke fatigue (<6 months after stroke) was largely attributable to characteristics of the stroke (e.g., stroke severity), while chronic fatigue (>6 months after stroke) was not [Citation71]. In the ReSpAct study, fatigue was assessed from 3–6 weeks before discharge up to 1 year after rehabilitation, which is the chronic phase after stroke. Besides the lack of these stroke-related variables, the current study did not use stroke-related questionnaires. Also, the multicentre longitudinal cohort study ReSpAct is entirely questionnaire-based. Measurements on performance fatigue and objectively measured physical activity could have improved the current study.
Finally, people after stroke often may have comorbidities such as cognitive impairments and/or communication issues, which are often exclusion criteria in stroke research [Citation78]. The ReSpAct study included in that sense a positive selection of people after stroke, who were – at the time of inclusion, at the end of their rehabilitation – willing to participate on a voluntary basis and were able to fill in the questionnaires by themselves or with help at several measurement moments over a long period of time. This leads to the assumption that the population in the current study was a positive selection and may not have had severe cognitive impairments or communication issues. Besides, the excluded participants in the current study lived less independent and had worse acceptance of the stroke, which stresses the assumption that the persons we finally included may have had a less severe stroke. Therefore, the generalizability of the findings of the current study to other stroke populations should be done with caution. Also, our stroke population seems to be on average less physically active before discharge from rehabilitation (963 ± 818 min/week assessed with the Adapted-SQUASH) compared with patients after total hip arthroplasty (1694 ± 1173 min/week) [Citation51], patients with multiple sclerosis (1815 min/week) [Citation72], patients after total knee replacement (1347 ± 1278 min/week) [Citation73], and healthy adults (3045 ± 931 min/week) [Citation50], all assessed with the self-reported SQUASH.
Practical implications and future directions
We recommend rehabilitation professionals (e.g., physicians, physiotherapist, sports counsellors) to pay attention to fatigue symptoms in people after stroke. Especially people after stroke who are less physically active and perceive low levels of HR-QoL 3–6 weeks before discharge are at risk of perceiving high levels of fatigue even up to 1 year after the rehabilitation.
However, it is still unclear which advice on the management of fatigue (e.g., activity pacing) reduces fatigue and enhances physical activity during and after stroke rehabilitation. Firstly, qualitative research on fatigue and activity pacing in the context of a physically active lifestyle could improve our knowledge of these constructs. Also, to improve our understanding on activity pacing in people after stroke, it is recommended to use objectively measured activity pacing (by using accelerometers) to determine how people divide their physical activities during the day, like in previous studies on people with rheumatoid arthritis [Citation79] and in people with osteoarthritis [Citation80,Citation81]. Thereafter, more research is needed focusing on the development of treatments aiming to reduce perceived fatigue levels and to enhance physical activity after rehabilitation.
Conclusion
This study identified two main trajectories of perceived fatigue and one very small trajectory during and after stroke rehabilitation: high, low and recovery. Almost 80% of people after stroke perceived severe fatigue even up until 1 year after the rehabilitation. High levels of HR-QoL and high levels of self-reported physical activity before discharge identified people after stroke in the low fatigue trajectory. Furthermore, higher levels of self-reported physical activity over time after rehabilitation were associated with low perceived fatigue and high perceived risk of overactivity simultaneously. Early identification of perceived fatigue is important in the context of a physically active lifestyle. Future research may consider activity pacing as being of added value to rehabilitation programmes.
Acknowledgements
The authors would like to thank all participants for their contribution to the ReSpAct study. Furthermore, we would like to thank the following eighteen organizations for their support to the ReSpAct study: Adelante zorggroep, Bethesda Ziekenhuis, De Trappenberg, De Vogellanden, Maasstad Ziekenhuis, Medisch Centrum Alkmaar, Militair Revalidatiecentrum Aardenburg, Revalidatiecentrum Leijpark, Revalidatiecentrum Reade, Revalidatie Friesland, Revant, Rijnlands Revalidatiecentrum, RMC Groot Klimmendaal, Scheper Ziekenhuis, Sint Maartenskliniek, Sophia Revalidatie, Tolbrug Revalidatie, ViaReva.
Disclosure statement
No potential conflict of interest was reported by the author(s).
Additional information
Funding
References
- Billinger SA, Arena R, Bernhardt J, et al. Physical activity and exercise recommendations for stroke survivors: a statement for healthcare professionals from the American heart association/American stroke association. Stroke. 2014;45(8):2532–2553.
- Ma VY, Chan L, Carruthers KJ. Incidence, prevalence, costs, and impact on disability of common conditions requiring rehabilitation in the united states: stroke, spinal cord injury, traumatic brain injury, multiple sclerosis, osteoarthritis, rheumatoid arthritis, limb loss, and back pain. Arch Phys Med Rehabil. 2014;95(5):986–995.
- Fini NA, Holland AE, Keating J, et al. How physically active are people following stroke? Systematic review and quantitative synthesis. Phys Ther. 2017;97(7):707–717.
- Belfiore P, Miele A, Galle F, et al. Adapted physical activity and stroke: a systematic review. J Sports Med Phys Fitness. 2018;58(12):1867–1875.
- Haskell WL, Lee IM, Pate RR, et al. Physical activity and public health: updated recommendation for adults from the American college of sports medicine and the American heart association. Circulation. 2007;116(9):1081–1093.
- van der Ploeg HP, Streppel KR, van der Beek AJ, et al. Successfully improving physical activity behavior after rehabilitation. Am J Health Promot. 2007;21(3):153–159.
- Morris JH, MacGillivray S, Mcfarlane S. Interventions to promote long-term participation in physical activity after stroke: a systematic review of the literature. Arch Phys Med Rehabil. 2014;95(5):956–967.
- Hoekstra F, Hoekstra T, van der Schans CP, et al. The implementation of a physical activity counseling program in rehabilitation care: findings from the ReSpAct study. Disabil Rehabil. 2019;17:1–12.
- Lobelo F, Rohm Young D, Sallis R, et al. Routine assessment and promotion of physical activity in healthcare settings: a scientific statement from the American heart association. Circulation. 2018;137(18):e495–e522.
- Martin Ginis KA, Ma JK, Latimer-Cheung AE, et al. A systematic review of review articles addressing factors related to physical activity participation among children and adults with physical disabilities. Health Psychol Rev. 2016;10(4):478–494.
- Rimmer JH, Marques AC. Physical activity for people with disabilities. The Lancet. 2012;380(9838):193–195.
- Obembe AO, Olaogun MM, Olalemi AE. Functional limitations due to fatigue among independently ambulant stroke survivors in osun, south-western nigeria. Physiother Res Int. 2015;20(1):54–59.
- Schillinger A, Becker F. [Fatigue in patients following traumatic brain injury and stroke]. Tidsskr nor Laegeforen. 2015;135(4):331–335.
- Knorr S, Ivanova TD, Doherty TJ, et al. The origins of neuromuscular fatigue post-stroke. Exp Brain Res. 2011;214(2):303–315.
- Lerdal A, Bakken LN, Kouwenhoven SE, et al. Poststroke fatigue-a review. J Pain Symptom Manage. 2009;38(6):928–949.
- Kim I, Hacker E, Ferrans CE, et al. Evaluation of fatigability measurement: integrative review. Geriatr Nurs. 2018;39(1):39–47.
- Mead GE, Graham C, Dorman P, et al. Fatigue after stroke: baseline predictors and influence on survival. Analysis of data from UK patients recruited in the international stroke trial. PLoS One. 2011;6(3):e16988.
- Galligan NG, Hevey D, Coen RF, et al. Clarifying the associations between anxiety, depression and fatigue following stroke. J Health Psychol. 2016;21(12):2863–2871.
- Delva I, Lytvynenko N, Delva M. Factors associated with post-stroke fatigue within the first 3 month after stroke. Georgian Med News. 2017;267:38–42.
- Thilarajah S, Mentiplay BF, Bower KJ, et al. Factors associated with post-stroke physical activity: a systematic review and meta-analysis. Arch Phys Med Rehabil. 2018;99(9):1876–1889.
- Acciarresi M, Bogousslavsky J, Paciaroni M. Post-stroke fatigue: epidemiology, clinical characteristics and treatment. Eur Neurol. 2014;72(5–6):255–261.
- Kluger BM, Krupp LB, Enoka RM. Fatigue and fatigability in neurologic illnesses: proposal for a unified taxonomy. Neurology. 2013;80(4):409–416.
- Enoka RM, Duchateau J. Translating fatigue to human performance. Med Sci Sports Exerc. 2016;48(11):2228–2238.
- Duncan F, Kutlubaev MA, Dennis MS, et al. Fatigue after stroke: a systematic review of associations with impaired physical fitness. Int J Stroke. 2012;7(2):157–162.
- Twisk J. Applied longitudinal data analysis for epidemiology: a practical guide. 2nd ed. New York (NY): Cambridge University Press; 2013.
- Gill JR, Brown CA. A structured review of the evidence for pacing as a chronic pain intervention. Eur J Pain. 2009;13(2):214–216.
- Murphy SL, Lyden AK, Clary M, et al. Activity pacing for osteoarthritis symptom management: study design and methodology of a randomized trial testing a tailored clinical approach using accelerometers for veterans and non-veterans. BMC Musculoskelet Disord. 2011;12(1):177.
- Antcliff D, Keeley P, Campbell M, et al. The development of an activity pacing questionnaire for chronic pain and/or fatigue: a Delphi technique. Physiotherapy. 2013;99(3):241–246.
- Nielson WR, Jensen MP, Hill ML. An activity pacing scale for the chronic pain coping inventory: development in a sample of patients with fibromyalgia syndrome. Pain. 2001;89(2–3):111–115.
- Brown CA. Occupational therapists’ beliefs regarding treatment options for people with chronic pain. Brit J Occup Ther. 2002;65(9):398–404.
- Dick B, Eccleston C, Crombez G. Attentional functioning in fibromyalgia, rheumatoid arthritis, and musculoskeletal pain patients. Arthritis Rheum. 2002;47(6):639–644.
- Murphy SL, Kratz AL. Activity pacing in daily life: a within-day analysis. Pain. 2014;155(12):2630–2637.
- NICE. Chronic fatigue syndrome/myalgic encephalomyelitis (or encephalopathy). London (UK): NICE; 2007.
- Murphy SL, Lyden AK, Smith DM, et al. Effects of a tailored activity pacing intervention on pain and fatigue for adults with osteoarthritis. Am J Occup Ther. 2010;64(6):869–876.
- Abonie US, Sandercock GRH, Heesterbeek M, et al. Effects of activity pacing in patients with chronic conditions associated with fatigue complaints: a meta-analysis. Disabil Rehabil. 2018;18:1–10.
- Hoekstra F, Alingh RA, van der Schans CP, et al. Design of a process evaluation of the implementation of a physical activity and sports stimulation programme in Dutch rehabilitation setting: ReSpAct. Implement Sci. 2014;9:127.
- Alingh RA, Hoekstra F, van der Schans CP, et al. Protocol of a longitudinal cohort study on physical activity behaviour in physically disabled patients participating in a rehabilitation counselling programme: ReSpAct. BMJ Open. 2015;5(1):e007591.
- World Health Organization. World report on disability. Geneva (Switzerland): WHO Press; 2011.
- Lerdal A, Gay CL. Acute-phase fatigue predicts limitations with activities of daily living 18 months after first-ever stroke. J Stroke Cerebrovasc Dis. 2017;26(3):523–531.
- Duncan F, Lewis SJ, Greig CA, et al. Exploratory longitudinal cohort study of associations of fatigue after stroke. Stroke. 2015;46(4):1052–1058.
- Andrews NE, Strong J, Meredith PJ. Activity pacing, avoidance, endurance, and associations with patient functioning in chronic pain: a systematic review and meta-analysis. Arch Phys Med Rehabil. 2012;93(11):2109–2121.
- Butler Moseley D, Lucas N. Explain pain. J Osteopath Med. 2003;6(2):100.
- Nicholas M, Molloy A, Tonkin L, et al. Manage your pain. Sydney (Australia): ABC books; 2006.
- van der Ploeg HP, van der Beek AJ, van der Woude LH, et al. Physical activity for people with a disability: a conceptual model. Sports Med. 2004;34(10):639–649.
- Wendel-Vos GC, Schuit AJ, Saris WH, et al. Reproducibility and relative validity of the short questionnaire to assess health-enhancing physical activity. J Clin Epidemiol. 2003;56(12):1163–1169.
- Wagenmakers R, van den Akker-Scheek I, Groothoff JW, et al. Reliability and validity of the short questionnaire to assess health-enhancing physical activity (SQUASH) in patients after total hip arthroplasty. BMC Musculoskelet Disord. 2008;9(1):141.
- Arends S, Hofman M, Kamsma YP, et al. Daily physical activity in ankylosing spondylitis: validity and reliability of the IPAQ and SQUASH and the relation with clinical assessments. Arthritis Res Ther. 2013;15(4):R99.
- Seves BL, Hoekstra F, Schoenmakers JW, et al. Test-retest reliability and concurrent validity of the adapted short QUestionnaire to ASsess health-enhancing physical activity (adapted-SQUASH) in adults with disabilities; 2020. medRxiv: 2020.09.09.20190371. DOI:https://doi.org/10.1101/2020.09.09.20190371
- Krupp LB, LaRocca NG, Muir-Nash J, et al. The fatigue severity scale. Application to patients with multiple sclerosis and systemic lupus erythematosus. Arch Neurol. 1989;46(10):1121–1123.
- Fleurke A, Goossen W, Hoijtink E, et al. Fatigue severity scale (FSS). 2004. Available from: https://docplayer.nl/17854071-Bron-www-zorginformatiemodel-nl-toestemming-l-mook-status-final-08-06-05.html
- Whitehead L. The measurement of fatigue in chronic illness: a systematic review of unidimensional and multidimensional fatigue measures. J Pain Symptom Manage. 2009;37(1):107–128.
- Elbers RG, Rietberg MB, van Wegen EE, et al. Self-report fatigue questionnaires in multiple sclerosis, Parkinson’s disease and stroke: a systematic review of measurement properties. Qual Life Res. 2012;21(6):925–944.
- Smits BL, Pepping GJ, Hettinga FJ. Pacing and decision making in sport and exercise: the roles of perception and action in the regulation of exercise intensity. Sports Med. 2014;44(6):763–775.
- White PD, Goldsmith KA, Johnson AL, et al. Comparison of adaptive pacing therapy, cognitive behaviour therapy, graded exercise therapy, and specialist medical care for chronic fatigue syndrome (PACE): a randomised trial. Lancet. 2011;377(9768):823–836.
- Goudsmit EM, Nijs J, Jason LA, et al. Pacing as a strategy to improve energy management in myalgic encephalomyelitis/chronic fatigue syndrome: a consensus document. Disabil Rehabil. 2012;34(13):1140–1147.
- Hettinga FJ, Hoekstra F, Kotte EMG, et al. The development of an activity pacing questionnaire to provide tailored advice on engagement in an active lifestyle and sports for persons with a disability or chronic disease. Not submitted.
- Feeny D, Farris K, Cote I, et al. A cohort study found the RAND-12 and health utilities index mark 3 demonstrated construct validity in high-risk primary care patients. J Clin Epidemiol. 2005;58(2):138–141.
- Hays RD, Sherbourne CD, Mazel RM. The RAND 36-item health survey 1.0. Health Econ. 1993;2(3):217–227.
- Hays RD, Morales LS. The RAND-36 measure of health-related quality of life. Ann Med. 2001;33(5):350–357.
- VanderZee KI, Sanderman R, Heyink JW, et al. Psychometric qualities of the RAND 36-item health survey 1.0: a multidimensional measure of general health status. Int J Behav Med. 1996;3(2):104–122.
- Markland D, Tobin V. A modification to the behavioural regulation in exercise questionnaire to include an assessment of amotivation. J Sport Exerc Psychol. 2004;26(2):191–196.
- Marcus BH, Selby VC, Niaura RS, et al. Self-efficacy and the stages of exercise behavior change. Res Q Exerc Sport. 1992;63(1):60–66.
- Jung T, Wickrama KAS. An introduction to latent class growth analysis and growth mixture modeling. Social Pers Psych Compass. 2008;2(1):302–317.
- van de Schoot R, Sijbrandij M, Winter SD, et al. The GRoLTS-checklist: guidelines for reporting on latent trajectory studies. Struct Eq Model: Multidiscipl J. 2017;24(3):451–467.
- Hoekstra T. Applied latent class models for epidemiology [dissertation]. Amsterdam (The Netherlands): VU University; 2013.
- Raftery AE. Bayesian model selection in social research. Sociol Methodol. 1995;25:111.
- Ramaswamy V, Desarbo WS, Reibstein DJ, et al. An empirical pooling approach for estimating marketing mix elasticities with PIMS data. Marketing Sci. 1993;12(1):103–124.
- Carragher N, Adamson G, Bunting B, et al. Subtypes of depression in a nationally representative sample. J Affect Disord. 2009;113(1–2):88–99.
- Peugh JL, Enders CK. Using the SPSS mixed procedure to fit cross-sectional and longitudinal multilevel models. Educ Psychol Measurement. 2005;65(5):717–741.
- Oncü J, Başoğlu F, Kuran B. A comparison of impact of fatigue on cognitive, physical, and psychosocial status in patients with fibromyalgia and rheumatoid arthritis. Rheumatol Int. 2013;33(12):3031–3037.
- Chen K, Marsh EB. Chronic post-stroke fatigue: it may no longer be about the stroke itself. Clin Neurol Neurosurg. 2018;174:192–197.
- Feigin VL, Barker-Collo S, Parag V, et al. Prevalence and predictors of 6-month fatigue in patients with ischemic stroke: a population-based stroke incidence study in Auckland, New Zealand, 2002-2003. Stroke. 2012;43(10):2604–2609.
- Hoeksma JB, Kelderman H. On growth curves and mixture models. Inf Child Develop. 2006;15(6):627–634.
- Bauer DJ, Curran PJ. Distributional assumptions of growth mixture models: implications for overextraction of latent trajectory classes. Psychol Methods. 2003;8(3):338–363.
- Nagin DS, Tremblay RE. Analyzing developmental trajectories of distinct but related behaviors: a group-based method. Psychol Meth. 2001;6(1):18–34.
- Connell AM, Frye AA. Response to commentaries on target paper, ‘Growth mixture modeling’ in developmental psychology. Inf Child Develop. 2006;15(6):639–642.
- Stanger C. Latent growth mixture models: an important new tool for developmental researchers. Inf Child Develop. 2006;15(6):635–637.
- Nelson MLA, McKellar KA, Yi J, et al. Stroke rehabilitation evidence and comorbidity: a systematic scoping review of randomized controlled trials. Top Stroke Rehabil. 2017;24(5):374–380.
- Cuperus N, Hoogeboom TJ, Neijland Y, et al. Are people with rheumatoid arthritis who undertake activity pacing at risk of being too physically inactive? Clin Rehabil. 2012;26(11):1048–1052.
- Murphy SL, Smith DM, Lyden AK. Type of activity pacing instruction affects physical activity variability in adults with symptomatic knee or hip osteoarthritis. J Phys Act Health. 2012;9(3):360–366.
- Murphy SL, Smith DM, Alexander NB. Measuring activity pacing in women with lower-extremity osteoarthritis: a pilot study. Am J Occup Ther. 2008;62(3):329–334.