
Abstract
Purpose
To perform a cross-cultural adaptation of the mGES into Dutch and investigate its construct validity, internal consistency, test-retest reliability and floor and ceiling effects in a large cohort of community-dwelling older adults.
Materials and methods
We translated the British version of the mGES into Dutch, back into English, and had a native English speaker review the final version. Next, we included 223 community-dwelling older adults from the ‘Veilig in Beweging Blijven’ (VIBE) cohort (69.8 [67.6–74.3] years old, 155 (69.5%) female), who filled out both the mGES and the Falls Efficacy Scale-International (FES-I) twice, with a month in between. Construct validity was assessed by Spearman’s correlation between the scores on the mGES and the FES-I. Internal consistency was assessed with Cronbach’s alpha and test-retest reliability was assessed with the intra class correlation coefficient (ICC(2,1)).
Results
Construct validity (rho = −0.81, p < 0.001), internal consistency (α = 0.95), and test-retest reliability (ICC(2,1)=0.90, 95%CI = [0.87–0.92]) were all excellent. Ceiling effect was observed in 44 (19.7%) participants which suggest caution when evaluating the mGES for fit and confident older adults.
Conclusion
The Dutch mGES is a valid and reliable tool to assess confidence in walking and is suggested as a tool for evaluating self-efficacy after interventions aimed at improving gait.
Assessment and rehabilitation of gait may be affected by self-efficacy of walking performance.
We show that the Dutch translation of the modified gait efficacy scale is a valid and reliable tool for assessing self-efficacy of walking.
A ceiling effect was observed that was associated with muscle strength and symptoms of depression.
The results of the present study underline the use of the modified gait efficacy scale in the assessment and evaluation of self-efficacy of walking in rehabilitation.
IMPLICATIONS FOR REHABILITATION
Introduction
Older adults may become less physically active and be at risk of falling when they lose confidence in their ability to walk safely [Citation1]. Interventions that improve confidence in walking may help to reduce these risks [Citation2,Citation3]. To identify older adults that could benefit from such an intervention, or to evaluate intervention effects, a valid and reliable tool that assesses confidence in walking is required. Questionnaires such as the Falls Efficacy Scale International (FES-I), the Activities Specific Balance scale (ABC) and the Survey of Activities and Fear of Falling in the Elderly (SAFFE) aim to assess self-efficacy or fear of falling regarding several physical abilities related to balance and falling in older adults [Citation4–6]. However, they are not specifically aimed at walking abilities, while most falls in older adults occur during walking [Citation7,Citation8].
Self-efficacy and fear of falling can be considered as two different, but related, concepts. Self-efficacy is the believe a person has in being able to perform a certain task successfully [Citation9]. Hence it is a task specific evaluation of personal belief in one’s (physical) ability. For simplicity, we consider confidence to be identical to self-efficacy. Fear of falling is a response triggered by both feeling insecure about personal ability to perform a certain task and the consequence of failing at a certain task [Citation10]. Hence, fear of falling also involves a consideration of the consequence of failure, whereas this is not necessarily implied in self-efficacy. However, the two concepts are related as high fear of falling is present more often in individuals with low self-efficacy than in individuals with high self-efficacy [Citation11].
In recent studies, quantity and quality of walking have been assessed in lab situations and daily life using inertial measurement units, and were found directly linked to falling [Citation12–15]. Yet, causal pathways between quantity and quality of walking and falling are not sufficiently clear and additional information is necessary to arrive at effective interventions or to improve existing ones. Self-efficacy can limit the effectiveness of such interventions. To develop and improve such interventions it is important to evaluate self-efficacy in the physical attribute that the intervention aims to improve. Thus, an intervention that aims to improve gait can best be evaluated with an instrument that assesses self-perceived gait efficacy. Given that detailed gait assessments become more easy to implement in research as well as clinical practice, we believe there is a need for a self-efficacy instrument that focusses specifically on gait.
The modified Gait Efficacy Scale (mGES) records answers to statements of expectancy about one’s ability to safely perform walking tasks in different scenarios. This questionnaire has been used to assess self-perceived gait efficacy and to associate its scores with physical activity and gait performance [Citation16–18]. The validity and reliability of the mGES were found to be excellent in a population of British older adults, though a ceiling effect indicated that some people might not find the depicted scenarios challenging [Citation17]. In the present study, we performed a cross-cultural adaptation of the mGES into Dutch and investigated its construct validity, internal consistency, test-retest reliability and floor and ceiling effects in a large cohort of community-dwelling older adults.
Methods
Study population
We analysed data of 284 community-dwelling adults of over 65 years old, who were recruited in Amsterdam (The Netherlands) and the surrounding area as part of the longitudinal observational study ‘Veilig in beweging blijven’ (VIBE study). Participants were excluded if they were unable to walk 20 meters with or without walking-aids, or if they were able to walk 20 meters but while doing so experienced shortness of breath, became dizzy, or perceived pain in or pressure on the chest. Furthermore, they were excluded if they were unable to speak, read, and write Dutch and when their Mini Mental State Examination (MMSE) [Citation19] score was equal to or lower than 18. The protocol was approved by the ethics committee of the Faculty of Behavioural and Movement Sciences of the Vrije Universiteit Amsterdam (VCWE-2016-129) and all participants signed an informed-consent form.
Protocol
At baseline and again one month later, participants independently filled out, at home, a set of questionnaires, including the mGES and the FES-I. At baseline, they also filled out the Geriatric Depression Scale (GDS-15), an instrument to measure depression symptoms on a scale from 0 to 15 [Citation20]. The baseline questionnaires were filled out on paper, while at one-month follow-up participants had the option to fill out the questionnaires on paper or electronically.
The mGES questionnaire
The mGES is a self-report questionnaire measuring a person’s confidence to safely perform walking related tasks (see Supplementary Material A) [Citation17]. It contains 10 questions, which are answered on a scale from 1, no confidence, to 10, complete confidence. Construct validity and excellent reliability (ICC(2,1) = 0.93) and internal consistency (α = 0.94) were shown in a British population, although there was a ceiling effect of 7.8% [Citation17].
Translation of the British mGES to Dutch
We translated the British version of the mGES [Citation17] to Dutch according to the methods described by Beaton, Bombardier [Citation21], with the exception of stages four and five. During stage one, two native Dutch translators translated the questionnaire from English to Dutch. In stages two and three, the two translations were combined and then translated back to English. Beaton and colleagues’ stage four requires an expert committee to review the product of stage three [Citation21]. This expert committee should consist of a methodologist, health professionals,language professionals, and the translators [Citation21]. As an alternative to stage four, we had a panel, consisting of two of the authors, one who was also a translator, and an independent reviewer who was a medical doctor, reviewing the combined version of stages one to three. Stage five of Beaton’s guidelines suggests to submit the questionnaire to a small group of subjects and interview them afterwards to confirm that the interpretation of the individual questions remained consistent with the original questionnaire. We did not perform stage five. Finally, a native English speaker did the final review after we applied the changes suggested by the panel and we applied his comments to create the final version.
The FES-I questionnaire
The FES-I is a self-report questionnaire measuring the amount of concern for falling during everyday activities [Citation4]. It contains 16 questions, which can be answered on a scale from 1, not concerned, to 4, very concerned. The Dutch translation is a valid instrument with excellent internal consistency (α = 0.96) and test-retest reliability (icc = 0.96) [Citation4,Citation22]. Similar as for the mGES, we instructed participants to fill out the FES-I at home.
Statistical analysis
Statistical analyses were performed in R (R Core Team (2015), Vienna, Austria). Participants were excluded if they had one or more missing values for the mGES, more than four missing values for the FES-I, or had fallen in between baseline and one-month follow-up. We also excluded participants whose mGES score differed between baseline and follow-up by more than 40 points (arbitrarily chosen), as some participants appeared to have interpreted the scales the wrong way around, answering 1 to nearly all questions where they had answered 10 a month earlier. Results including these participants can be found in Supplementary Material A. Missing values in the FES-I were substituted with averages when at least 12 of the 16 questions were filled out [Citation23].
Descriptive statistics were used to describe the population. Normality of data distribution was visually inspected. Mean and standard deviation were used in normally distributed measures. Median and interquartile ranges (IQR) were used in non-normally distributed measures. Total number and percentage were used for binomial and multinomial measures.
Ceiling and floor effects were defined as the number of participants that scored the maximum or minimum value on a scale, respectively. We considered a percentage of 15% or more to be an indication of poor questionnaire performance [Citation24]. Furthermore, post hoc, we performed a stepwise backwards logistic regression analysis to find out what participant characteristics are associated with ceiling effects on the mGES. The outcome value was having reached the maximum value on the mGES at baseline, the predictors were age, gender, GDS score, body height, body mass, fall history, HGF, education and having filled out the questionnaire electronically during follow-up.
Construct validity of the mGES was assessed by determining Spearman’s correlation coefficient between the mGES scores and the FES-I scores at baseline. The FES-I contains items relating to self-efficacy in a domain closely related to walking safety but asks subjects for their concern for falling, whereas the mGES asks for confidence. Therefore, we classified a rho above −0.20 as very weak, −0.20 to −0.39 as weak, −0.40 to −0.59 as moderate, −0.60 to −0.79 as strong and −0.80 and below as excellent evidence for the construct validity of the mGES [Citation25].
Internal consistency was assessed by determining Cronbach’s Alpha at baseline. Alpha values between 0.70 and 0.90 are considered excellent, whereas values < 0.70 indicate inconsistency and values > 0.90 indicate redundancy of questionnaire items [Citation26].
Test-retest reliability was assessed by estimating ICC and upper and lower Limits of Agreement (LoA) using R package ‘irr’ version 0.84 [Citation27] based on a single-rating (k = 1), absolute-agreement, 2-way mixed-effects model between baseline and follow-up. An absolute agreement model, instead of a consistency model, was chosen because in an absolute agreement model a systematic difference between ratings is penalized, while in a consistency model it is not. We considered ICC estimates below 0.4 as poor, between 0.4 and 0.59 as moderate, between 0.6 and 0.79 as strong and above 0.8 as excellent [Citation28].
Measurement error was quantified by the Standard Error of Measurement (SEM) which was determined from the square root of the summation of the between day and residual variance components from an ANOVA [Citation26,Citation29]. Furthermore, we determined the smallest detectable change (SDC), also referred to as the minimal difference needed to be considered real, by multiplying the SEM by 1.96 and the square root of 2 [Citation29].
Results
Of the 284 community-dwelling older adults, we included a total of 223 participants. We excluded 27 participants for not filling out sufficient numbers of items of either or both of the questionnaires at baseline or follow-up. Another 24 participants were excluded, because they had fallen between baseline and follow-up, which may have affected their confidence. Finally, ten participants were excluded because their baseline and follow-up mGES scores differed by more than 40 points, indicating that they had misinterpreted the questionnaire either, but not both, at baseline or at follow-up. Sensitivity analysis including these ten participants can be found in Supplementary Material A. shows the descriptive statistics of the remaining 223 participants.
Table 1. Participant characteristics.
The mGES showed a ceiling effect (19.7% of participants at ceiling) and the FES-I showed a similar floor effect (17.0% of participants at floor). A stepwise backwards logistic regression model revealed four participant characteristics to be associated with the ceiling effect of the mGES: GDS score (OR = 0.97, 95% CI [0.95–1.00], p = 0.047), body mass (OR = 0.99, 95% CI [0.99–1.00], p = 0.005), HGF (OR = 1.01, 95% CI [1.01–1.01], p < 0.001) and having filled out the questionnaire electronically during follow-up (OR = 1.12, 95% CI [1.01–1.24], p = 0.040). The explained variance of this model was poor (r-squared = 0.16).
summarizes the construct validity and reliability results for the mGES, which are explained in more detail in the following sections.
Table 2. Construct validity and reliability of the mGES.
Construct validity
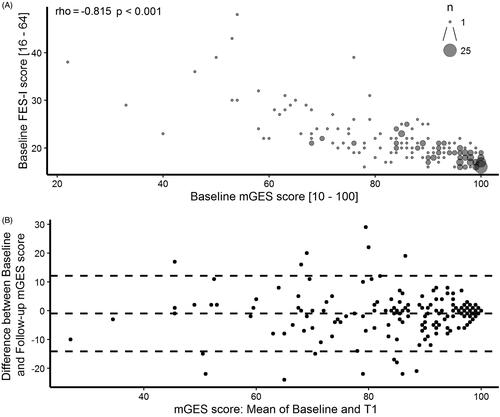
Construct validity was assessed by determining the correlation between the mGES and the FES-I. shows that the two questionnaires had an excellent correlation (rho = −0.82, p < 0.001), although there seems to be less consistency for low mGES and high FES-I scores as can be observed from the wider spread of scores in those ranges.
Figure 1. (A) Scatter plot of the mGES and FES-I. The size of the dots represents the number of participants (n). (B) Bland-Altman plot showing the difference between baseline and follow-up mGES scores (baseline minus follow-up scores) as a function of the mean of baseline and follow-up scores. The centre dotted line represents the mean difference in mGES score between the two assessments. The outer dotted lines represent the upper and lower LoA.
Internal consistency and test re-test reliability
Internal consistency for the ten items of the mGES was high (α = 0.95), indicating that some questions may be redundant. We also examined test re-test reliability, by determining the agreement of mGES scores at baseline with scores at follow-up. We found that the mGES questionnaire had excellent reliability when measured twice, with a period of one month in between measurements (ICC(2,1) = 0.90, 95% CI = [0.87–0.92]). The SEM was 4.7, the lower and upper LoA were −13.7 and 11.9, respectively, and the SDC was 13.0. shows a Bland-Altman plot of the mGES scores. Differences between assessments seem to be equally present for people with high or low mGES scores.
Discussion
In this study, we assessed the construct validity, internal consistency and test re-test reliability of the Dutch translation of the mGES in a Dutch population of older adults and found these to be excellent, although the high internal consistency indicated that some items may be redundant. Furthermore, a relatively large ceiling effect was found, indicating that care should be taken when using the scale in physically fit older adults without symptoms of depression.
Compared to the original validation study of the mGES by Newell and colleagues (2012), our translated version of the mGES showed similar values for internal consistency, test-retest reliability, SEM and limits of agreement and was similarly associated with scores on a questionnaire for falls efficacy. An important difference between the two studies was reflected in the participant characteristics, suggesting that our population was less heterogeneous than theirs. Furthermore, their results may have been less influenced by ceiling effects, as only 7.8% of their participants scored the maximum value on the mGES versus 19.7% in our population whereas a cut-off of 15% is commonly used to determine if the ceiling effect has a negative impact on the questionnaire performance [Citation24]. To identify characteristics of participants who had scored the maximum value on the mGES, indicating complete confidence in their ability to safely perform gait related activities, we performed a stepwise backwards logistic regression analysis. The explained variance of this model was poor (r-squared = 0.16). Still, we advise not to use the mGES in a population of physically fit older adults without symptoms of depression, to avoid ceiling effects.
As stated above, some items of the mGES may have been redundant as indicated by the high internal consistency. The original version of the mGES reported a similar Cronbach’s alpha and tested whether exclusion of items would change the consistency of the questionnaire, which it did not [Citation17]. In order to keep the British and Dutch versions as comparable as possible we do not recommend excluding questions from the Dutch version of the mGES.
Unlike the study of Newell and colleagues, we asked participants to fill out the questionnaire independently. We found that this approach worked well with most participants, although ten participants, who were excluded from the analyses (see Supplementary Material A for results including these 10 participants), had large differences between their baseline mGES score and their follow-up score. These participants did not show a similar change in FES-I score. As such, we belief that they had filled out the mGES questionnaire incorrectly, indicating low scores (no confidence) when they had meant to indicate high scores (complete confidence). It is possible that participants did not read the instructions properly, or it may be that the instructions were not clear enough. Nine out of these ten participants filled out the mGES electronically during follow-up. The major difference between the paper and electronical version of the mGES was that in the electronic version the labels “no confidence” and “complete confidence” were only shown at the top of the questionnaire. The scale on which the participant had to indicate their level of confidence only showed the number from one to ten. When asking older adults to fill-out this questionnaire independently, we advise to provide clear and concise instructions and to always add the labels “no confidence” and “complete confidence” to the scale for each individual item. The visual appearance of the scale may also benefit from a different format, for instance by adding pictograms or by increasing the font size of the classifications ‘no confidence’ and ‘complete confidence’ that accompany the numbered scale and placing them at the same height as the scale instead of placing them underneath it (Supplementary Material B). The majority of participants, however, did not appear to have problems with filling-out the questionnaire and very few left items unanswered.
We also observed that FES-I scores of participants with a low mGES scores were less consistent than those of participants with high mGES scores, although this was not statistically tested. It may reflect the notion that efficacy is task specific and task-related differences may be most apparent in people who are concerned or not confident [Citation9]. Compared to the items of the mGES, the items in the FES-I have a wider range of proposed scenarios, ranging from walking related activities to balancing related activities such as getting (un)dressed. It is therefore conceivable that older adults who are not confident in their walking ability are still confident in other, i.e., balancing, activities, or vice versa.
We believe that the one-month interval between the baseline and follow-up measurement should prevent recall bias as much as possible while at the same time ensuring that a person’s gait efficacy remained stable, such that test-retest reliability could be adequately tested. Considering that we found relatively high test-retest reliability (ICC(2,1) = 0.90) we do not believe that our conclusions would be altered by a shorter time interval between assessments. However, the interval was arbitrarily chosen and it is possible that recall bias may have inflated test-retest reliability.
The strengths of our study are its sample size and the thorough translation process involving a committee consisting of individuals from multiple disciplines. Some limitations have already been discussed; namely, that we did not submit the translated questionnaire to a small group to confirm that the interpretation by the participants was the same as the original British version, that the length of the follow-up period was arbitrarily chosen and that there was a strong ceiling effect in our population. Another limitation may be that in neither our study nor in the study by Newell and colleagues (2012) a factor analysis was performed and hence structural validity has not been tested. Furthermore, we deliberately did not relate the results of the mGES to actual gait performance as a means of construct validity. Previous literature has shown that self-perceived performance may not be a consistent representation of older people’s actual performance [Citation22]. Hence, we deem testing the construct validity of a self-efficacy scale by its relation to actual performance not suitable. Nevertheless, future research should focus on whether and how this questionnaire can be used for goal-setting to meet one’s actual gait ability during rehabilitation and how responsive the questionnaire is in clinical populations.
Conclusion
We conclude that the Dutch translation of the mGES is a valid and reliable tool for assessing self-perceived gait efficacy in community-dwelling older adults.
Supplementary Material B
Download PDF (192.2 KB)Suplementary Material A
Download MS Word (3.9 MB)Acknowledgments
We thank Mark Melman and Martine Rog who helped during data collection. We also thank Eli Brenner, Axel Koopman and Naomi Weijer-Schouten for their contribution to the translation process. This research was funded by a VIDI grant [no. 91714344] from the Dutch Organization for Scientific Research (NWO). The mGES has been translated and reprinted by permission of Oxford University Press on behalf of APTA. OUP and APTA are not responsible or in any way liable for the accuracy of the translation. The translators are solely responsible for the translation in this publication.
Disclosure statement
No potential conflict of interest was reported by the author(s).
Data availability statement
Data will be made available on request.
Additional information
Funding
Related Research Data
References
- Painter JA, Allison L, Dhingra P, et al. Fear of falling and its relationship with anxiety, depression, and activity engagement among community-dwelling older adults. Am J Occup Ther. 2012;66(2):169–176.
- Wetherell JL, Bower ES, Johnson K, et al. Integrated exposure therapy and exercise reduces fear of falling and avoidance in older adults: a randomized pilot study. Am J Geriatr Psychiatry. 2018;26(8):849–859.
- Sartor-Glittenberg C, Bordenave E, Bay C, et al. Effect of a matter of balance programme on avoidance behaviour due to fear of falling in older adults. Psychogeriatrics. 2018;18(3):224–230.
- Yardley L, Beyer N, Hauer K, et al. Development and initial validation of the Falls Efficacy Scale-International (FES-I). Age Ageing. 2005;34(6):614–619.
- Powell LE, Myers AM. The Activities-specific Balance Confidence (ABC) Scale. J Gerontol A Biol Sci Med Sci. 1995;50A(1):M28–M34.
- Lachman ME, Howland J, Tennstedt S, et al. Fear of falling and activity restriction: the survey of activities and fear of falling in the elderly (SAFE). J Gerontol B Psychol Sci Soc Sci. 1998;53(1):P43–P50.
- Berg WP, Alessio HM, Mills EM, et al. Circumstances and consequences of falls in independent community-dwelling older adults. Age Ageing. 1997;26(4):261–268.
- Robinovitch SN, Feldman F, Yang Y, et al. Video capture of the circumstances of falls in elderly people residing in long-term care: an observational study. Lancet. 2013;381(9860):47–54.
- Bandura A. Self-efficacy: toward a unifying theory of behavioral change. Psychol Rev. 1977;84(2):191–215.
- Legters K. Fear of falling. Phys Ther. 2002;82(3):264–272.
- Fuzhong L, McAuley E, Fisher KJ, et al. Self-efficacy as a mediator between fear of falling and functional ability in the elderly. J Aging Health. 2002;14(4):452–466.
- Rispens SM, Van Dieen JH, Van Schooten KS, et al. Fall-related gait characteristics on the treadmill and in daily life. J Neuro Engineering Rehabil. 2016;13(1):12.
- van Schooten KS, Rispens SM, Elders PJ, et al. Toward ambulatory balance assessment: estimating variability and stability from short bouts of gait. Gait Posture. 2014;39(2):695–699.
- Ihlen EA, Weiss A, Bourke A, et al. The complexity of daily life walking in older adult community-dwelling fallers and non-fallers. J Biomech. 2016;49(9):1420–1428.
- Bruijn SM, Meijer OG, Beek PJ, et al. Assessing the stability of human locomotion: a review of current measures. J R Soc Interface. 2013;10(83):20120999.
- Rosengren KS, McAuley E, Mihalko SL. Gait adjustments in older adults: activity and efficacy influences. Psychol Aging. 1998;13(3):375–386.
- Newell AM, VanSwearingen JM, Hile E, et al. The modified Gait Efficacy Scale: establishing the psychometric properties in older adults. Phys Ther. 2012;92(2):318–328.
- Julius LM, Brach JS, Wert DM, et al. Perceived effort of walking: relationship with gait, physical function and activity, fear of falling, and confidence in walking in older adults with mobility limitations. Physical Therapy. 2012;92(10):1268–1277.
- Folstein MF, Folstein SE, McHugh PR. Mini-mental state. A practical method for grading the cognitive state of patients for the clinician. J Psychiatr Res. 1975;12(3):189–198.
- Sheikh JI, Yesavage JA. Geriatric Depression Scale (GDS) recent evidence and development of a shorter version. Clin Gerontol. 1986;5(1-2):165–173.
- Beaton DE, Bombardier C, Guillemin F, et al. Guidelines for the process of cross-cultural adaptation of self-report measures. Spine (Phila Pa 1976). 2000;25(24):3186–3191.
- Delbaere K, Close JC, Mikolaizak AS, et al. The Falls Efficacy Scale International (FES-I). A comprehensive longitudinal validation study. Age Ageing. 2010;39(2):210–216.
- Healthy Ageing Research Group. FES-I | Falls Efficacy Scale - International The University of Manchester: Healthy Ageing Research Group, Division of Nursing, Midwifery & Social Work, The University of Manchester; 2019 [cited 2019 Mar 4]. Available from: https://sites.manchester.ac.uk/fes-i/
- McHorney CA, Tarlov AR. Individual-patient monitoring in clinical practice: are available health status surveys adequate? Qual Life Res. 1995;4(4):293–307.
- Evans JD. Straightforward statistics for the behavioral sciences. Pacific Grove: Brooks/Cole Pub. Co; 1996. English
- Vet Hcw D, Terwee CB, Mokkink LB, et al. Measurement in medicine: a practical guide. Cambridge (UK): Cambridge University Press; 2011. (Practical Guides to Biostatistics and Epidemiology).
- Gamer M, Lemon J, Singh IFP. irr: various coefficients of interrater reliability and agreement. 2012. Available from: http://CRAN.R-project.org/package=irr
- Kottner J, Audige L, Brorson S, et al. Guidelines for Reporting Reliability and Agreement Studies (GRRAS) were proposed. J Clin Epidemiol. 2011;64(1):96–106.
- Weir JP. Quantifying test-retest reliability using the intraclass correlation coefficient and the SEM. J Strength Cond Res. 2005;19(1):231–240.