
Abstract
Purpose
Visual perceptual deficits are frequently underdiagnosed in stroke survivors compared to sensory vision deficits or visual neglect. To better understand this imparity, we evaluated current practice for screening post-stroke visual perceptual deficits.
Methods
We conducted a survey targeted at professionals working with stroke survivors involved in screening visual perceptual deficits across the United Kingdom and the Republic of Ireland.
Results
Forty orthoptists and 174 occupational therapists responded to the survey. Visual perceptual deficit screening was primarily conducted by occupational therapists (94%), with 75∼100% of stroke survivors screened per month. Respondents lacked consensus on whether several common post-stroke visual deficits were perceptual or not. During the screening, respondents primarily relied on self-reports and observation (94%), while assessment batteries (58%) and screening tools were underutilised (56%) and selected inappropriately (66%). Respondents reported lack of training in visual perception screening (20%) and physical/cognitive condition of stroke survivors (19%) as extremely challenging during screening.
Conclusions
Visual perceptual deficits are screened post-stroke at a similar rate to sensory vision or visual neglect. Underdiagnosis of visual perceptual deficits may stem from both reliance on subjective and non-standardised screening approaches, and conflicting definitions of visual perception held among clinicians. We recommend increased training provision and use of brief performance-based screening tools.
Lack of agreement among clinicians on what constitutes as visual perceptual or sensory vision deficits may prove problematic, as precise and exact language is often required for clinical decision-making (e.g., referrals).
Biases for more familiar visual (perceptual) deficits held among clinicians during the screening process may lead to other visual deficits being missed.
To avoid problems being missed, clinicians should aim to use standardised assessments rather than stroke survivor self-report and observations of function when screening for visual perceptual difficulties.
IMPLICATIONS FOR REHABILITATION
Introduction
Stroke is one of the most commonly occurring neurological diseases in the world, resulting in deleterious consequences for its survivors [Citation1–3]. Among the most significant of these consequences is impairment in sensory vision and visual perception [Citation4,Citation5]. Sensory vision refers to the initial processes within the visual pathway (known also as the afferent and efferent visual pathway), underpinned by light refraction by the cornea and lens followed by light transduction through the optic nerve to produce visual images [Citation6,Citation7]. Visual perception occurs further along the optic pathway, entailing cognitive processes which interpret and assign meaning to what is visually available [Citation8]. Both sensory vision and visual perception are cardinal to daily living and can be adversely impacted by stroke [Citation9].
Deficits of sensory vision following stroke typically include reduced visual acuity and fields (afferent visual pathway), as well as impairment in ocular movement and control of the pupil (efferent visual pathway). Moreover, post-stroke deficits in visual perception include impaired visual memory, visuospatial disturbances and agnosia (i.e., inability to recognise shapes, objects, and people), among others [Citation8]. Visual neglect is frequently diagnosed as a deficit of visual perception following stroke [Citation10], though it is defined by neuropsychologists as an attentional processing deficit [Citation11].
Screening sensory vision and visual perceptual deficits in stroke survivors is primarily carried out by orthoptists and occupational therapists [Citation12,Citation13]. An epidemiological study by Rowe et al. [Citation9] indicated 52–70% of stroke survivors present with sensory vision deficits, while on average 76% present with visual perceptual deficits. The study systematically assessed a consecutive sample of stroke survivors in a rehabilitation unit. They observed a higher percentage of perceptual problems in dysphasic stroke survivors (∼100%) compared to non-dysphasic stroke survivors (∼50%), though none of the subtests requires expressive language. Most impairments were found on the inattention subtests (76 ∼ 90%). The percentage of stroke survivors failing on other subtests (e.g., body image, picture matching, colour matching, sequencing pictures, size recognition, and figure-ground) ranged between 15% (object matching) and 85% (cube copying) [Citation14]. A previous observation cohort study found more than half of stroke survivors referred for suspected visual difficulties have a combination of two or more sensory vision and/or visual perceptual deficits (low vision, eye movement deficits, visual field impairment, or perceptual deficit) [Citation15]. It is unclear, however, how many of these cases could be attributed to co-existing ocular diseases or pre-existing low vision. Both sensory vision and visual perceptual deficits have been shown to be associated with negative outcomes in mental wellbeing [Citation16–18], trips and falls [Citation19], quality of life [Citation4,Citation20], and functional recovery in stroke rehabilitation. Previous work indicates outcomes were more positive in clinical cases where the visual deficit was diagnosed and appropriate management strategies were used, such as retraining approaches intended to promote visuomotor neuroplasticity [Citation21–24]. Existing tools such as the National Institute of Health Stroke Scale (NIHSS) [Citation25] are problematic for detecting visual difficulties owing to the self-report and observational properties of these tools; the NIHSS, in particular, has been shown to lack sensitivity in the detection of a range of deficits in sensory vision, visual perception, and visual neglect [Citation26,Citation27].
Despite the importance of visual perception in stroke rehabilitation, its deficits are often clinically overlooked compared with sensory vision or other difficulties (e.g., in memory or attentional functioning) [Citation12,Citation15,Citation28]. There is importance in unpicking what contributes to this lack of parity, as any consequential underdiagnosis may impact the quality of stroke aftercare [Citation21,Citation29]. Central to investigating this is elucidating current screening practices for both sensory vision and visual perceptual deficits following stroke, focusing particularly on clinical attitudes and experiences of these practices. An explorative qualitative investigation into this topic was undertaken by Vancleef et al. [Citation12], which consisted of semi-structured interviews with 12 occupational therapists and 13 orthoptists practising in the UK. The interviews were designed to understand the current practice of visual perception screening in stroke, as well as understanding potential facilitators and barriers to this practice. Thematic analyses of interview transcripts revealed several key findings; first, there was a lack of consensus on what constitutes visual perceptual deficits (relative to other domains, such as sensory vision) among clinicians actively involved in screening these difficulties following stroke (Observation 1). Also observed was a lack of uniformity in current practice for screening visual perceptual deficits, and a reliance on diverging and/or non-standardised information gathering practices (e.g., medical notes, information from family, etc.) (Observation 2). Finally, there were several challenges to current practice (e.g., lack of training, reduced clinical contact time, and staff shortages) as well as facilitators which would enable clinicians to improve their practice (e.g., a standardised screening tool appropriate for impaired communication) (Observation 3). Taken together, these findings suggest several key shortcomings and potential opportunities for improving current practice in screening for visual perception in stroke survivors. However, the aforementioned study is limited by its low generalisability to current practice in the UK and Republic of Ireland (RoI) owing to small sample size (n = 25) and qualitative-based methodology.
The aim of the current study was to build on the qualitative work of Vancleef et al. [Citation12], attempting to evaluate their thematic findings via quantitative-based methods. We hypothesised that the key findings of Vancleef et al. [Citation12] (Observations 1–3) would be observable across a large sample of occupational therapists and orthoptists. To test these hypotheses, we undertook a large-scale service evaluation consisting of survey data from occupational therapists and orthoptists currently involved in screening for visual perception difficulties in stroke services (hyperacute, acute and rehabilitation) across the UK & RoI.
Materials and methods
Participants
Study inclusion criteria required that participants are currently involved in visual perceptual assessments of stroke survivors in a clinical capacity. Data were collected anonymously using the JISC Online Surveys® platform. Participants were informed about the purpose of the research, voluntary participation, right to withdrawal, and the procedures in place to ensure anonymity. All respondents consented before taking part in the survey. Respondents who did not consent to the study or meet inclusion criteria were routed out of the platform. The study was assessed and approved by the Patient Safety Assurance & Audit Service at NHS North Bristol Trust as a Clinical Effectiveness study (CE45999). The survey was open between July and December 2019 for 21 weeks.
Recruitment was targeted at occupational therapists and orthoptists, but the survey was open to all clinical staff involved in visual perception assessment after stroke. The survey was shared through professional bodies of occupational therapists (Royal College of Occupational Therapists; Association of Occupational Therapists of Ireland) and orthoptists (British and Irish Orthoptic Society) via mailing lists, newsletters, Facebook pages, and Twitter accounts, as well as personal Twitter accounts. Additionally, we contacted stroke units directly using stratified randomisation, where the RoI and countries within the UK (i.e., England, Northern Ireland, Wales, and Scotland) served as strata. 286 hospitals/services providing stroke care were identified from national audit databases (Sentinel Stroke National Audit Programme [Citation30]; Scottish Stroke Improvement Programme [Citation31]; Irish Heart Foundation [Citation32]). A pure randomisation algorithm selected hospitals/services within each stratum. 15–20 selected hospitals/services were contacted weekly by phone. The research objectives were explained to clinicians if available; if interest in participation was expressed, a follow-up email with the survey URL was sent to the provided email address.
Survey design
The results of recent qualitative work [Citation12], based on semi-structured interviewing of occupational therapists and orthoptists, included hypotheses on the current practice, challenges and barriers to visual perception screening. These hypotheses were translated to a survey-based methodology (see for some examples; the complete questionnaire is provided in the Supplementary materials as Supplementary Item S1). The core constructs “understanding of sensory vision/visual perception”; “current practice”; “barriers to practice”; “facilitators to practice” were explored. Prefabricated responses to survey items were derived from commonly occurring themes emerging from responses from clinicians in interviews.
Table 1. Survey constructs, example items, and prefabricated responses.
Recommended approaches to minimising both unit and item nonresponse (i.e., response bias introduced when participants do not provide responses to unit/items) were implemented into the survey design process [Citation33–35], including an initial pilot survey and affirming data anonymity in the research brief. An initial paper-based pilot of the survey was validated among a sample of 11 clinicians who provided improvement suggestions, including factual and grammatical inaccuracies in survey text and positional formatting of survey items. Using the provided feedback, an electronic version of the survey was created using the JISC Online Surveys® platform. This version was debugged for technical issues by internal research staff and tested on multiple browsers (Internet Explorer, Google Chrome, and Safari) and computer devices (mobile phones, and desktop/laptop PCs). Debugging allowed us to fix several issues prior to launching the live version, including bugs where item data was inputted incorrectly due to formatting issues.
Prior understanding of visual perception was measured in the first item “Do you consider any of the following to be visual perception functions?” followed by a list of domains of either sensory vision, visual perception, or visual neglect. Items related to sensory vision were visual acuity, visual fields, ocular movement, binocular vision, colour vision. Items related to visual perception were hallucinations, perceptual organisation, motion perception, face perception, object recognition, word blindness, visual memory, visuospatial perception. One of the items on the list was “visual neglect,” which is considered an attentional processing deficit, rather than a visual perceptual deficit. Respondents then rated these domains according to how important screening them in stroke survivors is. This was achieved using a five-point Likert scale: “Not Important,” “Slightly Important,” “Moderately Important,” “Very Important” and “Extremely Important.”
In the following section, respondents were provided with operational definitions of visual perception, visual problems, and visual neglect () to ensure respondents interpreted subsequent questions in a similar way despite variation in prior knowledge. The main body of the survey consisted of items on current practice and clinician experience of screening sensory vision and visual perceptual deficits (e.g., “Which information source do you use while screening visual perception difficulties in a stroke survivor?”, and “How challenging are the following barriers while screening visual perception in stroke survivors?”). Non-identifiable demographic information about respondents was collected at the end of the survey, including years of experience, profession, country of residence, and clinical setting type.
Table 2. Operational definitions of visual problems, visual perception and visual neglect provided to research participants within the survey.
Data analyses
Statistical analyses were carried on survey data using R Software for Windows (Version 3.5.3). Inferential statistics were carried out at the 0.05 alpha level. Missing data were omitted and not imputed.
Results
Participants
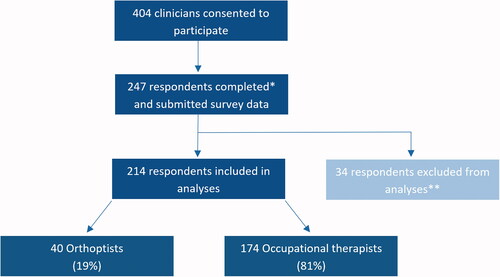
Overall, 404 respondents consented to research participation, and 247 (61%) completed the survey (). There were 19 instances where key parts of the survey were incomplete (e.g., self-identification of clinical profession), meaning these data were excluded from our analysis. In total, data of 214 respondents (174 occupational therapists; 40 orthoptists) were of sufficient quality to be analysed.
Figure 1. Flowchart of participant inclusion and exclusion process. *Survey completions include instances where respondents reached the end of the survey with most items completed (≥95%); **Excluded due to out of area (n = 3), other clinical specialty (n = 12), or missing key information (n = 19).
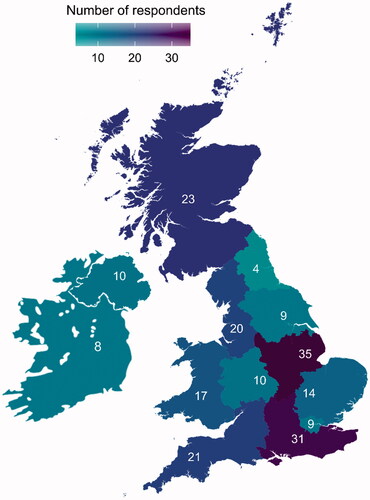
Respondents varied according to geographical location (), with a spread across most regions in the UK and RoI. Though 286 stroke units were approached across the UK and RoI, there are no available registers of stroke OTs and orthoptists making accurate response rate estimates for the total clinician population unobtainable. Similarly, response rates from recruitment via social media outreach are impractical to estimate due to unspecific tracking data.
Figure 2. Geographical Spread of Clinician Respondents. Instances of missing region data from UK clinicians were n = 3.
Respondents’ stroke care experience in years varied, but 61% of the respondents had at least 5 years experience: <1 year (n = 16), 1–2 year(s) (n = 23), 2–5 years (n = 43), 5–10 years (n = 42), >10 years (n = 89), years unknown (n = 1). Of UK respondents (n = 206), 95% were employed by publicly funded services (i.e., National Healthcare Service; Health and Social Care in Northern Ireland). 38 occupational therapists worked in acute and/or hyperacute settings only, 90 in rehabilitation (inpatient and outpatient or community) only, 44 in both, and 2 classified as “unknown/other.” 38 orthoptists worked in eye hospitals (inpatient and outpatient). Fourteen orthoptists also said they worked in an acute/hyperacute setting and 9 in a rehabilitation setting.
Care pathway for visual perception problems
The referral pathway reported by occupational therapists for visual perception problems is summarised in Supplementary Table 1. 57% of occupational therapists most frequently reported referring to local orthoptic departments (or eye hospitals) for these problems, while for 24% of occupational therapists there was no established referral pathway. Orthoptists (n = 40) reported that referrals for visual perception problems are typically triaged within local eye hospitals (88%), while some reported no established clinical pathway (8%).
Understanding and importance of visual perception screening
and summarises how occupational therapists and orthoptists responded to querying if listed examples were related to visual perception or not. There were 14 examples with varying response rates of 95–100% per example. For the inferential chi-squared analyses only definitive answers were analysed (“related to visual perception” and “not related to visual perception”). Respondents selected a definitive answer for each example (rather than “Don’t know”) in 92% instances (2759/2996). Overall, both professions classified five examples of sensory vision deficits as related to visual perception at a rate of 52% (474/988), while eight examples of visual perceptual deficits and one of visual neglect were considered part of visual perception by 83% (1296/1560, for visual perceptual deficits) and 91% (192/211, for visual neglect) of respondents. There were no overall between-group differences in how occupational therapists and orthoptists classified domains of sensory vision (χ2 = 3.66, df = 1, p = 0.06), visual perception (χ2 = 0.58, df = 1, p = 0.45), and visual neglect (visual neglect: χ2 = 0.39, df = 1, p = 0.53, see Supplementary Table 2 for details). In the free-text section provided, respondents described additional functions or problems related to visual perception: visual fatigue, saccades, nystagmus, cortical blindness, simultanagnosia, pupillary light reflex, other visual impairment (glaucoma).
Figure 3. (A, B) Definitions and importance of sensory visual and visual perception domains, as rated by occupational therapists. Response rates for all items herein fall between 98 and 100% (n = 170–174).
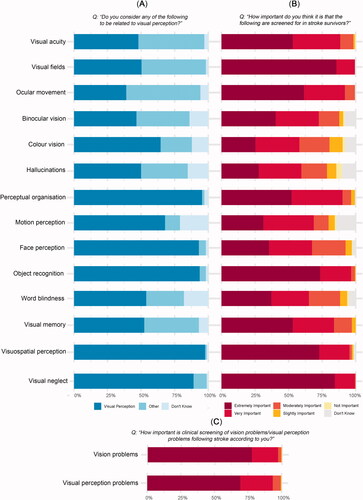
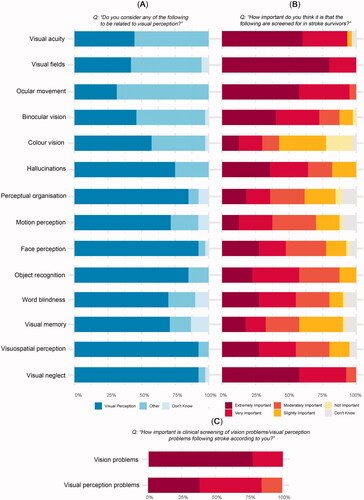
Figure 4. (A, B) Definitions and importance of sensory visual and visual perception domains, as rated by orthoptists. Response rates for all items herein fall between 95 and 100% (n = 38–40).
Importance ratings (five-point Likert scale) for screening problems or functions related to visual perception are summarised in , and . Mann–Whitney U ranked sum testing (Supplementary Table 3) demonstrated occupational therapists ranking domains of visual perception overall (not including visual neglect) with higher importance (median = 5; IQR = 1) than orthoptists (median = 4; IQR = 1) (U = 4362, Z/√N = −0.25, p < 0.001). Occupational therapists rated visual neglect with higher importance (median = 5; IQR = 0) than orthoptists (median = 5; IQR = 1; U = 4451, Z/√N = −0.27, p < 0.001). Further, occupational therapists and rated sensory vision with similar importance (median = 5; IQR = 0) than orthoptists (median = 5; IQR = 0; U = 3460.5, p = 0.94).
Despite a similar median rating, the distribution of the rating varied between domains. Importance ratings varied significantly across domain types (sensory vision [median = 5; IQR = 0], visual perception [median = 5; IQR = 1] and visual neglect [median = 5; IQR = 0], Kruskal–Wallis rank-sum test: χ2 = 18.11, df = 2, p < 0.001). Dunn’s test for multiple comparisons with Holm-Šidák adjustment [Citation36] revealed significant differences in ratings between sensory vision and visual perception (Z = −3.45, p < 0.001) and visual perception and visual neglect (Z = 3.90, p < 0.001) with lower importance ratings for problems considered to be part of “visual perception” than those considered to be part of “sensory vision” or “visual neglect.”
Current practice
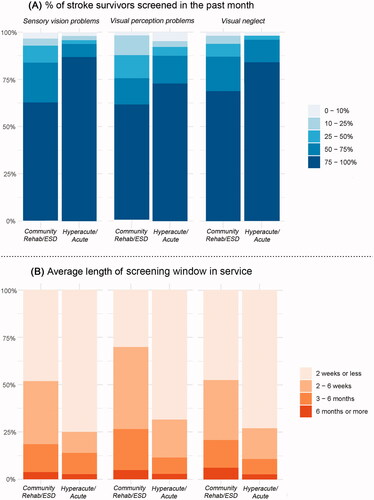
illustrates the percentage of stroke survivors typically screened across clinical settings. Here only respondents working exclusively in either community rehabilitation or hyperacute/acute settings were included because those working within both did not provide estimates per setting but a combined estimate. More respondents worked for community rehabilitation services only (n = 74) than those who worked in hyperacute/acute units only (n = 45). Most respondents answered that they screened between 75 and 100% of the stroke survivors they saw for visual inattention, vision sensory and visual perceptual deficits in the past month. In , the average screening window for sensory vision, visual perceptual difficulties, and visual neglect is illustrated. For sensory vision screening, stroke survivors were most frequently screened within 2 weeks after their stroke in acute/hyperacute units (33 out of 43) and community rehabilitation (33 out of 71) settings. Similarly, stroke survivors were screened for visual neglect most commonly within 2 weeks after their stroke in both acute/hyperacute (33 out of 44) and community rehabilitation (32 out of 73) settings. For visual perception screening, stroke survivors were most frequently screened within 2 weeks (29 out of 42) in acute/hyperacute units and 2–6 weeks (29 out of 73) in community rehabilitation settings.
Figure 5. (A, B) Rate of screening and average length of screening window across stroke services. Respondent data from clinicians working hyperacute/acute or community rehabilitation/ESD exclusively were analysed herein. Response rate was 89–99% per item. Respondents unable to provide answer was 1–8 per item.
Clinical professions commonly involved in the visual screening processes are summarised in . Occupational therapists were more involved than other clinicians in the screening of sensory vision difficulties (75%), visual perceptual difficulties (88%), and visual neglect (86%), followed by orthoptists (20, 12, and 14%, respectively).
Table 3. Clinicians involved in clinical screening of sensory vision and visual perception difficulties.
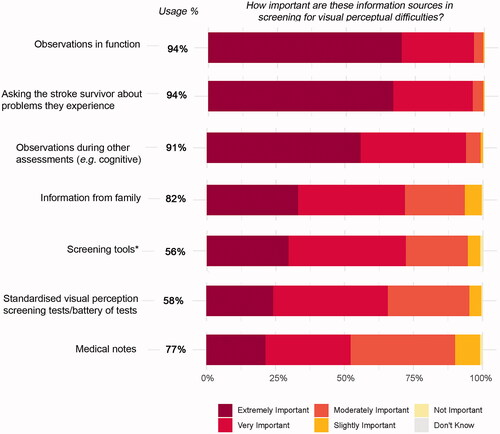
The frequency of use and importance of information sources employed during visual perceptual screening is illustrated in . “Observations in function” (93%) and “asking the stroke survivor about their experience” (94%) are most commonly used by respondents during visual perception screening; these information sources were rated extremely important more than any other item (70 and 67%, respectively). Information sources least frequently used were “standardised visual perception tests/battery” (58%) and “screening tools” (i.e., a set of shorter tests and questions to screen a range of functions in a short time) (56%). There was strong agreement between usages and importance of information sources: commonly used sources of information were also considered important.
Figure 6. Frequency of use and importance of information sources used by respondents to inform visual perception screening. Response rates for all items was 100% (n = 214). *A distinction between visual perception tests and screening tools was made within the survey, referring to “screening tools” as “Set of shorter tests and questions to screen for a range of functions in a short time, usually less than 20 min. This might then prompt follow-up by more in-depth assessment of specific functions and/or by a referral to specialist service.”
Respondents who previously mentioned they used standardised assessments, were asked which assessment batteries (i.e., long, in-depth set of tests to comprehensively assess a particular function) they made use of during the screening process. 34% of them reported using screening tools that measure multiple domains of visual perception (e.g., Rivermead Perceptual Assessment Battery), while 42% reported using batteries that measure specific aspects of visual perception (e.g., Visual Object and Space Perception Battery, Montreal Cognitive Assessment, Addenbrookes Cognitive Examination, and Chessington Occupational Therapy Neurological Battery). Further, 47% of respondents reported using an assessment battery that did not measure visual perceptual function, but rather sensory vision and/or visual neglect (e.g., Oxford Cognitive Screen, Behavioural Inattention Test, and Brain Injury Visual Assessment for Adults).
In terms of specific screening tests (i.e., short sets of tests to screen a particular function) used for visual perception screening, the majority of respondents (45%) reported using a visual neglect-based test (e.g., Line bisection and cancellation tests), while only 18% respondents reported using a test for a specific visual perceptual function (e.g., object recognition, figure-ground segregation, visuo-constructive skills). An overview of assessment batteries and screening tests used by respondents is shown in .
Table 4. Standardised clinical tests used in screening of visual perception difficulties.
Challenges and facilitators to practice
illustrates challenging elements of visual perception screening and corresponding ratings by respondents. “Lack of staff training on the assessment of visual perception difficulties” was rated extremely challenging more than any other item (20%) followed by “physical/cognitive condition of the stroke survivor” (19%), and rated lowest was “insufficient detail within referral” (5%). Clinicians reported further challenges to practice via free-text, including “lack of collaborative working with stroke specialist team and visual specialists” and “delay in accessing specialist orthoptist/ophthalmologist assessment.”
Figure 7. (A, B) Current challenges and facilitators to screening of visual perception problems following stroke. Response rates for all items ranged from 97 to 99% (n = 207–212).
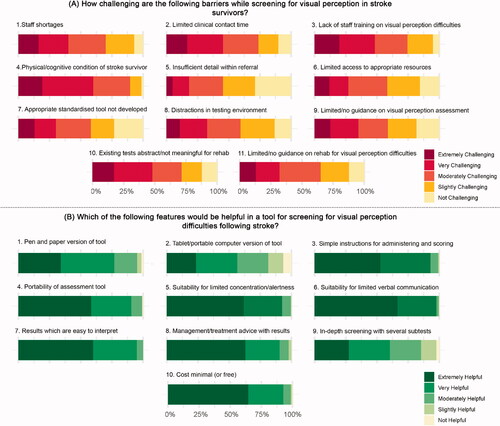
Clinicians rated the helpfulness of features of a screening tool for visual perception, as summarised in . “Suitability for limited verbal communication” was rated as extremely helpful more than any other item (67%), followed by “management/treatment advice with results” (63%) “suitability for limited concentration/alertness” (62%), and “minimal cost” (64%). Items “tablet/portable computer version of tool” and “in-depth screening test with several subtests” were rated least helpful overall. In the free-text section provided, clinicians reported further features which would be helpful, including “results which are easy to monitor/repeatable/interpret for changes/improvement,” and “ability to complete over multiple sessions.” The preferred median time to administer a screening tool for visual perception difficulties was 15 min (IQR = 10; n = 202). Clinicians reported a high preference for “online demonstration videos” (85%; n = 182) and “low cost training” (83%; n = 177) for the training of visual perception screening tools (Supplementary Table 4).
Discussion
Our evaluation aimed to elucidate current practices for screening visual perceptual deficits following stroke, building on qualitative work by Vancleef et al. [Citation12]. Through undertaking a large-scale survey across the UK and RoI, we tested key aspects of their work in a quantitative-based research paradigm. Survey respondents provided a geographically diverse representation of clinical practice across the UK and RoI, with responses from all geographical regions of the UK. Further, 61% of survey respondents completed the survey in its entirety, providing a robust and comprehensive dataset to test our hypotheses.
Consistent with Vancleef et al. [Citation12], we observed a disparate understanding of visual perception among clinician respondents. When provided a list of visual perceptual functions/deficits, most respondents (83%) were able to correctly identify these as belonging to visual perception. However, when provided a list of sensory vision functions/deficits, 48% of responses inaccurately identified these as visual perceptual. Further, 91% of respondents regarded visual neglect as a deficit of visual perception, contrasting with literature which considers it an attentional processing deficit [Citation11]. Incongruence in how sensory vision and visual perception are understood appears problematic, particularly where exact and consistent language is relied upon in information exchanges to inform clinical decision-making, such as in referral reports. Inconsistencies between referrals from stroke units to orthoptics and subsequent orthoptic diagnoses have been highlighted previously [Citation37,Citation38].
Occupational therapists rated the importance of screening for deficits across all domains (sensory vision, visual perception, and visual neglect) more highly than orthoptists. Both professions rated the importance of screening sensory vision and visual neglect as slightly more important than visual perception, though most respondents rated all three domains with high importance. It is unclear whether this is due to perceived recovery trajectories of some deficits like visuospatial neglect, which have been shown to recover over 6 months in large proportions of stroke survivors [Citation39,Citation40], or whether overall problems such as acuity are perceived to affect more aspects of daily living than more specific perceptual deficits such as agnosia. Determining the rationale behind differences in importance ratings may be an important topic for future research.
Across acute/hyperacute and community rehabilitation settings, most respondents reported screening visual perceptual deficits frequently (75–100% of stroke survivors in the past month). Both sensory vision deficits and visual neglect were also screened at this rate, consistent with previously published rates [Citation41].
Occupational therapists and orthoptists utilise several information sources throughout visual perception screening. More than half of respondents reported using all information sources listed within the survey (i.e., observations made in functional tasks like washing and dressing, asking stroke survivors about problems they experience, observations during other assessments, information from family, screening tools, standardised visual perceptual screening tests/battery of tests, medical notes). The information sources rated most important and used most frequently (94%) were “observation of function” and “asking stroke survivors about problems they experience.” These information sources are related to a top-down approach to assessment, which is mandated within the standard clinical practise for occupational therapists (i.e., 81% of survey respondents) [Citation2]. Observations made during functional tasks are often circumstantial and not protocol-driven (non-standardised), dependent on various factors such as the type of task (e.g., dressing versus cooking), condition of the stroke survivor, and level of experience of the clinician [Citation42]. Furthermore, asking stroke survivors about problems they experience has uncertain reliability, especially where communication is limited; previous research has shown only 5% of stroke survivors self-report visual perceptual deficits to clinicians [Citation9,Citation43]. Upon comprehensive and systematic assessment of visual perceptual problems, up to 76% of stroke survivors may present with such difficulties [Citation14].
Standardised assessment batteries and screening tools were reported as the most infrequently used information sources during visual perception screening (56–58%), while these information sources are incontestably the most accurate and reliable indicators of visual perceptual deficit [Citation44]. This confirms our second hypothesis stating a lack of uniformity in current practice for screening visual perception difficulties and reliance on diverging and/or non-standardised information gathering practices. Of the respondents who administer assessment batteries, near one-third used a battery that assessed visual perceptual function comprehensively. Moreover, 47% of respondents reported administering screening tools that measure visual neglect only, while only 18% administer a tool that measures a domain of visual perception. Taken together, this indicates that for respondents administering standardised instruments (56–58%), only 34% use measures that appropriately screen visual perception. Previous studies report similarly low uses of assessment batteries which measure visual perceptual functions and high uses of sensory vision and visual neglect screening tests among occupational therapists [Citation41,Citation45].
Overall, we highlight several problematic aspects of visual perception screening in this evaluation: disparate understanding of visual perception among clinicians, biases for screening sensory vision and visual neglect, reliance on non-standardised information sources, and selection of ill-suited assessment tools. These findings may be explained in part by the apparent challenges to practice faced by clinicians. According to respondents, the most challenging aspect of visual perceptual screening was “lack of staff training on the assessment of visual perceptual deficits” (rated “extremely challenging” by 20% of respondents). Limited provision for training clinicians on visual impairment screening has been emphasised previously [Citation46], though this was not specific to visual perceptual deficits.
To address these aforementioned challenges, the first step may be increasing awareness of visual perceptual deficits among professionals working with stroke survivors, as well as increasing access to training for screening these deficits. To remediate the use of sub-optimal assessment tools, we asked respondents what key characteristics would make a helpful tool for the assessment of visual perception. Most respondents reported that a visual perception screening tool would be extremely helpful if it was low cost, suitable for stroke survivors with limited verbal communication and concentration/awareness, and provided management/treatment advice with results. Further, respondents reported a preference for such a tool to be administrable in 15 min. Integrating this feedback into the development of a novel standardised screening tool for post-stroke visual perception would serve as an important facilitator to current practice.
Further future research may endeavour to understand how clinical features in the individual stroke survivor may contribute as facilitators or barriers to the process of screening for visual perception deficits (e.g., age, gender, the impact of the stroke based on functional scores such as the Barthel Index) through a clinical audit. Beyond this, attempts may be made to consolidate existing tools into a simplified flow chart which may be used to determine appropriate screening and comprehensive examination of vision for stroke survivors (in terms of sensory vision, visual perception and visual neglect). A potential explanation for a lack of insight into how to assess visual difficulties may stem from unclear referral pathways. A recent literature review has proposed a potential referral pathway that may lead to more appropriate and efficient referrals made [Citation38]; future research efforts to trial these proposed pathways would go along in improving the rate at which post-stroke vision assessments are made.
There were two notable limitations to the present study, the first concerning the sampling approach. We analysed data pertaining to occupational therapists and orthoptists only; other professionals such as physiotherapists and psychologists may be involved in the visual perception screening process [Citation45], albeit to a lesser extent. Further, we sampled only clinicians actively involved in the screening process, consequently not capturing feedback from clinicians in stroke services where visual perception screening is not conducted. At the time of writing, no estimates of the percentage of services involved in visual perception screening are available, however, given the bias we observed for sensory vision screening, this is potentially lower than the 45% of services in the UK that offer sensory vision screening [Citation45]. Further, our study was vulnerable to self-selection bias: clinicians without interest in visual perception screening are less likely to have participated in the present study. This bias might have therefore inflated our importance ratings. Finally, our study concerns only clinicians working across the UK and RoI, therefore limiting generalisability to practice in other countries.
A second notable limitation of our study is the level of detail captured in survey items. We explored a broad range of topics related to visual perception assessment, consequentially leaving certain topics underexplored. For instance, we did not ask respondents to detail full referral pathways, assessments offered at each stage of the care pathway, and rehabilitation options provided to stroke survivors. Furthermore, we did probe for the rationale behind importance ratings or choice of information sources during screening. Further research here may further our understanding of current post-stroke visual perception screening.
Conclusion
Post-stroke visual perceptual deficits are screened at a similar rate to sensory vision deficits and visual neglect. However, how visual perception is defined and understood appears to diverge among clinicians. Further complicating this is a reliance on subjective and non-standardised approaches to screening visual perceptual deficits. These issues may in part contribute to the underdiagnosis of visual perceptual deficits in stroke survivors. Our study underscores the need for increased training provision for professionals working with stroke survivors on visual perceptual deficit screening. In addition, a screening tool for post-stroke visual perceptual deficits would increase early detection and appropriate onward referrals for a comprehensive assessment.
Supplementary_Materials_-_Survey__19052021_.pdf
Download PDF (391.6 KB)APPENDICES__Updated_150721_.docx
Download MS Word (22.4 KB)Acknowledgements
We thank the orthoptists and occupational therapists involved in providing feedback on the survey design and formatting of the pilot survey. We also thank Viktorija Jancevska for assistance in participant recruitment, data collection and data handling. We acknowledge the British and Irish Orthoptic Society, Association of Occupational Therapists of Ireland, and Royal College of Occupational Therapists for their assistance in distributing the survey online, as well as the clinicians who took the time to complete the survey. In addition, we would like to thank Philip Clatworthy for facilitating this project.
Disclosure statement
No potential conflict of interest was reported by the author(s).
Data availability statement
Data will be made publicly available on Figshare upon publication of the study. Reviewers can consult the data at the following webpages:
Additional information
Funding
Related Research Data
References
- Chin JH, Vora N. The global burden of neurologic diseases. Neurology. 2014;83(4):349–351.
- Wolf TJ, Baum C, Conner LT. Changing face of stroke: implications for occupational therapy practice. Am J Occup Ther. 2009;63(5):621–625.
- Sierra C, Coca A, Schiffrin EL. Vascular mechanisms in the pathogenesis of stroke. Curr Hypertens Rep. 2011;13(3):200–207.
- Gall C, Franke GH, Sabel BA. Vision-related quality of life in first stroke patients with homonymous visual field defects. Health Qual Life Outcomes. 2010;8:33.
- Hepworth LR, Rowe FJ. Visual impairment following stroke-the impact on quality of life: a systematic review. Ophthalmol Res. 2016;5(2):1–15.
- Joukal M. Anatomy of the human visual pathway. In: Skorkovská K, editor. Homonymous visual field defects. Cham (Switzerland): Springer; 2017. p. 1–16.
- Moodley A. Understanding vision and the brain. Commun Eye Health. 2016;29:61–63.
- Kolb B, Whishaw IQ. Fundamentals of human neuropsychology. 7th ed. New York (NY): Worth Publishers; 2003.
- Rowe FJ, Hepworth LR, Howard C, et al. High incidence and prevalence of visual problems after acute stroke: an epidemiology study with implications for service delivery. PLoS One. 2019;14(3):e0213035.
- Bouska M, Kauffman N, Marcus S. Disorders of the visual perceptual system. In: Umphred D, editor. Neurological Rehabilitation. St Louis (MO): Mosby Company; 1990. p. 705–740.
- Làdavas E. The role of visual attention in neglect: a dissociation between perceptual and directional motor neglect. Neuropsychol Rehabil. 1994;4(2):155–159.
- Vancleef K, Colwell M, Hewitt O, et al. Current practice and challenges in screening for visual perception deficits after stroke: a qualitative study. Disabil Rehabil. 2020. DOI:10.1080/09638288.2020.1824245.
- Rowland TJ, Cooke DM, Gustafsson LA. Role of occupational therapy after stroke. Ann Indian Acad Neurol. 2008;11:99.
- Edmans JA, Lincoln NB. The frequency of perceptual deficits after stroke. Br J Occup Ther. 1989;52(7):266–270.
- Rowe F, Brand D, Jackson CA, et al. Visual impairment following stroke: do stroke patients require vision assessment? Age Ageing. 2009;38(2):188–193.
- Sand KM, Wilhelmsen G, Naess H, et al. Vision problems in ischaemic stroke patients: effects on life quality and disability. Eur J Neurol. 2016;23:1–7.
- Tsai S-Y, Cheng C-Y, Hsu W-M, et al. Association between visual impairment and depression in the elderly. J Formos Med Assoc. 2003;102:86–90.
- Evans JR, Fletcher AE, Wormald RPL. Depression and anxiety in visually impaired older people. Ophthalmology. 2007;114(2):283–288.
- Lars N, Yngve G. Fall prediction index for patients in stroke rehabilitation. Stroke. 1997;28:716–721.
- Mercier L, Audet T, Hébert R, et al. Impact of motor, cognitive, and perceptual disorders on ability to perform activities of daily living after stroke. Stroke. 2001;32(11):2602–2608.
- Jehkonen M, Ahonen J, Dastidar P, et al. Visual neglect as a predictor of functional outcome one year after stroke. Acta Neurol Scand. 2000;101(3):195–201.
- West CG, Gildengorin G, Haegerstrom-Portnoy G, et al. Is vision function related to physical functional ability in older adults? J Am Geriatr Soc. 2002;50(1):136–145.
- Nelles G, Esser J, Eckstein A, et al. Compensatory visual field training for patients with hemianopia after stroke. Neurosci Lett. 2001;306(3):189–192.
- Chen P, Hartman AJ, Priscilla Galarza C, et al. Global processing training to improve visuospatial memory deficits after right-brain stroke. Arch Clin Neuropsychol. 2012;27(8):891–905.
- Brott T, Adams HP, Jr, Olinger CP, et al. Measurements of acute cerebral infarction: a clinical examination scale. Stroke. 1989;20(7):864–870.
- Hanna KL, Hepworth LR, Rowe F. Screening methods for post-stroke visual impairment: a systematic review. Disabil Rehabil. 2017;39(25):2531–2543.
- Moore MJ, Vancleef K, Shalev N, et al. When neglect is neglected: NIHSS observational measure lacks sensitivity in identifying post-stroke unilateral neglect. J Neurol Neurosurg Psychiatry. 2019;90(9):1070–1071.
- Beaudoin AJ, Fournier B, Julien‐Caron L, et al. Visuoperceptual deficits and participation in older adults after stroke. Aust Occup Ther J. 2013;60(4):260–266.
- Kerkhoff G. Neurovisual rehabilitation: recent developments and future directions. J Neurol Neurosurg Psychiatry. 2000;68(6):691–706.
- Royal College of Physicians. Sentinel Stroke National Audit Programme (SSNAP). London (UK): RCOP; 2015;
- National Health Service. Scottish stroke improvement programme [Internet]. Edinburgh (UK): NHS; 2019 [cited 2019 Feb 10]. Available from: https://www.strokeaudit.scot.nhs.uk/index.html
- Horgan F, Hickey A, McGee H, et al. Irish Heart Foundation National Audit of Stroke Care; 2008 [cited 2019 Feb 10]. Available from: https://repository.rcsi.com/articles/report/Irish_Heart_Foundation_National_Audit_of_Stroke_Care/10769726/1
- Sheikh K, Mattingly S. Investigating non-response bias in mail surveys. J Epidemiol Community Health. 1981;35(4):293–296.
- Andres L. Validity, reliability, and trustworthiness. In: Designing and doing survey research. Thousand Oaks (CA): SAGE; 2012. p. 115–128.
- Edwards PJ, Roberts I, Clarke MJ, et al. Methods to increase response to postal and electronic questionnaires. Cochrane Database Syst Rev. 2009;3:MR000008.
- Holm S. A simple sequentially rejective multiple test procedure. Scand J Stat. 1979;6:65–70.
- Rowe FJ. Accuracy of referrals for visual assessment in a stroke population. Eye. 2011;25(2):161–167.
- Rowe FJ, Hepworth LR, Howard C, et al. Developing a stroke-vision care pathway: a consensus study. Disabil Rehabil. 2020. DOI:10.1080/09638288.2020.1768302.
- Demeyere N, Gillebert CR. Ego- and allocentric visuospatial neglect: dissociations, prevalence, and laterality in acute stroke. Neuropsychology. 2019;33(4):490–498.
- Stone SP, Patel P, Greenwood RJ, et al. Measuring visual neglect in acute stroke and predicting its recovery: the visual neglect recovery index. J Neurol Neurosurg Psychiatry. 1992;55(6):431–436.
- Pollock A, Hazelton C, Brady M. Visual problems after stroke: a survey of current practice by occupational therapists working in UK stroke inpatient settings. Top Stroke Rehabil. 2011;18:643–651.
- Hand PJ, Haisma JA, Kwan J, et al. Interobserver agreement for the bedside clinical assessment of suspected stroke. Stroke. 2006;37:776–780.
- Rowe F. Visual perceptual consequences of stroke. Strabismus. 2009;17(1):24–28.
- Harvey PD. Clinical applications of neuropsychological assessment. Dialogues Clin Neurosci. 2012;14:91–99.
- Rowe FJ. Who sees visual impairment following stroke? Strabismus. 2010;18(2):37–40.
- Rowe F, Walker M, Rockliffe J, et al. Delivery of high quality stroke and vision care: experiences of UK services. Disabil Rehabil. 2016;38(8):813–817.