
Abstract
Purpose
Persons with Multiple Sclerosis (PwMS) are physically inactive and spend more time in sedentary behaviours than healthy persons, which increases the risk of developing cardiometabolic diseases. In this randomised crossover study, the cardiometabolic health effects of replacing sitting with light-intensity physical activity (LIPA) and exercise (EX) were investigated.
Materials and methods
Twenty-eight mildly disabled PwMS performed four 4-day activity regimens in free-living conditions; CONTROL (habitual activity), SIT, LIPA, and EX. Plasma glucose and insulin (oral glucose tolerance test), plasma lipids, inflammation, resting heart rate, blood pressure, body weight, and perceived exertion were measured (clinical-trials.gov: NCT03919058).
Results
CONTROL: 9.7 h sitting/day, SIT: 13.3 h sitting/day, LIPA: 8.3 h sitting, 4.7 h standing, and 2.7 h light-intensity walking/day, and EX: 11.6 h sitting/day with 1.3 h vigorous-intensity cycling. Compared to SIT, improvements (p < 0.001) after LIPA and EX were found for insulin total area under the curve (−17 019 ± 5708 and −23 303 ± 7953 pmol/L*min), insulin sensitivity (Matsuda index +1.8 ± 0.3 and +1.9 ± 0.4) and blood lipids (triglycerides: −0.4 ± 0.1 and −0.5 ± 0.1 mmol/L; non-high-density lipoprotein cholesterol: −0.3 ± 0.1 and −0.5 ± 0.1 mmol/L), with no difference between LIPA and EX. Perceived exertion was higher after EX compared to LIPA (Borg score [6–20]: +2.6 ± 3.3, p = 0.002).
Conclusion
Replacing sitting with LIPA throughout the day exerts similar cardiometabolic health effects as a vigorous-intensity exercise in PwMS.
Increasing light-intensity physical activity (LIPA) throughout the day improves cardiometabolic health to the same extent as one vigorous-intensity exercise session
Increasing LIPA induces less exertion than performing a vigorous-intensity exercise
IMPLICATIONS FOR REHABILITATION
Introduction
Multiple sclerosis (MS) is an autoimmune, inflammatory, and neurodegenerative disorder of the central nervous system, predominantly affecting young to middle-aged adults [Citation1]. Clinical manifestations include spasticity, paralysis, walking difficulties, and cognitive abnormalities [Citation2]. These primary disease symptoms often hinder persons with MS (PwMS) to engage in physical activity (PA) [Citation3], initiating a vicious cycle of deconditioning and possibly worsening of impairments and symptoms over time [Citation4]. Moreover, 80% of persons with MS (PwMS) are reported to be physically inactive (i.e., not meeting the recommended public health levels of moderate-to-vigorous PA [Citation5]), while engagement in sedentary behaviour (SB) and accumulated prolonged sedentary bouts is higher compared to healthy persons [Citation6]. SB is defined as “any waking behaviour in a sitting, reclining or lying posture with an energy expenditure ≤1.5 metabolic equivalents [Citation7].”
Physical inactivity and SB are associated with an increased risk of cardiovascular and all-cause mortality, and cardiovascular/metabolic diseases such as type 2 diabetes mellitus (T2DM), hypertension, and dyslipidaemia in the general population [Citation8]. In MS, the risk of developing such cardiometabolic (CM) comorbidities might be even higher due to a genetic overlap and common manifestations between MS and several risk factors for CM disease, such as immune system dysfunction, inflammation, and oxidative stress [Citation9,Citation10]. In addition, certain MS drugs (e.g. corticosteroids) can induce insulin resistance [Citation11]. More specifically, there is a higher prevalence of hypertension, dyslipidaemia, obesity, insulin resistance, impaired glucose tolerance, and T2DM among PwMS [Citation10,Citation12–15]. Preventing and/or treating these CM comorbidities might be of particular relevance because they have been associated with a worsening of disability, independent of the timing of their development (at MS symptom onset, diagnosis, or later in the disease course) [Citation10,Citation16,Citation17].
Despite the evident cardiometabolic health benefits of exercise in PwMS [Citation18], recent systematic reviews showed that exercise interventions fail to improve objectively measured PA [Citation19,Citation20], which indicates the need for alternative strategies. Because PwMS are reported to spend between 47 and 85% of their waking time in sedentary pursuits [Citation6], this might also represent an interesting opportunity for behaviour change. To date, only three studies targeting objective SB have been performed in PwMS, showing that SB interventions are feasible [Citation21–23]. Furthermore, we previously showed that replacing SB with light-intensity walking and standing (light-intensity PA; LIPA) improved CM health in healthy sedentary subjects, T2DM patients, and persons with obesity [Citation24–27]. Moreover, LIPA was more effective than one bout of energy-matched moderate-intensity cycling [Citation25,Citation26]. The aim of the current proof-of-concept study was therefore to investigate the CM health effects and levels of exertion of replacing SB with LIPA and exercise in PwMS.
Methods
Study design
A randomised cross-over design was used with four activity regimens (CONTROL, SIT, LIPA, and EX) of four days each, followed by a test day to assess outcomes, and separated by 10-day wash-out periods (). Activity regimens were performed under free-living conditions, test days were conducted at Hasselt University (Diepenbeek, Belgium) and training sessions at the Rehabilitation and MS Center of Pelt (Belgium) or Hasselt University from April 2019 until April 2021. The first (CONTROL) and last (EX) regimen were fixed and the order of the SIT and LIPA regimen was block randomised with a block size of four regimen orders using sealed, non-translucent envelopes. Sample size calculation was based on the change in serum fasting triglyceride (TG) levels in our previous study with a comparable study design in T2DM patients [Citation26], where TG decreased from 1.9 ± 0.7 after SIT to 1.5 ± 0.5 mmol/L after LIPA [Citation26]. An estimated effect size of 0.7 resulted in 31 PwMS needed to detect a comparable change of 24% between the two regimens with a power of 80% and a two-sided Bonferroni corrected α using a paired t-test and drop-out rate of 10%.
Figure 1. Study design. After checking study eligibility and performing a maximal cardiopulmonary exercise test (CPET) during the screening visit, participants performed four 4-day activity regimens [CONTROL, SIT, LIPA (light-intensity physical activity), EX (exercise) regimen] in free-living conditions, followed by a test day to assess outcomes and a wash-out period of 10 days. Habitual physical activity levels were maintained during the CONTROL regimen and manipulated as indicated during the subsequent regimens. The order of the SIT and LIPA regimen was randomised.
![Figure 1. Study design. After checking study eligibility and performing a maximal cardiopulmonary exercise test (CPET) during the screening visit, participants performed four 4-day activity regimens [CONTROL, SIT, LIPA (light-intensity physical activity), EX (exercise) regimen] in free-living conditions, followed by a test day to assess outcomes and a wash-out period of 10 days. Habitual physical activity levels were maintained during the CONTROL regimen and manipulated as indicated during the subsequent regimens. The order of the SIT and LIPA regimen was randomised.](/cms/asset/59c8fced-25f0-4943-9386-95ec6caf58d8/idre_a_2122601_f0001_b.jpg)
During the screening visit, study eligibility and subject characteristics (gender, age, anthropometrics, EDSS score, MS duration, and medication intake) were assessed and a resting electrocardiogram was taken. After medical approval for maximal exercise testing by a trained professional, a maximal cardiopulmonary exercise test (CPET) was performed. During the activity regimens, PA and SB, exercise intensity, and perceived exertion were measured. After an overnight fast (12 h) following the fourth day of each activity regimen, CM health outcomes were assessed (cfr. 'cardiometabolic health' below). The analysis of outcomes was performed without knowledge of activity regimens. All participants provided written informed consent before participation. The study protocol was approved by the Medical Ethical Committee of Hasselt University (Hasselt, Belgium) and the Maria Hospital North Limburg (Pelt, Belgium), was conducted in accordance with the principles of the Declaration of Helsinki (2013), and is registered at clinical-trials.gov as NCT03919058.
Participants
Adults (>18 years) with a clinical diagnosis of MS (all subtypes) according to the McDonald criteria [Citation28] were recruited through online and paper advertisements. Exclusion criteria were an acute exacerbation within 6 months before the start of the study, an EDSS score >5, experimental drug use or medication changes in the last 3 months, medical conditions precluding PA participation, alcohol abuse (>20 units/week) and reported dietary habits or weight loss (>2 kg) in the last 3 months before the study.
Activity regimens
Participants were instructed to keep their sleeping time constant during the activity regimens. All participants started with a baseline measurement of PA and SB in the CONTROL regimen. Usual PA/SB had to be maintained, to provide feedback on how to change activity patterns for the subsequent regimens. Assuming 8 h of sleep per night, participants were instructed to sit for 14 h per day during the SIT regimen and to restrict walking and standing to 1 h/day each. In the LIPA regimen, participants were instructed to replace 5 h of SB per day with 2 h of self-perceived light-intensity walking and 3 h of standing, divided into smaller bouts across the day to regularly interrupt SB (preferably every 30 min). In the EX regimen, the SIT regimen was repeated but ∼1 h of sitting per day was replaced with a supervised cycle exercise session on an ergometer that was energy-matched with the energy expenditure (EE) of the LIPA regimen. EE during the activity regimens was measured in metabolic equivalents (METs) by activPAL (cfr. 'Accelerometry, exercise intensity, and perceived exertion' below). Based on the equation from Duvivier et al. (MET = 0.0545*watt + 1.4561; R2 = 0.946 [Citation26]), the EE for cycling at 50–60% of the participants’ maximal workload (Wmax) was calculated. Exercise duration was then determined in order to match cycling METs with the difference in EE between LIPA and SIT. Each exercise session started and ended with a 5 min warm-up/cool-down and was divided into 20–30 min bouts with 5 min rest (sitting) in between to increase feasibility. The last exercise session before the test day was always scheduled before noon.
During the CONTROL regimen, participants were asked to continue their normal diet and to carefully record all food and drink intake in a food diary, along with the timing of consumption. These food diaries were used in the subsequent activity regimens to enable participants to consume the same diet at the same time points. Alcohol consumption was not allowed. Medication intake was continued during the study, but no changes in the dose or type of medication were allowed and the timing of intake was standardized. During the wash-out periods, participants were instructed to continue their normal lifestyle but alcohol intake had to be restricted to one serving/day.
Outcome measures
Accelerometry, exercise intensity, and perceived exertion
During all activity regimens, PA and SB were continuously monitored by accelerometry. During the EX regimen, exercise intensity was monitored by heart rate (HREX) and during both the LIPA and EX regimen, participants had to indicate their level of perceived exertion.
Before the start of each activity regimen, an activPAL3® monitor (PAL Technologies, Glasgow, Scotland), waterproofed with a small sleeve and medical-grade adhesive wrapping (Tegaderm; 3M, Saint Paul, MN, USA), was attached to the mid-part of the anterior thigh of participants using Tegaderm (3 M), providing 24-h PA/SB data of all regimen days. This tri-axial accelerometer accurately discriminates between time spent inactive (sitting or lying), and active (standing, walking) in PwMS [Citation29]. With the latest activPAL classification algorithm, cycling time could also be accurately detected [Citation30]. Sleeping time was determined by the activPAL algorithm and adjusted with self-reported time-in-bed data, as recommended in literature [Citation31]. EE (METs), steps, walking intensity based on cadence (light-intensity: <99 steps/min and moderate-to vigorous-intensity: ≥100 steps/min [Citation32]) and time in prolonged sitting bouts (>60 min), were also reported [Citation33,Citation34]. Time in short sedentary bouts (<30 min) was obtained by subtracting time in sedentary bouts of >30 min from total ST. Furthermore, because Lucernoni et al. [Citation35] recently showed that activPAL cannot detect increases in EE when the cycling cadence is fixed, the exercise heart rate (HREX) was also monitored by a Polar chest strap (Oy, Finland). Consequently, the actual EE was calculated with the V̇O2-pulse coefficient method as described by Pettitt et al. [Citation36].
To calculate the required exercise intensity (50–60% of Wmax [Citation26]), Wmax was assessed using a gradual maximal CPET on an electronically braked cycle ergometer (eBike Basic®, General Electric GmbH, Bitz, Germany). Participants started cycling at 20 W (♀) or 30 W (♂) for 1 min, followed by workload increases of 10 and 15 W/min, respectively, while maintaining a cadence of >70 rounds per minute (rpm). Exercise testing was terminated by volitional exhaustion or failure to maintain 45 rpm. The respiratory exchange ratio (RER), maximal heart rate (HRmax), post-test lactate levels (2 min after termination), and perceived exertion were used to verify maximal effort. Maximal oxygen uptake (V̇O2peak) was also assessed (Metalyzer II®B Cortex, Leipzig, Germany).
In addition, participants had to keep track of their daily ratings of perceived exertion (RPE) using a Borg scale ranging from 6 to 20 (no to maximal exertion [Citation37]) during the LIPA and EX regimen.
Cardiometabolic health
Following the fourth day of each activity regimen and after an overnight fast of 12 h, body weight (BW), resting heart rate (HRrest), systolic and diastolic blood pressure (SBP and DBP) were measured, after which an antecubital catheter was inserted to collect venous blood samples and to perform an oral glucose tolerance test (OGTT).
Anthropometrics, HRrest, and blood pressure
Body height was measured to the nearest 0.1 cm using a wall-mounted Harpenden stadiometer, with participants barefoot. BW was determined using a digital-balanced weighing scale in underwear to the nearest 0.1 kg. Body mass index (BMI) was calculated from weight and height measurements (weight/height2). After a supine resting period of 10 min in a quiet room with constant temperature (21 °C), HRrest, SBP and DBP were assessed four times at 5-min intervals with an electronic sphygmomanometer (Omron®, Omron Healthcare, IL, USA) on the dominant arm and documented as the mean value of the final three measurements.
Blood samples and oral glucose tolerance test
Fasting blood samples were collected for glucose, insulin, lipid profile [triglycerides (TG), total cholesterol (TC), high-density lipoprotein cholesterol (HDL-C), low-density lipoprotein cholesterol (LDL-C), apolipoprotein (apo) A1, and B100] and c-reactive protein (CRP) measurements. HDL-C was subtracted from TC to obtain non-HDL-C. After ingestion of a solution (250 ml) containing 75 g dextrose, venous blood samples were drawn at 15, 30, 45, 60, 90, and 120 min for the assessment of glucose and insulin concentrations. Blood was collected in serum separation and sodium fluoride (NaF) containing BD vacutainer™ tubes (Becton, Dickinson, and Company, Franklin lakes, NY, USA). Serum tubes were centrifuged after 30 min of coagulation at room temperature, and NaF tubes after 15 min. All blood samples were centrifuged for 15 min at 1300 × g (21 °C, brake 9), supernatants were immediately portioned into aliquots, frozen at −20 °C, and stored at −80 °C until analysis. Analyses were performed at the Jessa Hospital (Hasselt, Belgium). Glucose, insulin, TG, TC, HDL-C, LDL-C, apo A1, and B100, and CRP concentrations were automatically assessed on the Roche Cobas 8000 (Roche Diagnostics International Ltd., Rotkreuz, Switzerland).
For glucose and insulin, the total area under the curve (tAUC) from the seven OGTT time points was calculated using the trapezoidal method [Citation38]. To estimate whole-body insulin sensitivity, the Matsuda index was calculated as 10 000/√[fasting glucose (mg/dl) × fasting insulin (µU/ml) × mean glucose during OGTT (mg/dl) × mean insulin during OGTT (µU/ml)] [Citation39]. Tissue-specific insulin sensitivity was calculated using the hepatic insulin resistance index (HIRI) and the muscle insulin sensitivity index (MISI). The HIRI was calculated as the product of the tAUCs for glucose and insulin during the first 30 min of the OGTT [glucose0–30 tAUC (mg/dl h) × insulin0–30 tAUC (µU/ml h)], the MISI was calculated as the rate of decay of glucose concentration divided by the mean insulin concentration during the OGTT in mg/dl/min/µU/ml using the MISI calculator of the Maastricht study [Citation40,Citation41].
Statistical analyses
Statistical analyses were performed by IBM SPSS® version 27.0 (IBM SPSS Statistics for Windows, Chicago, IL, USA). Subject characteristics, PA and RPE are presented as means ± standard deviation (SD), CM health changes as estimated means ± standard error of the mean (SEM). Shapiro-Wilk test was used to test the normality of the data (p < 0.05) and natural log transformation was performed when the outcome was not normally distributed. The differences between regimens were analysed using a linear mixed model analysis including the activity regimen as a fixed factor and the order of the activity regimens as a covariate, with an unstructured repeated covariance structure for the residuals. For differences in PA between activity regimens, no covariate was used. For differences in insulin and glucose concentrations during the OGTT, time (7 different OGTT points) was used as a within-subjects factor and regimen as a between-subjects factor, and the interaction effect was also evaluated. A pairwise post-hoc analysis was performed when the within- or between-subjects factor was statistically significant. A Bonferroni correction was applied for all analyses to correct for multiple testing. To further explore baseline population characteristics, correlations between demographics (V̇O2peak, age, EDSS score), SB/PA (%SB, %stand time, %walking time, and time in prolonged sitting bouts), and CM health measured after the CONTROL regimen, were performed. Pearson correlations were used for continuous data, Spearman correlations for ordinal data. Correlations with CM health outcomes were adjusted for the potential confounders of CM medication (blood/heart related, thyroid and lipid medication), age, and EDSS score. A p-value ≤0.05 (two-tailed) was considered statistically significant for all analyses.
Results
Subject characteristics
A total of 36 participants were screened for study eligibility, of which two did not meet the inclusion criteria (n = 1: relapse before the start of the study and n = 1: EDSS > 5) and six declined to participate due to time commitment. All participants (n = 28) completed CONTROL, after which two dropped out due to time commitment (n = 1) and transportation problems (n = 1). One additional participant did not start with LIPA due to a relapse and three other participants dropped out before the start of EX for reasons not related to the intervention (n = 1 relapse, n = 2 musculoskeletal problems). After study completion, the CM health outcomes of 1 participant were excluded due to thyroid dysfunction (). Twenty-two participants were female, the average age was 45.4 ± 11.0 years, and participants were diagnosed 11.3 ± 9.8 years before study enrolment. The mean EDSS score was 2.4 ± 1.2 (range: 0–5) and the majority of participants were diagnosed with the relapsing-remitting phenotype (26/28, n = 1 primary progressive and n = 1 secondary progressive MS). The achieved criteria for maximal exercise testing were comparable with previous MS research () [Citation42,Citation43]. At baseline, PA/SB levels were not associated with EDSS score, V̇O2peak, or age. V̇O2peak was only significantly correlated with age (r: −0.585, p = 0.013), not with CM health nor EDSS score. SB at baseline correlated (p < 0.05) with fasting levels of TG (r: 0.435), TC (r: 0.417), non-HDL-C (r: 0.505), LDL-C (r: 0.489), apo B (r: 0.508) and HIRI (r: 0.610). Standing time correlated (p < 0.05) with TC (r: −0.596), non-HDL-C (−0.626), LDL-C (r: −0.670), apo B (−0.659), HIRI (r: −0.627), SBP (r: −0.404), and BW (r: −0.504). Walking time and prolonged sitting bouts were not associated with CM health.
Figure 2. Flow chart of study participants.
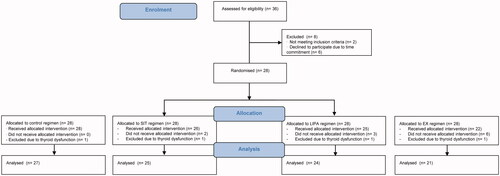
Table 1. Subject characteristics (n: 28).
Accelerometry, exercise intensity, and perceived exertion
Sleeping time remained constant and time spent sitting, walking, standing, and cycling closely resembled protocol instructions (). SB per day was significantly different between all regimens (CONTROL: 9.7 ± 1.9 h, SIT: 13.3 ± 1.6 h, LIPA: 8.3 ± 1.8 h, EX: 11.6 ± 1.7 h, p < 0.001) and time in prolonged sitting bouts measured during CONTROL was increased during SIT (+3.4 ± 2.3 h, p < 0.001) and decreased during LIPA (−1.2 ± 1.4 h, p = 0.002). From SIT to EX, 1.3 h ± 0.3 h of SB/day was replaced with cycling at 79.6 ± 5.2% of HRmax. According to the activPAL estimation, the cycling EE matched with the difference in EE between LIPA and SIT (5.2 ± 0.9 and 5.4 ± 1.6 METs, respectively, p = 1.000). According to the V̇O2-pulse coefficient estimation, the cycling EE (7.5 ± 1.6 METs) was higher (p < 0.001). Moderate-to-vigorous intensity walking time was higher during LIPA compared to the other regimens (+1.0 ± 0.6 h, +1.1 ± 0.6, and +1.1 ± 0.6 vs. CONTROL, SIT, and EX, p < 0.001). Habitual levels of light-intensity walking (1.5 ± 0.7 h) and standing time (3.9 ± 1.4 h) did not change during LIPA and were significantly reduced during SIT (−1.0 ± 0.6 h and −2.6 ± 1.2 h, p < 0.001) and EX (−0.8 ± 0.5 h and −2.1 ± 0.9, p < 0.001). Perceived exertion was lower after LIPA compared to EX (RPE 11.4 ± 2.7 and 14.0 ± 2.2, p = 0.002).
Table 2. Physical activity during the activity regimens.
Cardiometabolic health
Compared to the SIT regimen, LIPA and EX both significantly improved fasting insulin (−12.0 ± 2.1 pmol/L, p < 0.001 and −14.6 ± 4.3 pmol/L, p = 0.002), tAUC insulin (−17 019 ± 5708 pmol/L*min, p = 0.003 and −23 303 ± 7953 pmol/L*min, p = 0.002), the Matsuda-index (+1.8 ± 0.3, p < 0.001 and +1.9 ± 0.4, p = 0.001) and HIRI (−5.6 ± 1.8 mg/dl h*µU/ml h, p = 0.022 and −7.6 ± 2.7 mg/dl h*µU/ml h, p = 0.041), with no difference between LIPA and EX. For MISI and insulin changes during the OGTT, significant intervention effects were found (p = 0.021 and p = 0.046, respectively), of which trends towards significance remained after the pairwise comparisons ( and ). Two-hour insulin values, glucose changes during the OGTT, and tAUC glucose did not differ between regimens. With respect to the lipid profile, a significant intervention effect was found for all lipid measures except for HDL-C and Apo A1 concentrations. Compared to SIT, TG and non-HDL-C levels were lower after LIPA (−0.4 ± 0.1 mmol/L, p < 0.001 and −0.3 ± 0.1 mmol/L, p = 0.004) and EX (−0.5 ± 0.1 mmol/L, p = 0.008 and −0.5 ± 0.1 mmol/L, p < 0.001), with no difference between LIPA and EX. The TG concentration was also lower after LIPA compared to CONTROL (−0.4 ± 0.1 mmol/L, p = 0.011). Apo B levels were only lower after LIPA compared to SIT (−0.1 ± 0.0 mmpl/L, p = 0.042), and the intervention effect for LDL-C did not remain significant after the pairwise comparison. CRP levels after the EX regimen were higher compared to CONTROL and SIT (+0.7 ± 0.3, p = 0.030 and +0.5 ± 0.2, p = 0.035). HRrest was lower after LIPA compared to SIT (−3 ± 1 bpm, p = 0.05), and DBP was lower after EX compared to LIPA (−4 ± 1 mm Hg, p = 0.024) and SIT (−5 ± 1 mm Hg, 0.006). No intervention effect was found for SBP and BW.
Figure 3. Two-hour oral glucose tolerance tests. (A,C) Average insulin and glucose levels per time point of the 2-h oral glucose tolerance test per activity regimen (
 SIT,
SIT,  LIPA,
LIPA,  EX). (B,D) Total area under the curve (tAUC) for insulin and glucose concentrations shown in (A,C). Data are presented as estimated means ± SEM. LIPA: light-intensity physical activity; EX: exercise. #Trend towards significant difference (p = 0.054 at 45 min for SIT vs. LIPA, p = 0.063 at 60 min for SIT vs. EX). All analyses were Bonferroni corrected.
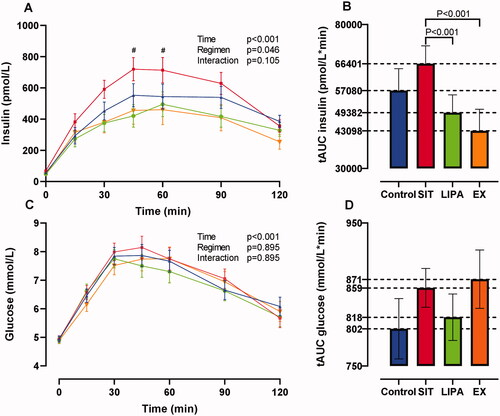
Table 3. Cardiometabolic health outcomes.
Discussion
Despite the well-known CM health benefits of exercise in MS [Citation18], adherence to structured exercise remains low and PA levels appear to be unaffected by exercise interventions [Citation19,Citation20]. Consequently, other strategies are needed to prevent/manage CM disease risk factors in PwMS, because observational studies report an important association with MS disease progression [Citation10,Citation16,Citation17]. This proof-of-concept study compared the CM health effects of 1 daily bout of vigorous-intensity exercise with more LIPA throughout the day, which induced less exertion in PwMS. Our cross-sectional analysis with data of the CONTROL regimen confirmed that SB was inversely correlated with CM health in PwMS. Furthermore, CM health improved significantly when SB was replaced with LIPA from the SIT to the LIPA regimen, which is in line with our previous research on healthy, sedentary subjects, T2DM patients, and persons with obesity [Citation24–27].
All insulin sensitivity measures significantly improved after LIPA compared to SIT. This is consistent with previous findings reporting a stimulation of the contraction-mediated glucose uptake pathway and an upregulation of the insulin signalling pathway after respectively 1 and 3 days of interrupting sitting with LIPA [Citation44]. In addition, Remie et al. recently reported improved whole-body insulin sensitivity following a similar LIPA regimen using the gold standard hyperinsulinaemic-euglycaemic clamp technique in postmenopausal women [Citation27]. This was due to an improvement in peripheral (mainly muscle) insulin sensitivity, originating from an enhanced insulin-stimulated glycogen storage. Hepatic insulin sensitivity did not differ between SIT and LIPA, possibly due to the small sample size (n: 12). In our findings with a larger sample size, the hepatic insulin resistance index significantly improved (−16%), but the improvement of the muscle insulin sensitivity index was twice this magnitude (+33%). This might indicate similar underlying mechanisms inducing insulin sensitivity improvements in PwMS as in postmenopausal women [Citation27], with hepatic improvements possibly occurring at a faster pace or lower threshold. However, this remains speculative as we only calculated hepatic and muscle insulin sensitivity indices.
In addition to the effects on insulin sensitivity, significant improvements were observed in circulating lipids after LIPA compared to SIT, which were similar to those found in other populations [Citation24–27]. Non-HDL-C decreased by 8%, apo B by 7%, and plasma TG levels decreased most evidently by 25%. Moreover, although the a priori calculated sample size was not met, a post-hoc power analysis showed that the TG improvement in the present findings reached a power of 0.98. In the above-mentioned study of Remie et al. [Citation27], possible explanatory mechanisms were investigated by means of magnetic resonance spectroscopy and indirect calorimetry. The lipid decreases in their findings did not originate from alteration in the hepatic fat content, nor from increases in fat oxidation [Citation27]. Another plausible mechanism for the lipid improvements found in Remie et al. [Citation27] and in the current study, is an increase in muscle TG uptake and plasma HDL-C via stimulated lipoprotein lipase activity. This already occurs with light-intensity muscle contractions in rodents but needs to be confirmed in human subjects [Citation45]. Based on the current data, no conclusions can be drawn on the causal pathways inducing the lipid decreases. The exact underlying pathways of the lipid improvements and substrate use in response to LIPA need to be elucidated by means of muscle biopsies in future research.
Furthermore, insulin sensitivity and lipids improved to the same degree after LIPA and EX. This is in line with the findings of Remie et al. in postmenopausal women [Citation27] but not with our previous findings in healthy students and (mainly male) T2DM patients, where LIPA was superior to EX [Citation25,Citation26]. Possibly, the EE of the LIPA and EX regimen in our previous findings was more accurately matched than in the present (mainly female) PwMS and in the postmenopausal women of Remie et al. [Citation27]. This might be caused by the equation that was used to design the exercise sessions. This equation was based on healthy men [Citation26,Citation46,Citation47], who might have a comparable EE as healthy students [Citation25] and male T2DM patients [Citation26] while cycling. In contrast, postmenopausal women [Citation27] and PwMS might have a higher EE for similar cycling outputs. This has already been reported specifically for PwMS with walking activities, where EE at a given step rate was higher compared to healthy controls due to deconditioning and decreased motor control [Citation48]. The V̇O2-pulse coefficient calculation in the present findings supported the hypothesis of an EE mismatch between LIPA and EX, and showed that the EE within the EX regimen was higher compared to the LIPA regimen. Furthermore, Remie et al. [Citation27] found similar LIPA and EX effects on skeletal muscle metabolomics in a dose-response manner. Hence, a more accurate EE matching could hypothetically have resulted in superior results of the LIPA regimen, in line with our findings in healthy students and T2DM patients [Citation25,Citation26]. However, this is only speculative because the actual EE during exercise sessions was not measured via indirect calorimetry.
The effects on vascular function are less straightforward. SBP did not change over the study course and DBP was lower after EX compared to SIT and LIPA. In the general population, including normotensive adults, a dose-response relationship has been reported between exercise intensity and blood pressure improvements [Citation49]. Consequently, the vigorous cycling intensity in the EX regimen might explain our findings for DBP. In contrast, persons with obesity in our previous study had a comparable baseline DBP, and significant decreases were found after the LIPA regimen [Citation24]. This apparent discrepancy may be explained by differences in standing and walking time. The obese persons were walking for 4.3 ± 0.5 h (∼25 000 steps) and standing for 4.0 ± 1.0 h per day, while PwMS walked 2.7 ± 0.7 h (∼14 000 steps) and stood 4.7 ± 1.4 h per day. Hence, standing may not be a sufficient stimulus to decrease blood pressure. However, further increasing walking time does not seem realistic for PwMS, which warrants the exploration of other strategies. Dempsey et al. found more profound effects on both SBP and DBP when brief bouts of simple resistance-type activities (such as calf-, knee raises, and squats) were added to a LIPA regimen in normotensive T2DM patients [Citation50]. This strategy may provide a more feasible and potent cardiovascular stimulus for PwMS as well. Furthermore, HRrest was lower after LIPA compared to SIT in the present findings, which is in line with the findings of Dempsey et al. [Citation50], but not with those of the obese participants in our previous study [Citation24]. However, heart rate and blood pressure variables are typically insufficient for capturing vascular function [Citation18], limiting strong conclusions based on the current data. Ranadive et al. [Citation51] already showed in a cross-sectional study that compared to healthy persons, PwMS have higher levels of subclinical atherosclerosis. This was measured as intima-media thickness, carotid artery stiffness, reactive hyperemia, and flow-mediated dilation [Citation51]. Hence, these subclinical markers of atherosclerosis should be included in future interventional research.
CRP, which is a common inflammatory marker and has been associated with MS disease progression and subclinical atherosclerosis [Citation51], significantly increased after the EX regimen. However, the mean CRP was still well within an acceptable clinical range, and the increase probably resulted from an acute short-term inflammatory response which can be observed up to 48 h after exercise [Citation52]. Furthermore, baseline CRP levels were also low and previous observational research showed that they are unrelated to PA in MS, probably due to the use of disease-modifying agents such as immune suppressors [Citation51]. Other inflammation and immune (cell) function markers should be included in future research and measured >48 h after the last intervention day, to comprehensively understand the effect of LIPA and EX on arterial function and MS pathophysiology.
Compliance with the instructions during the activity regimens was very high. Participants significantly reduced their (prolonged) SB and increased standing and walking time in the LIPA regimen. Increases in walking time were however mainly of moderate rather than light-intensity. This is probably because the required walking time was high (3 h), and most participants went outside for walks. However, participants reported that they always performed multiple short walks instead of one continuous walking bout and that they walked at a self-perceived light intensity. Furthermore, levels of perceived exertion during the LIPA regimen were significantly lower than in the EX regimen. It also became evident from patient conversations that the LIPA regimen was more feasible than the EX regimen. However, the aim of the present study was not to explore the feasibility but to provide proof-of-concept evidence on the potential of LIPA to improve CM health. Consequently, the implemented PA/SB levels were not representative of normal activity in PwMS. Translation of the current findings into longer-term, real-life behavioural interventions is therefore warranted, and standardised qualitative interviews should be included to measure feasibility. Furthermore, possible dose-response relationships have to be explored to investigate the most optimal LIPA “dose.” The present study was not powered to perform subanalyses and the variation of SB and PA within the regimens was low because participants had to adhere to strict protocol instructions. However, our data provide a first indication that lower levels of LIPA may already be sufficient to improve CM health outcomes of PwMS. (1) We found comparable significant lipid and insulin sensitivity improvements from SIT to LIPA as in our previous findings in healthy subjects, T2DM patients, and obese persons [Citation24–27] while the increase in daily step count was smaller in the current MS sample (+11 500 vs. +23 300, +13 100 and +21 400, respectively) [Citation24–27], and (2) CM health in the current study also improved, albeit non-significantly, following the smaller SB replacements from CONTROL to LIPA (+1.9 h self-perceived LIPA).
A strength of the current study is that the activPAL3® monitor was used, which is considered the gold standard to measure SB in free-living conditions [Citation53,Citation54]. A limitation of our study was that most participants had the relapsing-remitting phenotype of MS and that they only had mild to moderate disability, limiting generalisability of these findings to other phenotypes and non-ambulatory PwMS. The gender distribution within our sample (78.6% female) closely aligned with the overall MS population [Citation55], but we cannot draw conclusions on differential LIPA effects between sexes. Furthermore, the EE matching between regimens was not completely successful, future studies should more accurately estimate/measure EE during exercise.
In conclusion, interrupting and replacing SB with self-perceived LIPA such as standing and walking, improved insulin sensitivity and the lipid profile to the same extent as a vigorous-intensity exercise in PwMS, even though the energy expenditure of LIPA was lower. This implies that it might be more important to regularly interrupt SB with LIPA throughout the day rather than performing all PA in one exercise session. Furthermore, increasing LIPA induced less exertion. Given the ubiquity of SB and poor adherence to structured exercise, LIPA strategies may have important implications for the CM health management of PwMS. To guide long-term behavioural LIPA interventions, future studies are needed to further elaborate on the minimal required LIPA dose and the addition of other LIPA intervention components such as simple resistance activities to also improve the vascular function.
Acknowledgements
We would like to thank all study participants and acknowledge M. Scherrenberg for the interpretation of the electrocardiograms.
Disclosure statement
No potential conflict of interest was reported by the author(s).
Additional information
Funding
References
- Tullman MJ. Overview of the epidemiology, diagnosis, and disease progression associated with multiple sclerosis. Am J Manag Care. 2013;19(2 Suppl):S15–S20.
- Noseworthy JH, Lucchinetti C, Rodriguez M, et al. Multiple sclerosis. N Engl J Med. 2000;343(13):938–952.
- Asano M, Duquette P, Andersen R, et al. Exercise barriers and preferences among women and men with multiple sclerosis. Disabil Rehabil. 2013;35(5):353–361.
- Motl RW. Physical activity and irreversible disability in multiple sclerosis. Exerc Sport Sci Rev. 2010;38(4):186–191.
- Klaren RE, Motl RW, Dlugonski D, et al. Objectively quantified physical activity in persons with multiple sclerosis. Arch Phys Med Rehabil. 2013;94(12):2342–2348.
- Veldhuijzen van Zanten JJ, Pilutti LA, Duda JL, et al. Sedentary behaviour in people with multiple sclerosis: is it time to stand up against MS? Mult Scler. 2016;22(10):1250–1256.
- Tremblay MS, Aubert S, Barnes JD, et al. Sedentary behavior research network (SBRN) - Terminology consensus project process and outcome. Int J Behav Nutr Phys Act. 2017;14(1):75.
- WHO Guidelines Approved by the Guidelines Review Committee. WHO guidelines on physical activity and sedentary behaviour. Geneva: World Health Organization; 2020.
- Wang Y, Bos SD, Harbo HF, et al. Genetic overlap between multiple sclerosis and several cardiovascular disease risk factors. Mult Scler. 2016;22(14):1783–1793.
- Oliveira SR, Simão AN, Kallaur AP, et al. Disability in patients with multiple sclerosis: influence of insulin resistance, adiposity, and oxidative stress. Nutrition. 2014;30(3):268–273.
- Pagano G, Cavallo-Perin P, Cassader M, et al. An in vivo and in vitro study of the mechanism of prednisone-induced insulin resistance in healthy subjects. J Clin Invest. 1983;72(5):1814–1820.
- Keytsman C, Eijnde BO, Hansen D, et al. Elevated cardiovascular risk factors in multiple sclerosis. Mult Scler Relat Disord. 2017;17:220–223.
- Hubbard EA, Motl RW, Fernhall B. Sedentary behavior and blood pressure in patients with multiple sclerosis. Int J MS Care. 2018;20(1):1–8.
- Wens I, Dalgas U, Deckx N, et al. Does multiple sclerosis affect glucose tolerance? Mult Scler. 2014;20(9):1273–1276.
- Wens I, Dalgas U, Stenager E, et al. Risk factors related to cardiovascular diseases and the metabolic syndrome in multiple sclerosis – a systematic review. Mult Scler. 2013;19(12):1556–1564.
- Marrie RA, Rudick R, Horwitz R, et al. Vascular comorbidity is associated with more rapid disability progression in multiple sclerosis. Neurology. 2010;74(13):1041–1047.
- Weinstock-Guttman B, Zivadinov R, Mahfooz N, et al. Serum lipid profiles are associated with disability and MRI outcomes in multiple sclerosis. J Neuroinflammation. 2011;8(1):127.
- Ewanchuk BW, Gharagozloo M, Peelen E, et al. Exploring the role of physical activity and exercise for managing vascular comorbidities in people with multiple sclerosis: a scoping review. Mult Scler Relat Disord. 2018;26:19–32.
- Coulter EH, Bond S, Dalgas U, et al. The effectiveness of interventions targeting physical activity and/or sedentary behaviour in people with multiple sclerosis: a systematic review. Disabil Rehabil. 2020;42(5):594–612.
- Casey B, Coote S, Hayes S, et al. Changing physical activity behavior in people with multiple sclerosis: a systematic review and meta-analysis. Arch Phys Med Rehabil. 2018;99(10):2059–2075.
- Mehrabani G, Aminian S, Norton S, et al. Preliminary efficacy of the “SitLess with MS” intervention for changing sedentary behaviour, symptoms, and physical performance in multiple sclerosis. Disabil Rehabil. 2021:1–8.
- Baird JF, Sasaki JE, Sandroff BM, et al. Feasibility of “sit less, move more”: an intervention for reducing sedentary behavior among African Americans with MS. Mult Scler J Exp Transl Clin. 2020;6(2):2055217320932341.
- Ryan JM, Fortune J, Stennett A, et al. Safety, feasibility, acceptability and effects of a behaviour-change intervention to change physical activity behaviour among people with multiple sclerosis: results from the iStep-MS randomised controlled trial. Mult Scler. 2020;26(14):1907–1918.
- Duvivier B, Schaper NC, Koster A, et al. Benefits of substituting sitting with standing and walking in free-living conditions for cardiometabolic risk markers, cognition and mood in overweight adults. Front Physiol. 2017;8:353.
- Duvivier BM, Schaper NC, Bremers MA, et al. Minimal intensity physical activity (standing and walking) of longer duration improves insulin action and plasma lipids more than shorter periods of moderate to vigorous exercise (cycling) in sedentary subjects when energy expenditure is comparable. PLOS One. 2013;8(2):e55542.
- Duvivier BM, Schaper NC, Hesselink MK, et al. Breaking sitting with light activities vs structured exercise: a randomised crossover study demonstrating benefits for glycaemic control and insulin sensitivity in type 2 diabetes. Diabetologia. 2017;60(3):490–498.
- Remie CME, Janssens GE, Bilet L, et al. Sitting less elicits metabolic responses similar to exercise and enhances insulin sensitivity in postmenopausal women. Diabetologia. 2021;64(12):2817–2828.
- Thompson AJ, Banwell BL, Barkhof F, et al. Diagnosis of multiple sclerosis: 2017 revisions of the McDonald criteria. Lancet Neurol. 2018;17(2):162–173.
- Feldhege F, Mau-Moeller A, Lindner T, et al. Accuracy of a custom physical activity and knee angle measurement sensor system for patients with neuromuscular disorders and gait abnormalities. Sensors. 2015;15(5):10734–10752.
- Savelberg H, Berendsen, BA, Granat M. An ActivPAL cycling algorithm: validity and relevance [conference presentation abstract]. Special Interest Group: J. Assessment and Methodologies in Behavioral Nutrition and Physical Activity. ISBNPA XChange Initiative International Society of Behavioral Nutrition and Physical Activity; 2021.
- Courtney JB, Nuss K, Lyden K, et al. Comparing the activPAL software’s primary time in bed algorithm against self-report and van der berg’s algorithm. Meas Phys Educ Exerc Sci. 2021;25(3):212–226.
- Tudor-Locke C, Sisson SB, Collova T, et al. Pedometer-determined step count guidelines for classifying walking intensity in a young ostensibly healthy population. Can J Appl Physiol. 2005;30(6):666–676.
- Ryan CG, Grant PM, Tigbe WW, et al. The validity and reliability of a novel activity monitor as a measure of walking. Br J Sports Med. 2006;40(9):779–784.
- Lyden K, Keadle SK, Staudenmayer J, et al. The activPALTM accurately classifies activity intensity categories in healthy adults. Med Sci Sports Exerc. 2017 May;49(5):1022–1028.
- Lucernoni KM, Kim S, Byrnes WC. ActivPAL accuracy in determining metabolic rate during walking, running and cycling. J Sports Sci. 2021;20:1–9.
- Pettitt R, Pettitt C, Cabrera C, et al. A theoretical method of using heart rate to estimate energy expenditure during exercise. Int J Sports Sci Coach. 2007;2(3):319–327.
- Cleland BT, Ingraham BA, Pitluck MC, et al. Reliability and validity of ratings of perceived exertion in persons with multiple sclerosis. Arch Phys Med Rehabil. 2016;97(6):974–982.
- Matthews JN, Altman DG, Campbell MJ, et al. Analysis of serial measurements in medical research. BMJ. 1990;300(6719):230–235.
- Matsuda M, DeFronzo RA. Insulin sensitivity indices obtained from oral glucose tolerance testing: comparison with the euglycemic insulin clamp. Diabetes Care. 1999;22(9):1462–1470.
- Abdul-Ghani MA, Matsuda M, Balas B, et al. Muscle and liver insulin resistance indexes derived from the oral glucose tolerance test. Diabetes Care. 2007;30(1):89–94.
- O'Donovan SD, Lenz M, Goossens GH, et al. Improved quantification of muscle insulin sensitivity using oral glucose tolerance test data: the MISI calculator. Sci Rep. 2019;9(1):9388.
- Heine M, Hoogervorst ELJ, Hacking HGA, et al. Validity of maximal exercise testing in people with multiple sclerosis and low to moderate levels of disability. Phys Ther. 2014;94(8):1168–1175.
- Langeskov-Christensen M, Langeskov-Christensen D, Overgaard K, et al. Validity and reliability of VO2-max measurements in persons with multiple sclerosis. J Neurol Sci. 2014;342(1–2):79–87.
- Bergouignan A, Latouche C, Heywood S, et al. Frequent interruptions of sedentary time modulates contraction- and insulin-stimulated glucose uptake pathways in muscle: ancillary analysis from randomized clinical trials. Sci Rep. 2016;6:32044.
- Bey L, Hamilton MT. Suppression of skeletal muscle lipoprotein lipase activity during physical inactivity: a molecular reason to maintain daily low-intensity activity. J Physiol. 2003;551(2):673–682.
- Lang PB, Latin RW, Berg KE, et al. The accuracy of the ACSM cycle ergometry equation. Med Sci Sports Exerc. 1992;24(2):272–276.
- Achten J, Jeukendrup AE. Maximal fat oxidation during exercise in trained men. Int J Sports Med. 2003;24(8):603–608.
- Agiovlasitis S, Motl RW. Step-rate thresholds for physical activity intensity in persons with multiple sclerosis. Adapt Phys Activ Q. 2014;31(1):4–18.
- Way KL, Sultana RN, Sabag A, et al. The effect of high intensity interval training versus moderate intensity continuous training on arterial stiffness and 24 h blood pressure responses: a systematic review and meta-analysis. J Sci Med Sport. 2019 ;22(4):385–391.
- Dempsey PC, Sacre JW, Larsen RN, et al. Interrupting prolonged sitting with brief bouts of light walking or simple resistance activities reduces resting blood pressure and plasma noradrenaline in type 2 diabetes. J Hypertens. 2016;34(12):2376–2382.
- Ranadive SM, Yan H, Weikert M, et al. Vascular dysfunction and physical activity in multiple sclerosis. Med Sci Sports Exerc. 2012;44(2):238–243.
- Kasapis C, Thompson PD. The effects of physical activity on serum C-reactive protein and inflammatory markers: a systematic review. J Am Coll Cardiol. 2005;45(10):1563–1569.
- Berendsen BA, Hendriks MR, Meijer K, et al. Which activity monitor to use? Validity, reproducibility and user friendliness of three activity monitors. BMC Public Health. 2014;14:749.
- Kozey-Keadle S, Libertine A, Lyden K, et al. Validation of wearable monitors for assessing sedentary behavior. Med Sci Sports Exerc. 2011;43(8):1561–1567.
- Weber CM, Clyne AM. Sex differences in the blood-brain barrier and neurodegenerative diseases. APL Bioeng. 2021;5(1):011509.